Categories
“How to install Excel add-ins without wasting time or getting stuck?” That’s a question many Excel users ask every day. Whether analyzing sales, managing inventory, or building reports, add-ins can dramatically boost what Excel can do. But most users skip them because they’re unsure where to start.


From financial analysts to marketing teams, professionals are relying on more innovative tools. The use of Excel plug-ins has grown as more companies demand faster insights from data. Some of the best Excel add-ins for data analysis come with pre-built functions that simplify data analysis and reporting.
Knowing how to install Excel add-ins is the first step. When using Excel on Mac, specific steps and even dedicated Add-ins for Excel Mac can help you get going. The right tools save hours. They help you skip repetitive tasks and focus on insight. For instance, exploring data visually with a chart maker or creating custom Excel charts enhances your analysis.
It’s not a secret – getting started with add-ins makes Excel even more powerful. This guide shows you how to do it. No fluff. Just clear steps and practical tips.
Get ready to add more functions to your spreadsheets faster.
First…
Excel is powerful, but add-ins take it to another level. Think of more brilliant visuals, faster workflows, and better decisions—all without writing a single line of code.
Here’s why adding the right tools matters.
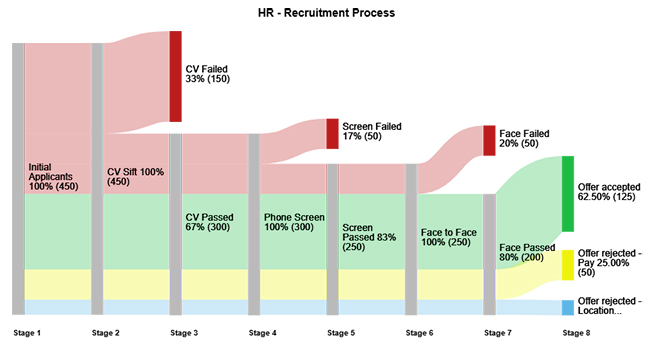
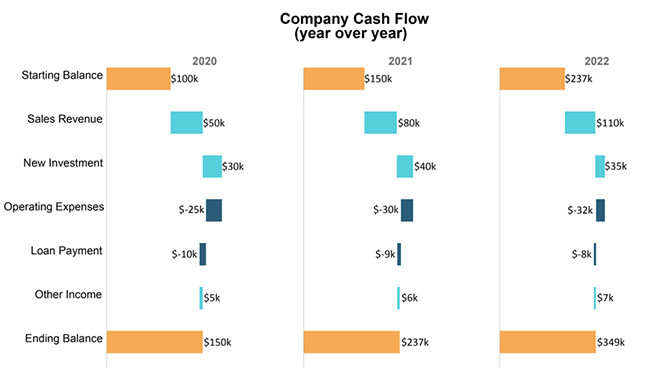
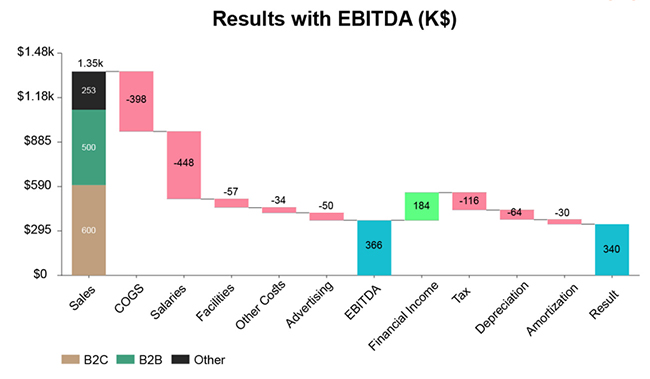
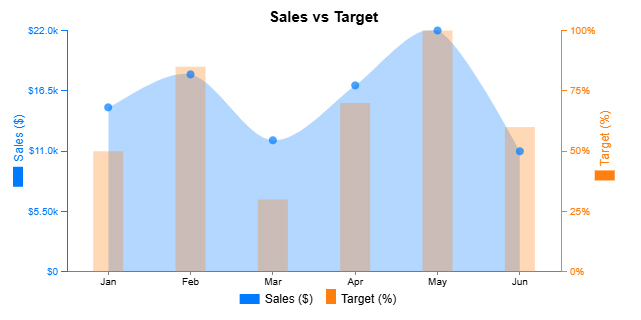
Check out the top five charts you can use with Excel add-ins, including a Stacked waterfall chart in Excel—each one created using ChartExpo.
When you bring in add-ins, Excel becomes far more powerful. And let me tell you one thing: getting started is easier than most people think. You don’t need IT support or special training—follow a few steps, and you’re ready to go.
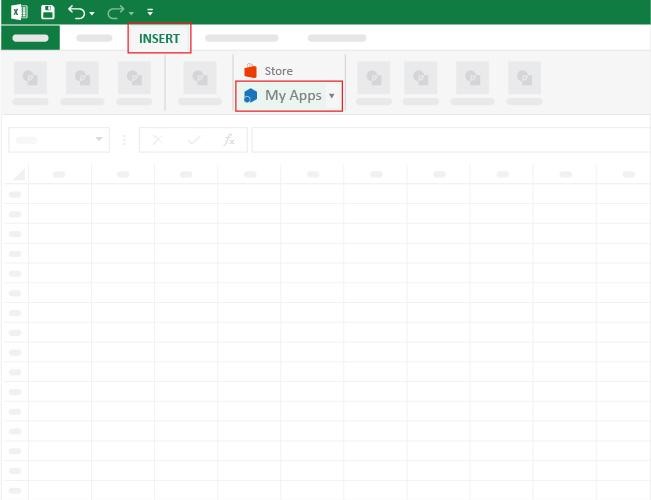
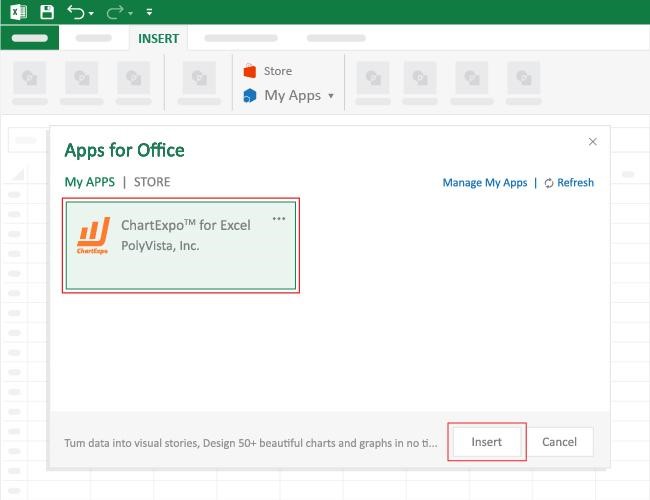
Here’s a clear breakdown of how to find, install, and manage Excel add-ins:
Have you ever tried building a stunning chart in Excel and felt like giving up halfway? You’re not alone. Excel does many things well, but advanced data visualization isn’t one of them. Its basic chart options are limited, clunky, and often hard to interpret.
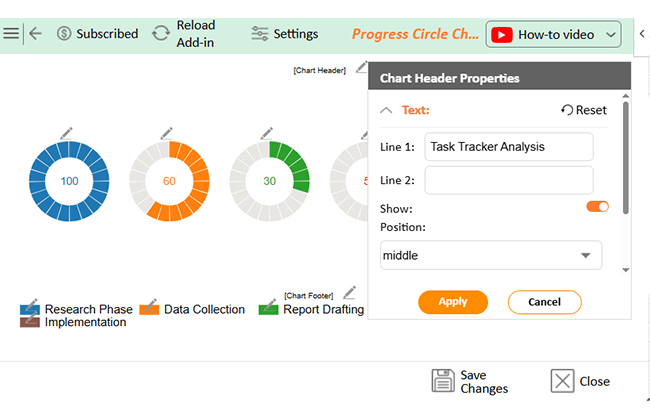
In data analysis, how you present your findings matters. That’s where tools like ChartExpo come in. It’s a powerful add-in that transforms plain data into visual gold. But before building better charts, you must know how to install Excel add-ins.
Let’s break it down.
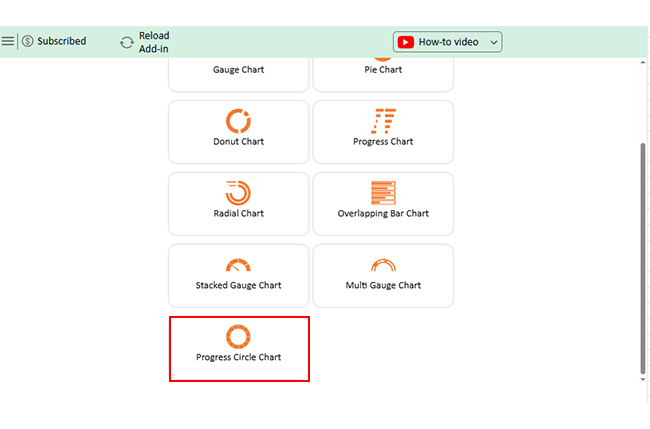
How to Install ChartExpo in Excel?
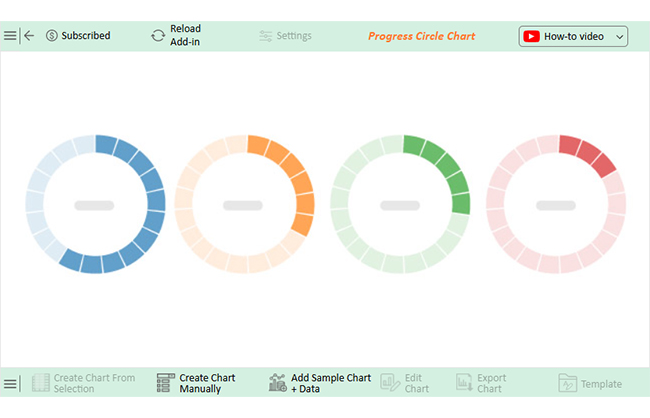
ChartExpo charts are available both in Google Sheets and Microsoft Excel. Please use the following CTAs to install the tool of your choice and create beautiful visualizations with a few clicks in your favorite tool.
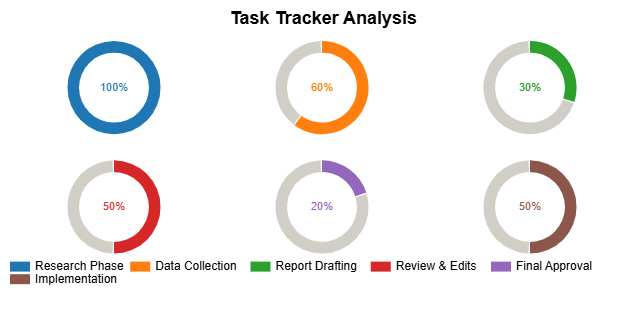
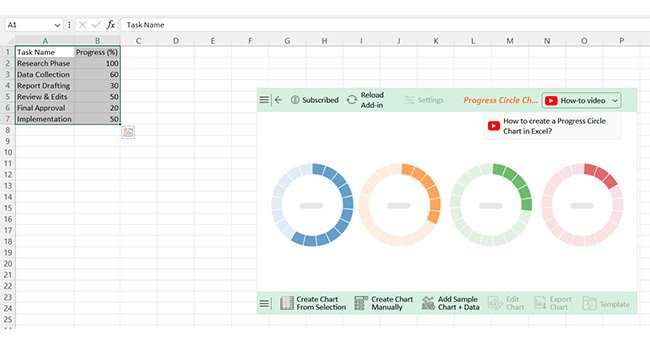
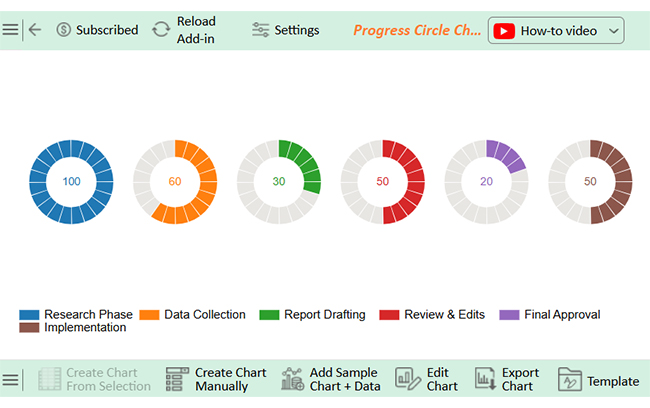
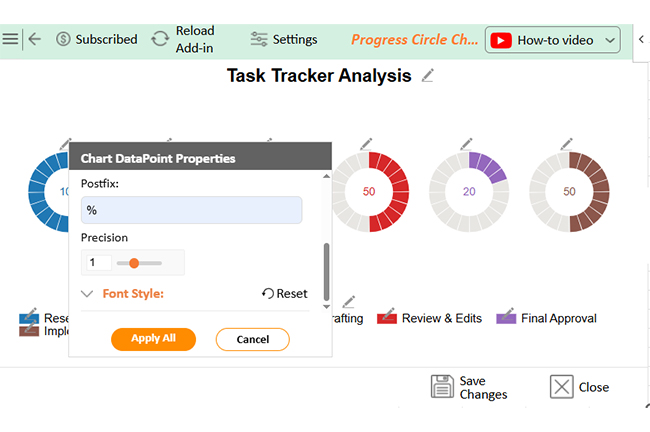
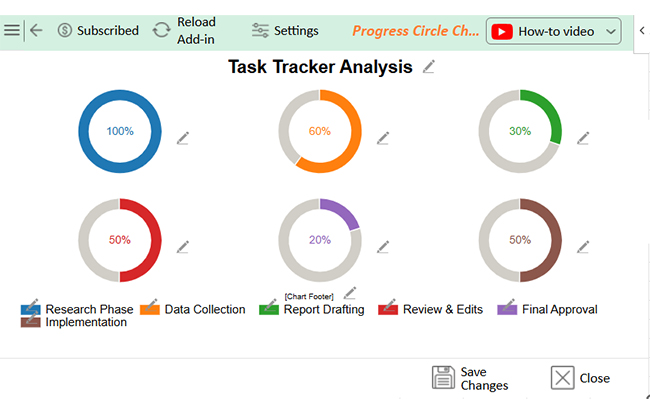
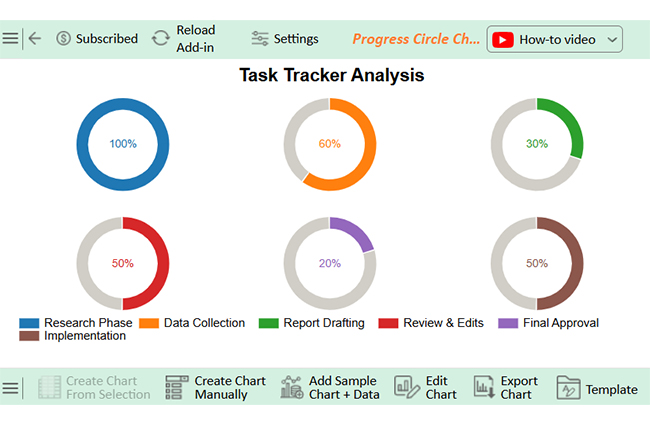
Let’s visualize and analyze this sample data in Excel using ChartExpo.
|
Task Name |
Progress (%) |
| Research Phase | 100 |
| Data Collection | 60 |
| Report Drafting | 30 |
| Review & Edits | 50 |
| Final Approval | 20 |
| Implementation | 50 |


Not all Excel add-ins are created equal. Some save you hours, others slow things down. Choosing the right one makes all the difference—and it starts with knowing what to look for.
Your Excel version might be outdated or missing updates. Some add-ins require specific Excel editions like Office 365. Also, add-ins can be turned off in settings or blocked by IT policies.
Installing Excel add-ins is simple. It takes just a few clicks; you don’t need coding skills or advanced training.
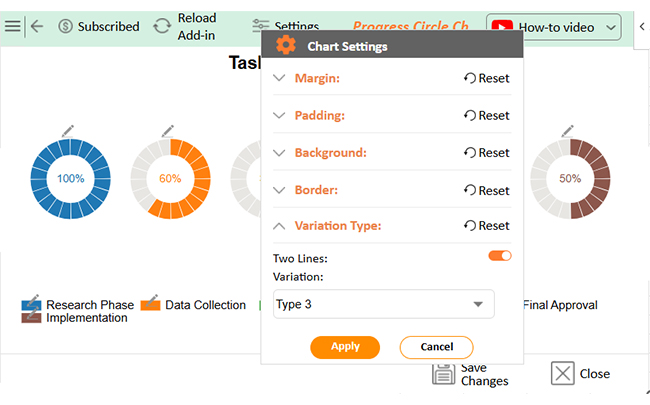
Add-ins help you go beyond Excel’s limits. They save time and make tasks easier. From automation to data cleaning, they do it all. One significant benefit is better visuals. Advanced Excel charts give you more control and better insights. Built-in charts often fall short of deep analysis.
Want to know how to add a chart in Excel with impact? Use a chart add-in. It makes the process faster and the results more professional. You can also create custom Excel charts. These add-ins allow you to design visuals that match your exact needs. They’re great for reports, dashboards, and presentations.
In conclusion, Excel add-ins turn a basic spreadsheet into an innovative tool. Whether you’re analyzing sales or tracking projects, the right add-in makes a big difference. Try one today and see how much more Excel can do.
How much did you enjoy this article?


Learn how to use sparklines in Excel to quickly visualize trends inside cells. Discover types, creation steps, customization, use cases, benefits, and best practices.

Learn what a confidence interval graph is, how to create it in Excel, and how to interpret results to make more reliable, data-driven decisions.

A correlation matrix in Excel helps identify relationships between variables. Learn how to create, read, and use it for effective data analysis.


