• Home
  • Tools dropdown img
    • Spreadsheet Charts

      • ChartExpo for Google Sheets
      • ChartExpo for Microsoft Excel
    • Power BI Charts

      • Power BI Custom Visuals by ChartExpo
    • Word Cloud

  • Charts dropdown img
    • Chart Category

      • Bar Charts
      • Circle Graphs
      • Column Charts
      • Combo Charts
      • Comparison Charts
      • Line Graphs
      • PPC Charts
      • Sentiment Analysis Charts
      • Survey Charts
    • Chart Type

      • Box and Whisker Plot
      • Clustered Bar Chart
      • Clustered Column Chart
      • Comparison Bar Chart
      • Control Chart
      • CSAT Survey Bar Chart
      • CSAT Survey Chart
      • Dot Plot Chart
      • Double Bar Graph
      • Funnel Chart
      • Gauge Chart
      • Likert Scale Chart
      • Matrix Chart
      • Multi Axis Line Chart
      • Overlapping Bar Chart
      • Pareto Chart
      • Radar Chart
      • Radial Bar Chart
      • Sankey Diagram
      • Scatter Plot Chart
      • Slope Chart
      • Sunburst Chart
      • Tornado Chart
      • Waterfall Chart
      • Word Cloud
    • Google Sheets
      Microsoft Excel
  • Services
  • Pricing
  • Contact us
  • Blog
  • Support dropdown img
      • Gallery
      • Videos
      • Contact us
      • FAQs
      • Resources
    • Please feel free to contact us

      atsupport@chartexpo.com

Categories
All Data Visualizations Data Analytics Surveys
Add-ons/
  • Google Sheets
  • Microsoft Excel
  • Power BI
All Data Visualizations Data Analytics Surveys
Add-ons
  • Google Sheets
  • Microsoft Excel
  • Power BI

We use cookies

This website uses cookies to provide better user experience and user's session management.
By continuing visiting this website you consent the use of these cookies.

Ok

ChartExpo Survey


Home > Blog > Google Sheets

How to Edit a Google Sheet Like a Pro

How do you answer the question, “How to edit a Google Sheet?” It’s a task millions of people face daily, from small business owners tracking expenses to teachers updating class lists.

How to Edit a Google Sheet

Google Sheets enables informed decision-making across various industries. Many people worldwide use Google Workspace tools, and Google Sheets functionality is at the core of that experience.

Think of your last collaborative project. It could be a shared budget or a team schedule. Chances are, you asked yourself, “How do I edit a Google Sheet without creating confusion?” Whether adding data, formatting cells, or adjusting formulas, minor edits can have a significant impact on outcomes.

Knowing how to edit a Google Sheet can save hours. It keeps data clean, helps prevent reporting errors, and improves communication across teams. Whether adjusting a budget on Google Sheets or building a to-do list template, mastering edits is key.

From formatting rows to adding new formulas, every click counts. The process is simple once you know where to look. Learning the basics today can make following the report, chart, or shared document more efficient.

This guide will walk you through the essentials.

First…

Table of Contents:

  1. Why is editing Google Spreadsheets useful?
  2. What are the Steps to Edit Google Sheets?
  3. How to Make Google Sheets Editable or Shareable?
  4. How to Give Google Sheets Edit Permissions?
  5. How to Analyze Edited Google Sheets?
  6. Additional Tips for Editing Google Sheets
  7. Limitations of Editing Google Sheets Offline
  8. FAQs
  9. Wrap Up

Why is editing Google Spreadsheets useful?

Imagine working on a project with your team. But every time someone updates a number, you need to resend a file. It’s outright annoying, and that’s where editing a Google Spreadsheet shines. It’s not just about entering data—it’s about working smarter, faster, and together.

Let’s break down the real benefits:

  • Real-time updates: Changes appear instantly; no waiting, no confusion. Everyone sees the latest version as it happens.
  • Improved data accuracy: Fewer errors, less back-and-forth. You can apply data validation and lock cells to prevent accidental edits.
  • Custom formatting and organization: Highlight key info with colors, filters, and conditional formatting. It keeps your sheet neat and clear.
  • Dynamic calculations and formulas: Automate math, logic, and more. From basic sums to complex formulas, it’s all built in.
  • Ease of collaboration: Multiple people can work on the same sheet at once. Real-time comments and suggestions keep ideas flowing.
  • Audit trail and version history: Need to undo a change or see who did what? The version history has your back – it saves every edit.

Top Five Charts can be created after editing Google Sheets

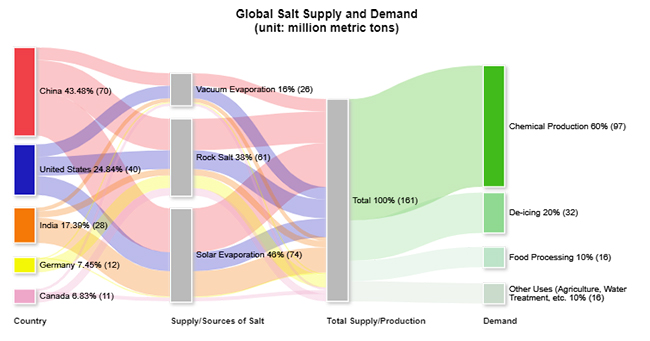
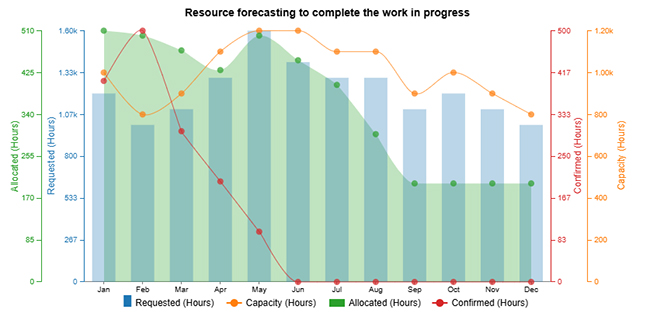
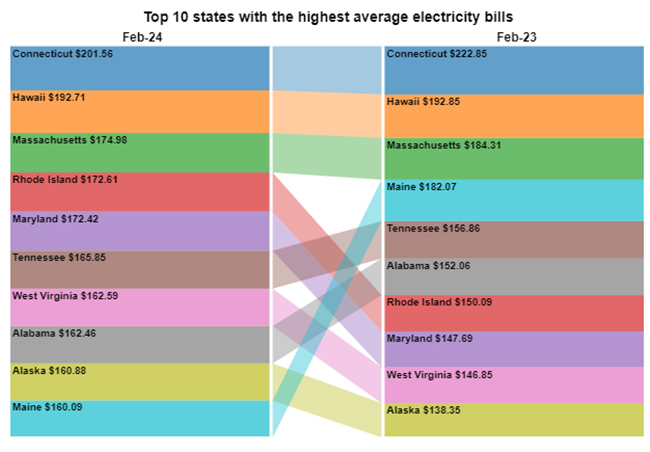
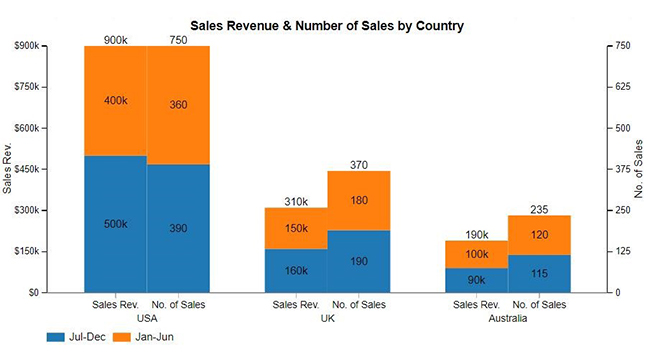
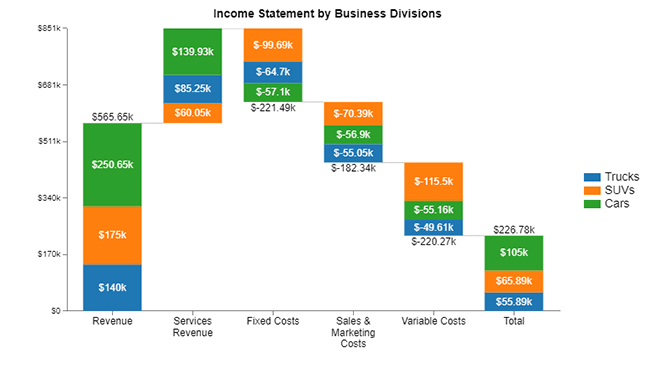
Explore the top 5 charts you can use to edit and visualize data in Google Sheets — all created with ChartExpo.

Sankey Diagram:

How to Edit a Google Sheet

Multi Axis Line Chart:

How to Edit a Google Sheet

Comparison Bar Chart:

How to Edit a Google Sheet

Clustered Stacked Bar Chart:

How to Edit a Google Sheet

Stacked Waterfall Chart:

How to Edit a Google Sheet

What are the Steps to Edit Google Sheets?

Editing a Google Sheet isn’t rocket science—but doing it right can save you time and stress. Whether you’re fixing a typo, adding totals, or sprucing things up for a meeting, these steps will guide you through it like a pro:

  1. Open Google Sheets: Head over to sheets.google.com and sign in. Pick an existing file or create a new one from scratch. That’s where the magic starts.
  2. Select the cell you want to edit: Click any cell. Once the blue outline appears, you’re in business.
  3. Enter or modify data: Need to fix a typo or add new info? Just type directly into the cell or use the formula bar. Press Enter when you’re done.
  4. Use the toolbar for formatting: Google Sheets functionality shines here. Make your data pop with bold text, color coding, currency formats, and more—all this from the toolbar.
  5. Insert formulas: Start with = and tap into formulas like SUM and IF. Or even IMPORTDATA in Google Sheets, and functions like IMPORTRANGE. It’s great for pulling info from other files or web sources.
  6. Share and collaborate: Don’t know how to share a Google Sheet? Just click the green “Share” button in the top right. You can set permissions and invite others to view, comment, or edit—perfect for teamwork in real-time.
  7. Review version history: Did you make a mistake or want to see past changes? Go to File > Version History > See version history. Every update is saved, so you’re always covered.

How to Make Google Sheets Editable or Shareable?

Need to let someone else jump into your spreadsheet? Maybe a teammate needs to update sales figures, or a friend wants to add their ideas. Thanks to built-in Google Sheets functionality, you can control exactly who sees what—and who gets to make changes. Here’s how to do it without breaking a sweat:

  1. Open your Google Sheet: Go to Google Sheets and open the file you want to share.
  2. Click the “Share” button: You’ll see it in the top-right corner—bright and hard to miss. Click it to open the sharing settings.
  3. Add people or groups: Type in the email addresses. You can share with one person or your whole team at once.
  4. Set permissions: Choose what others can do. You can let them view, comment, or edit the sheet—it’s your choice to make.
  5. Share via link (Optional): Click “Copy link” if you’d rather share through messaging or email. Adjust the link settings to decide if anyone with the link can view or edit.
  6. Click “Done”: Once everything looks right, hit Done. Just like that, your sheet is live and accessible.

How to Give Google Sheets Edit Permissions?

Let’s say you’ve created the perfect Google Sheet to-do list template. Or you’re managing a team budget on Google Sheets—but now, others need to add their input. No need to email back and forth. With a few clicks, you can give edit access and let the collaboration flow.

Here’s how to do it with ease:

  1. Open your Google Sheet: Start by opening the spreadsheet you want to share. Make sure it’s the latest version.
  2. Click the “Share” button: You’ll find it in the top-right corner. This is where the magic of Google Sheets functionality kicks in.
  3. Enter email addresses: Type in the emails of the people you want to collaborate with. Add as many as you need.
  4. Set access level: Choose Editor to allow them to make changes. You can also pick Viewer or Commenter if you want to limit access.
  5. Add a message (Optional): Let them know what the sheet is about. A quick note can save a lot of questions later.
  6. Click “Send”: Once everything looks good, hit Send. They’ll get an invite straight to their inbox.
  7. Or share via link: Click “Copy link” if you’d rather send it in a chat or message. Just make sure the link settings allow for editing if that’s what you want.

How to Analyze Edited Google Sheets?

Have you ever stared at a Google Sheet and thought, “This could look way better”? Knowing how to edit a Google Sheet helps clean up the data, but visualizing it? That’s where things get tricky. Google Sheets offers basic charts, often falling short in complex data analysis. Your pie charts start looking tired, and bar graphs lose their charm.

You need something more dynamic if you want real storytelling power. That’s where ChartExpo steps in. It transforms dull spreadsheets into insightful visuals.

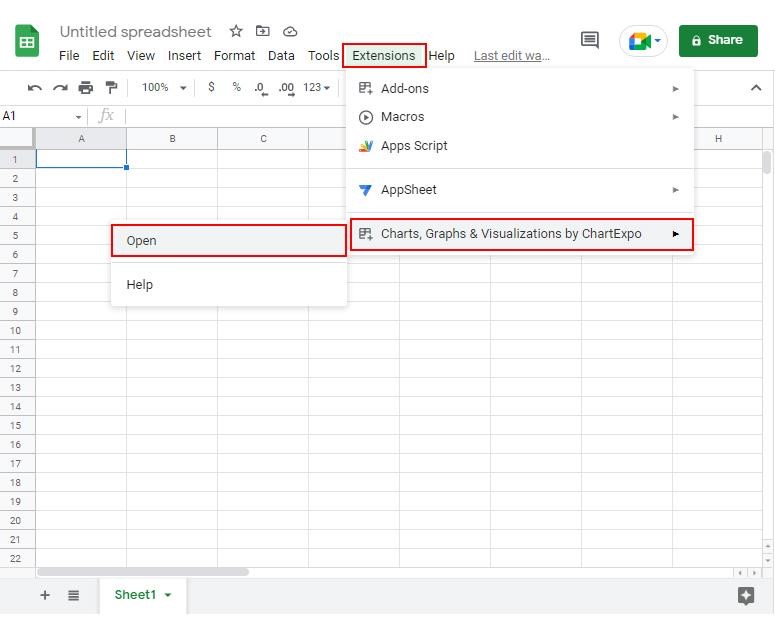
How to Install ChartExpo in Google Sheets?

  1. To start using ChartExpo, download it directly from the Google Sheets program. To do this, select Extensions from the top toolbar.
  2. A menu will appear. Click the Get add-ons option.
  3. Search for ChartExpo, and click on Charts, Graphs & Visualizations by ChartExpo when it appears in the results.
  4. Click the Install button. You will have to confirm your Google account and accept some permissions.

ChartExpo charts are available both in Google Sheets and Microsoft Excel. Please use the following CTAs to install the tool of your choice and create beautiful visualizations in a few clicks in your favorite tool.

Example

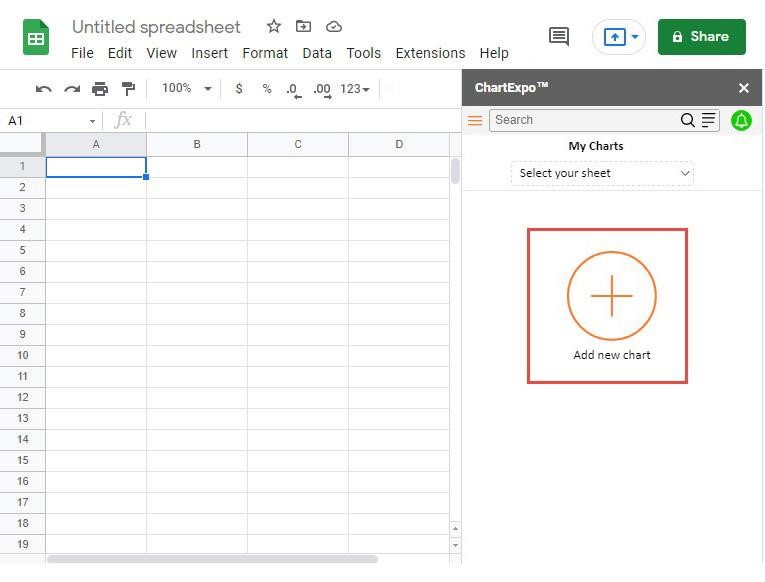
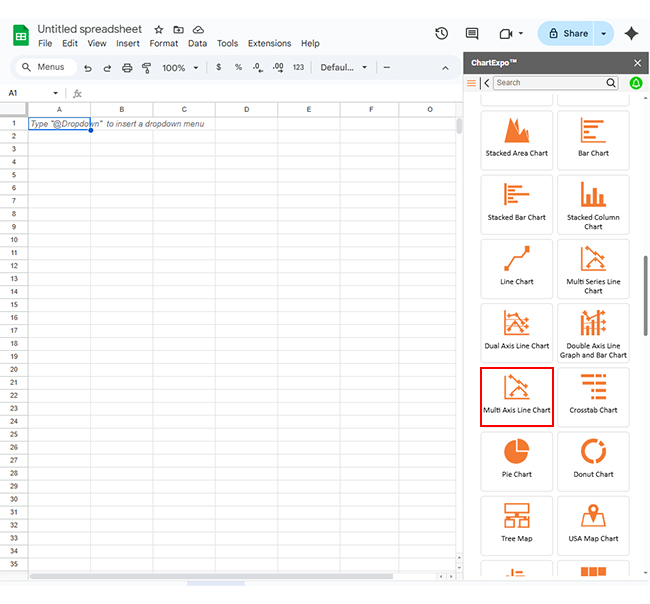
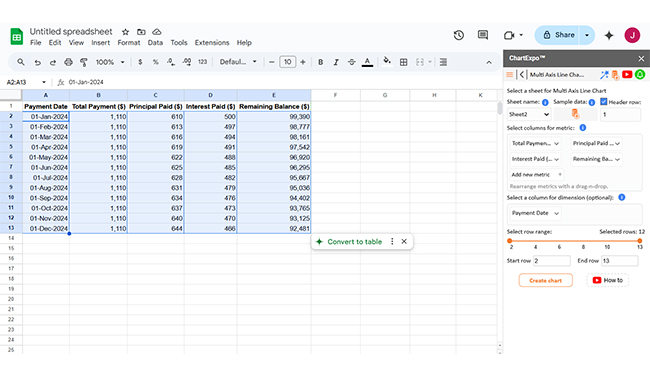
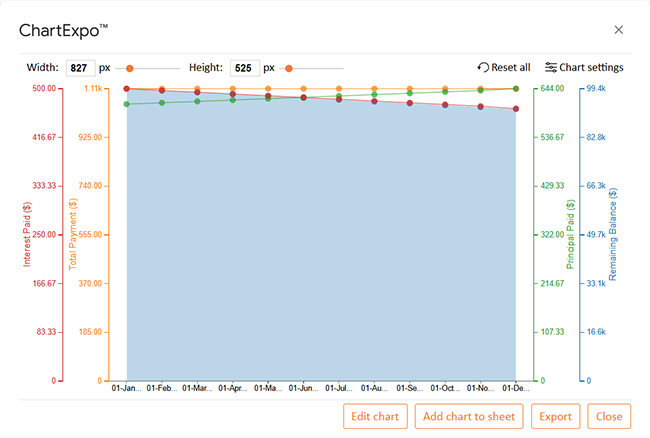
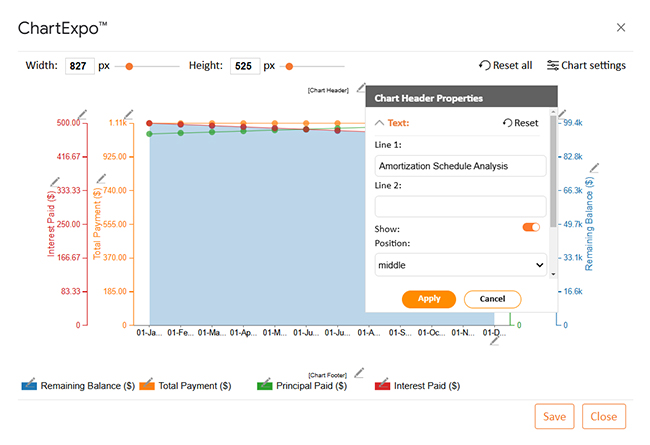
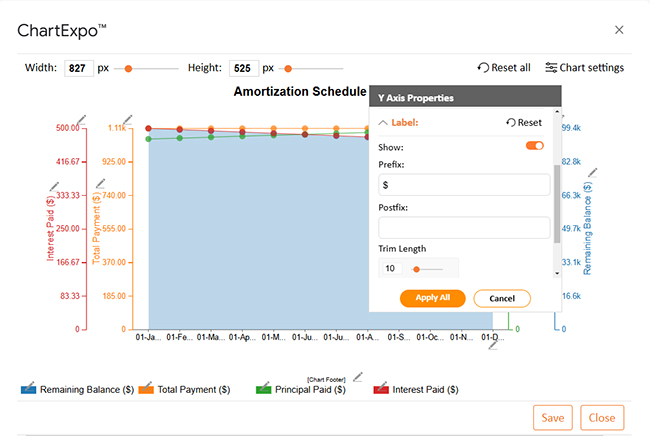
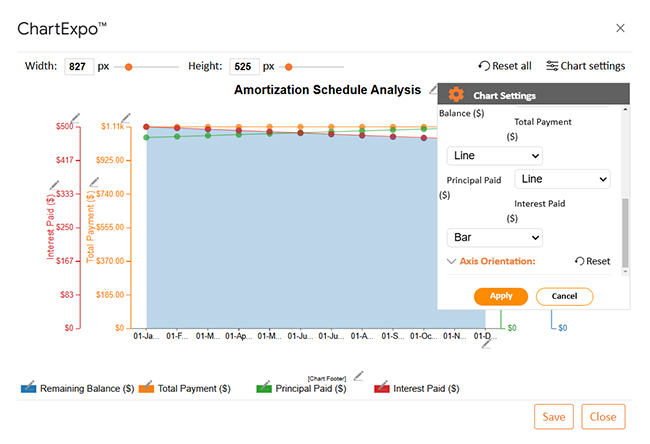
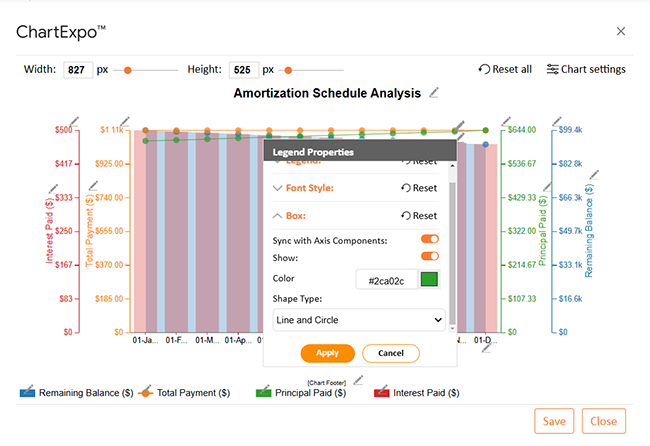
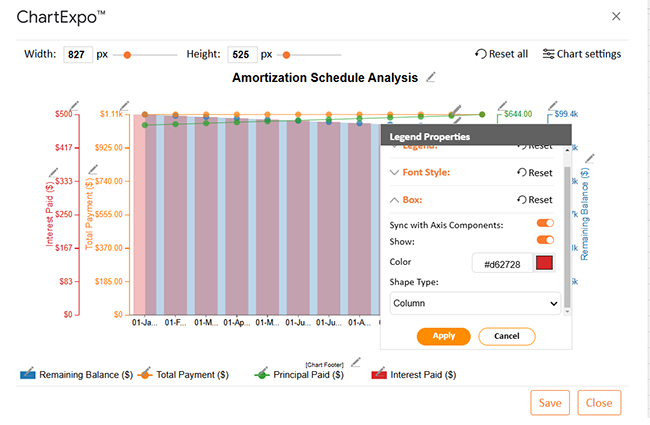
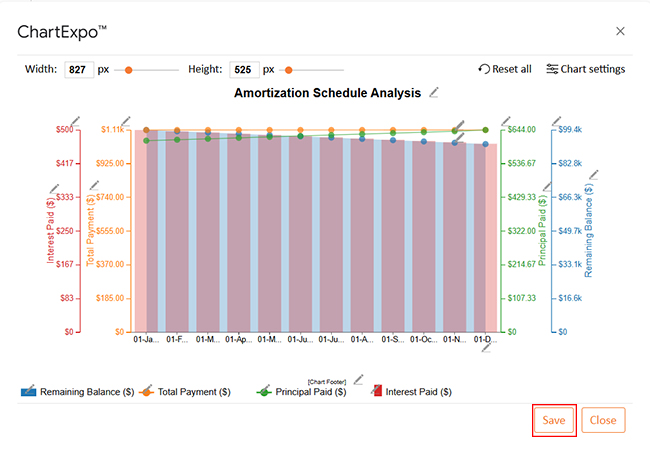
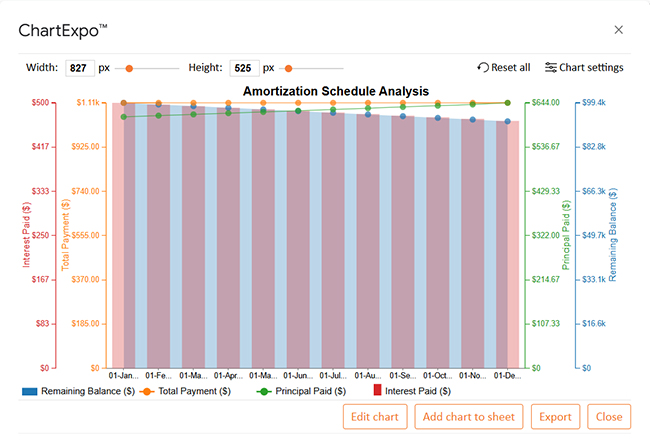
Let’s learn how to create a chart in Google Sheets using ChartExpo and analyze it.

Payment Date Total Payment ($) Principal Paid ($) Interest Paid ($) Remaining Balance ($)
01-Jan-2024 1,110 610 500 99,390
01-Feb-2024 1,110 613 497 98,777
01-Mar-2024 1,110 616 494 98,161
01-Apr-2024 1,110 619 491 97,542
01-May-2024 1,110 622 488 96,920
01-Jun-2024 1,110 625 485 96,295
01-Jul-2024 1,110 628 482 95,667
01-Aug-2024 1,110 631 479 95,036
01-Sep-2024 1,110 634 476 94,402
01-Oct-2024 1,110 637 473 93,765
01-Nov-2024 1,110 640 470 93,125
01-Dec-2024 1,110 644 466 92,481
  • To get started with ChartExpo, install ChartExpo in Google Sheets.
  • Go to Extensions > Charts, Graphs & Visualizations by ChartExpo > Open.
How to Edit a Google Sheet
  • To access the charts library, click the Add new chart button.
How to Edit a Google Sheet
  • Once it loads, scroll through the charts list to locate and choose the “Multi-Axis Line Chart”.
How to Edit a Google Sheet
  • Put the data table in the sheet first. Then, choose the Sheet name from the drop-down in the ChartExpo section.
  • Select the metric column; metric is the numeric column in your data sheet.
  • Select the dimensions column; the dimension is the categorical column in your datasheet that contains text information.
  • Click the Create chart button to complete the process.
How to Edit a Google Sheet
  • If you want to add anything to the chart, click the Edit Chart button:
How to Edit a Google Sheet
  • Click the pencil icon next to the Chart Header to change the title.
  • It will open the properties dialog. Under the Text section, you can add a heading in Line 1 and enable Show.
  • Give the appropriate title of your chart and click the Apply button.
How to Edit a Google Sheet
  • You can add the dollar sign with Revenue values and also change the precision value to zero as follows:
How to Edit a Google Sheet
  • You can change the data representation by clicking on Settings as follows:
How to Edit a Google Sheet
  • Change the label shape of Total Payment and Principal Paid into “Line and Circle” and click the “Apply” button.
How to Edit a Google Sheet
  • Change the label shape of Interest Paid into “Column” and click the “Apply” button.
How to Edit a Google Sheet
  • After making all the changes, click the “Save” button as follows:
How to Edit a Google Sheet
  • Your final Multi-Axis Line Chart will resemble the one below.
How to Edit a Google Sheet

Insights

  • Monthly payment: $1,110 per month, steady.
  • Payment breakdown: The interest portion declines while the principal portion grows over time.
  • Balance after 1 year: Falls from $100,000 to $92,481, highlighting accelerated principal repayment.

Additional Tips for Editing Google Sheets

Do you want to make editing Google Sheets faster and more efficient? A few clever tips can save you time and reduce errors:

  • Master keyboard shortcuts: Quick actions mean fewer clicks. From duplicating rows to applying formulas, shortcuts speed up every task and improve overall Google Sheets functionality.
  • Freeze important rows or columns: Keep headers or key data visible as you scroll. Large sheets are easier to read, especially during what-if analysis in Google Sheets or data reviews.
  • Protect sensitive data: The Protect Range feature locks critical cells or columns. This stops others from accidentally overwriting important information.
  • Enhance accuracy with data validation and conditional formatting: Set rules to control what data users can enter. Combine this with conditional formatting to visually highlight duplicates, errors, or essential trends.
  • Leverage comments, notes, and add-ons: Leave comments or notes for your team to clarify instructions. Explore Google Sheets extensions and add-ons for automation, reporting, and even live data imports for deeper insights.

Limitations of Editing Google Sheets Offline

Are you thinking about editing Google Sheets offline? It’s doable, but you should know a few things beforehand. Offline mode has limits, and here’s what to expect:

  • Initial setup required: Before editing offline, you must enable offline access in your Google Drive settings. Without this step, the sheet stays view-only when you’re disconnected.
  • Limited functionality: Offline mode doesn’t support everything. Features like Google Sheets slicers and advanced add-ons won’t work until you’re back online.
  • Single-user access: You’re flying solo while offline. Collaboration tools and sharing options are unavailable until you reconnect.
  • No live updates: Forget real-time updates. Any changes you make won’t sync with others until your device returns online.
  • Device-specific: Offline access only works on the device where you’ve enabled it. If you start editing on your laptop, you won’t automatically have offline access on your phone or tablet.
  • Storage dependency: Your device needs enough local storage space to save offline changes. If the storage is low, your offline editing session might hit a wall.

FAQs

How do I enable editing in Google Sheets?

  • Open your Google Sheet.
  • Click the “Share” button.
  • Enter the email addresses of users.
  • Set their access level to “Editor”.
  • Click “Send”.
  • Alternatively, you can generate a link and adjust the permissions.

How do I edit an existing Google Sheet?

  • Open the sheet from Google Drive.
  • Click the cell you want to change.
  • Enter new data or modify existing content.
  • Use the toolbar for formatting options.
  • Add formulas where needed.
  • Changes save automatically.

How do I edit a Google Sheet that was shared with me?

  • Open the sheet from the shared link or email.
  • Confirm you have Editor permissions.
  • Click on the cell to start editing.
  • Add or modify data.
  • Use formatting or formulas if needed.
  • All updates save automatically.

Wrap Up

Editing a Google Sheet is simple but powerful. Whether you’re updating numbers or reorganizing columns, small changes make a significant impact. New features driven by Google Sheets’ artificial intelligence make editing even easier. Innovative suggestions help you fill in data more quickly and reduce mistakes.

Learning how to add a series in Google Sheets can improve your data analysis. Adding series is key when comparing trends over time or across categories. Want more control? Try a Google Sheets Extension. Extensions bring advanced editing tools, better automation, and new ways to manage your data.

Once your data looks right, visualize it. Knowing how to create a chart in Google Sheets helps turn raw information into clear, insightful visuals. Charts make your data easier to understand at a glance.

Conclusively, mastering how to edit a Google Sheet makes you more efficient. It saves time, improves accuracy, and supports better decision-making. Install ChartExpo for Google Sheets today for clean, clear, and valuable data.

How much did you enjoy this article?

GSAd1
Start Free Trial!
155962

Related articles

next previous
Google Sheets10 min read

Import CSV to Google Sheets: A Quick Walkthrough

Importing CSV to Google Sheets allows you to upload and use CSV data. Click here to learn how to import, analyze, and manage CSV files in Google Sheets.

Google Sheets8 min read

How to Duplicate a Google Sheet: A Complete Guide

How to duplicate a Google Sheet involves creating an exact copy for reuse or backup. Learn quick methods and smart tips to boost your spreadsheet workflow.

Google Sheets9 min read

Business Expenses Spreadsheet: Improving Insights

A spreadsheet for business expenses helps track and manage company costs. Click here to learn how to build one, analyze data, and boost financial control.

Google Sheets8 min read

Debt Tracker in Google Sheets: A Complete Guide

A debt tracker Google Sheet helps you manage and monitor debt easily. Learn how to build, customize, and analyze it for smarter financial decisions.

Google Sheets8 min read

Assignment Tracker Google Sheet Template: Quick Insights

An assignment tracker Google Sheet template helps track tasks and deadlines. Click here to learn how to create one, who can use it, and see real examples.

ChartExpo logo

Turn Data into Visual
Stories

CHARTEXPO

  • Home
  • Gallery
  • Videos
  • Services
  • Pricing
  • Contact us
  • FAQs
  • Privacy policy
  • Terms of Service
  • Sitemap

TOOLS

  • ChartExpo for Google Sheets
  • ChartExpo for Microsoft Excel
  • Power BI Custom Visuals by ChartExpo
  • Word Cloud

CATEGORIES

  • Bar Charts
  • Circle Graphs
  • Column Charts
  • Combo Charts
  • Comparison Charts
  • Line Graphs
  • PPC Charts
  • Sentiment Analysis Charts
  • Survey Charts

TOP CHARTS

  • Sankey Diagram
  • Likert Scale Chart
  • Comparison Bar Chart
  • Pareto Chart
  • Funnel Chart
  • Gauge Chart
  • Radar Chart
  • Radial Bar Chart
  • Sunburst Chart
  • see more
  • Scatter Plot Chart
  • CSAT Survey Bar Chart
  • CSAT Survey Chart
  • Dot Plot Chart
  • Double Bar Graph
  • Matrix Chart
  • Multi Axis Line Chart
  • Overlapping Bar Chart
  • Control Chart
  • Slope Chart
  • Clustered Bar Chart
  • Clustered Column Chart
  • Box and Whisker Plot
  • Tornado Chart
  • Waterfall Chart
  • Word Cloud
  • see less

RESOURCES

  • Blog
  • Resources
  • YouTube
SIGN UP FOR UPDATES

We wouldn't dream of spamming you or selling your info.

© 2025 ChartExpo, all rights reserved.