How to compare columns in Excel? It’s a question asked every day. Why? Whether reviewing sales numbers, checking inventory, or going through customer records, getting the details right matters. One wrong match can throw off everything.
How to compare columns in Excel isn’t some fancy trick. It’s a simple and innovative way to catch issues before they become problems. Businesses use it to double-check data. This helps ensure the smooth running of operations. For instance, HR teams use employee lists to match up employees, then finance teams utilize this information to confirm transactions.
Here’s where it gets better: You don’t need to feel stuck or overwhelmed. Whether you’re looking at a short list or thousands of lines, Excel gives you choices. You can use formulas – try conditional formatting. Or even lookup functions. They all do the job—some faster, some more detailed. You decide what works best.
Would you like to make the entire process smoother? Start by knowing how to organize data in Excel. Clean data makes everything easier. Use clear headers, and keep your tables consistent. It sounds simple, but it changes everything.
And if your data feels messy or too packed, knowing how to split data in Excel helps a lot. You may need to separate full names into first and last names. Or break one column into two. Once things are neat, comparing gets a whole lot easier.
Let me take you through this concept.
First…
Definition: Column comparison in Excel helps you identify differences or matches between two data sets. It’s useful for audits, data cleaning, and error checks. Before comparing, learn how to move columns in Excel to align your data properly.
You can also use dynamic tables in Excel for flexible comparisons. For large datasets, understanding how to filter the data in Excel makes your work faster. Whether manual or automated, column comparison saves time and improves accuracy in every spreadsheet task.
Have you ever compared two Excel columns and felt unsure if your data tells the whole story? That’s where smart comparison comes in—it does more than spotting duplicates. It makes sure your data is clean, accurate, and ready to work for you.
Here’s why you should make use of this feature:
Have you ever felt stuck staring at two columns, unsure if the numbers—or names—really match? Excel has your back. You don’t need to scan line by line. Whether you’re handling short lists or massive datasets, comparing columns can be quick, transparent, and even automatic.
Here are the simple ways to do it, step by step:
Comparing columns in Excel sounds easy—until your spreadsheet turns into a maze of rows and mismatches. Excel is excellent for crunching numbers, but when it comes to visualizing them, it’s not so great. Not so much. Data analysis needs more than formulas. It needs clarity. Color. Insight. And that’s exactly where Excel falls short. Its charts are basic and often clunky. You need something sharper. Something faster.
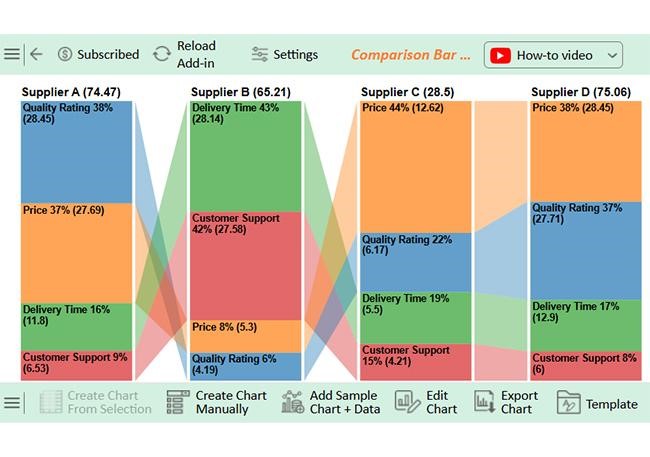
Enter ChartExpo. This tool seamlessly integrates with Excel, transforming your raw data into visually stunning and insightful visuals. It’s clean, interactive, and smart. Finally, your comparisons can look as good as they work.
How to Install ChartExpo in Excel?
ChartExpo charts are available both in Google Sheets and Microsoft Excel. Please use the following CTAs to install the tool of your choice and create beautiful visualizations with a few clicks in your favorite tool.
Let’s analyze this sample data in Excel using ChartExpo
|
Supplier |
Rating Factors |
Score |
| Supplier A | Price | 27.69 |
| Supplier A | Quality Rating | 28.45 |
| Supplier A | Delivery Time | 11.8 |
| Supplier A | Customer Support | 6.53 |
| Supplier B | Price | 5.3 |
| Supplier B | Quality Rating | 4.19 |
| Supplier B | Delivery Time | 28.14 |
| Supplier B | Customer Support | 27.58 |
| Supplier C | Price | 12.62 |
| Supplier C | Quality Rating | 6.17 |
| Supplier C | Delivery Time | 5.5 |
| Supplier C | Customer Support | 4.21 |
| Supplier D | Price | 28.45 |
| Supplier D | Quality Rating | 27.71 |
| Supplier D | Delivery Time | 12.9 |
| Supplier D | Customer Support | 6 |
Excel can do a lot, but it’s not perfect, especially when you’re trying to match columns. Things don’t always go as planned—even when your formulas look right. Sometimes, it’s the little things that cause big problems.
Let’s see what can go wrong so you can fix it faster and work smarter:
How to compare columns in Excel is a skill every Excel user needs. From small lists to extensive reports, it helps spot issues fast. Whether you’re matching names or verifying numbers, Excel has the tools to help you.
Start with the basics. Use =A1=B1 or IF() to find matches. For more precision, try EXACT() or conditional formatting.
Do you need to switch rows and columns first? Learn how to flip data in Excel. A better view can make all the difference. It helps when your data isn’t aligned correctly.
Want your comparisons to grow with your data? Use dynamic tables in Excel. Tables make your formulas more flexible and your sheet easier to manage.
If your data isn’t in the right spot, move it. Knowing how to move a table in Excel helps keep everything organized and tidy. A well-organized sheet saves time and reduces errors.
Excel can’t do everything perfectly. But with the right tricks, it gets close. Mastering column comparison gives you confidence in your data. From here, you can visualize and analyze your data with ChartExpo for valuable business growth insights. Better data means better decisions and growth.