• Home
  • Tools dropdown img
    • Spreadsheet Charts

      • ChartExpo for Google Sheets
      • ChartExpo for Microsoft Excel
    • Power BI Charts

      • Power BI Custom Visuals by ChartExpo
    • Word Cloud

  • Charts dropdown img
    • Chart Category

      • Bar Charts
      • Circle Graphs
      • Column Charts
      • Combo Charts
      • Comparison Charts
      • Line Graphs
      • PPC Charts
      • Sentiment Analysis Charts
      • Survey Charts
    • Chart Type

      • Box and Whisker Plot
      • Clustered Bar Chart
      • Clustered Column Chart
      • Comparison Bar Chart
      • Control Chart
      • CSAT Survey Bar Chart
      • CSAT Survey Chart
      • Dot Plot Chart
      • Double Bar Graph
      • Funnel Chart
      • Gauge Chart
      • Likert Scale Chart
      • Matrix Chart
      • Multi Axis Line Chart
      • Overlapping Bar Chart
      • Pareto Chart
      • Radar Chart
      • Radial Bar Chart
      • Sankey Diagram
      • Scatter Plot Chart
      • Slope Chart
      • Sunburst Chart
      • Tornado Chart
      • Waterfall Chart
      • Word Cloud
    • Google Sheets
      Microsoft Excel
  • Services
  • Pricing
  • Contact us
  • Blog
  • Support dropdown img
      • Gallery
      • Videos
      • Contact us
      • FAQs
      • Resources
    • Please feel free to contact us

      atsupport@chartexpo.com

Categories
All Data Visualizations Data Analytics Surveys
Add-ons/
  • Google Sheets
  • Microsoft Excel
  • Power BI
All Data Visualizations Data Analytics Surveys
Add-ons
  • Google Sheets
  • Microsoft Excel
  • Power BI

We use cookies

This website uses cookies to provide better user experience and user's session management.
By continuing visiting this website you consent the use of these cookies.

Ok

ChartExpo Survey


Home > Blog > Microsoft Excel

How to Use a Data Table in Excel to Enhance Your Visuals

How to use a data table in Excel?

This question often arises when managing large datasets or making decisions based on variables. Data tables are one of Excel’s most powerful features, allowing you to analyze multiple scenarios quickly and efficiently. Mastering this tool is essential for anyone looking to streamline their data processing.

Data tables simplify complex calculations and save time. They let you compare outcomes by adjusting a single or multiple variables in one place. For example, you can predict profits based on different sales figures or interest rates. Research shows over 81% of companies use spreadsheets, highlighting their value for decision-making.

How to Use a Data Table in Excel

Data tables also boost accuracy by reducing manual calculations. Errors can cost businesses billions annually. This makes precise tools like this vital. With Excel, you can set up a data table in minutes, offering clarity and structure to your analysis.

Professionals across fields rely on this feature daily. Whether forecasting budgets, tracking inventory, or planning projects, a well-organized data table makes the process seamless. Using a data table in Excel empowers you to handle data more effectively.

This post will explore step-by-step methods, examples, and tips. By the end, you’ll know how to leverage data tables for smarter decision-making.

Table of Contents:

  1. What is a Data Table in Excel?
  2. What Does a Data Table Do in Excel?
  3. How to Create a Data Table in Excel?
  4. How to Make a Two-Variable Data Table in Excel?
  5. How to Use Data Tables in Excel?
  6. How to Edit Data Table Results in Excel?
  7. How to Delete a Data Table in Excel?
  8. How to Analyze Excel Data Tables?
  9. What are the Benefits of Using Data Tables in Excel?
  10. Wrap Up

First…

What is a Data Table in Excel?

Definition: A data table in Excel is a range of cells used to organize and analyze data. It allows you to store information in rows and columns for easy management.

Data tables often perform “what-if” analysis and quickly test scenarios. You can input variables and formulas to observe how changes affect outcomes. Moreover, Excel’s data table feature helps streamline calculations, making complex data analysis easier and faster. It’s a powerful tool for decision-making and data organization.

What Does a Data Table Do in Excel?

A data table in Excel simplifies data analysis by allowing you to test different scenarios. It works with formulas to explore “what-if” situations and analyze results. You can input various values and instantly see their impact on your calculations.

There are two types of data tables: one-variable and two-variable. A one-variable table changes a single input, while a two-variable table alters two inputs. This tool is ideal for financial modeling, projections, or scenario analysis.

Excel’s data tables make it easy to compare outcomes and gain insights without re-entering formulas, saving time and boosting efficiency.

How to Create a Data Table in Excel?

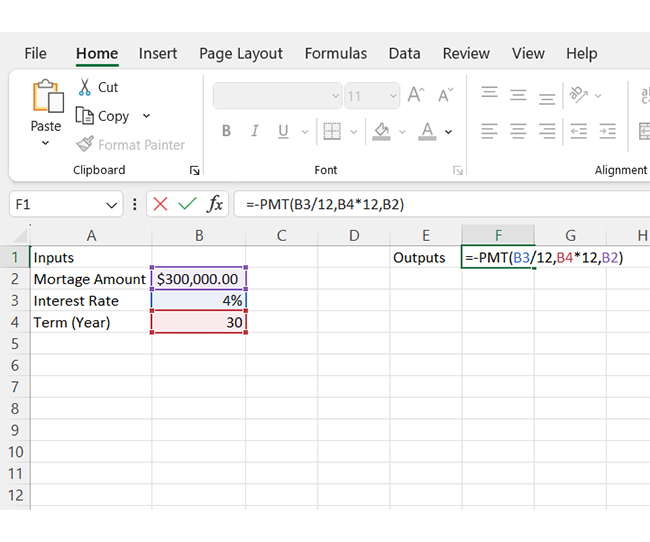
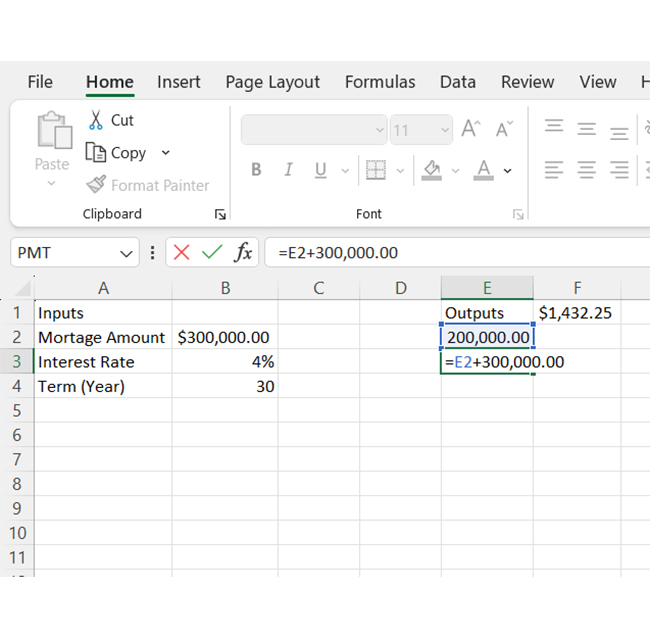
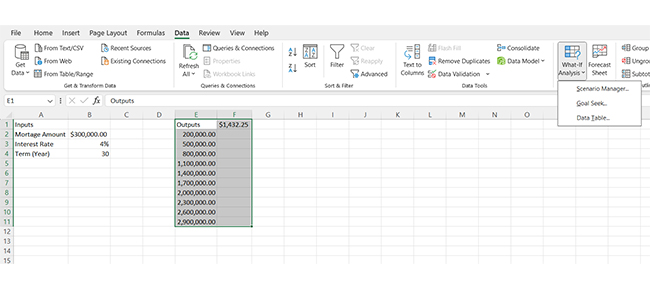
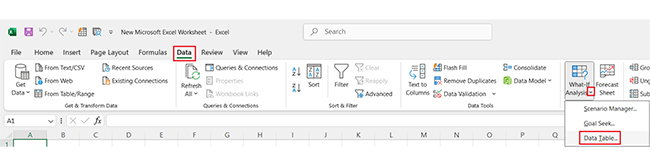
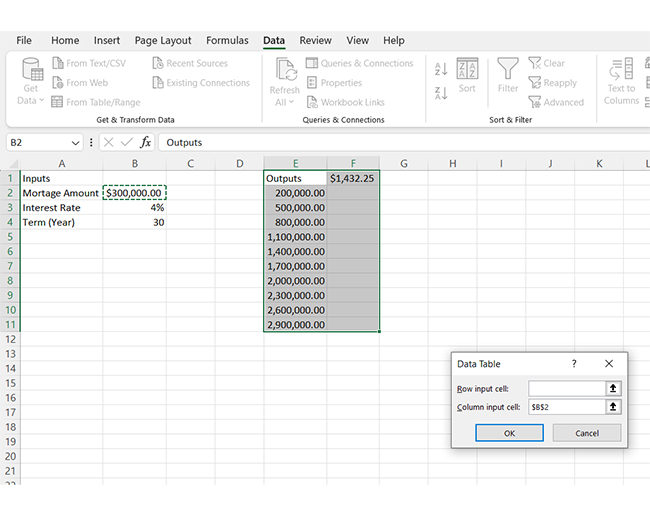
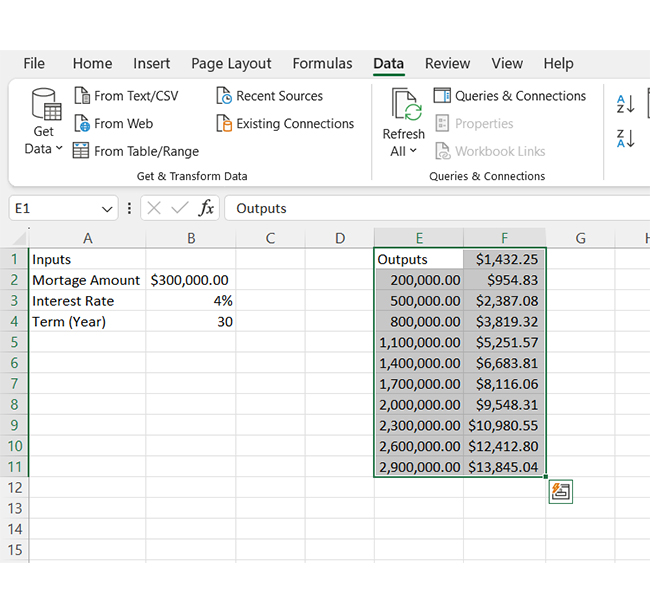
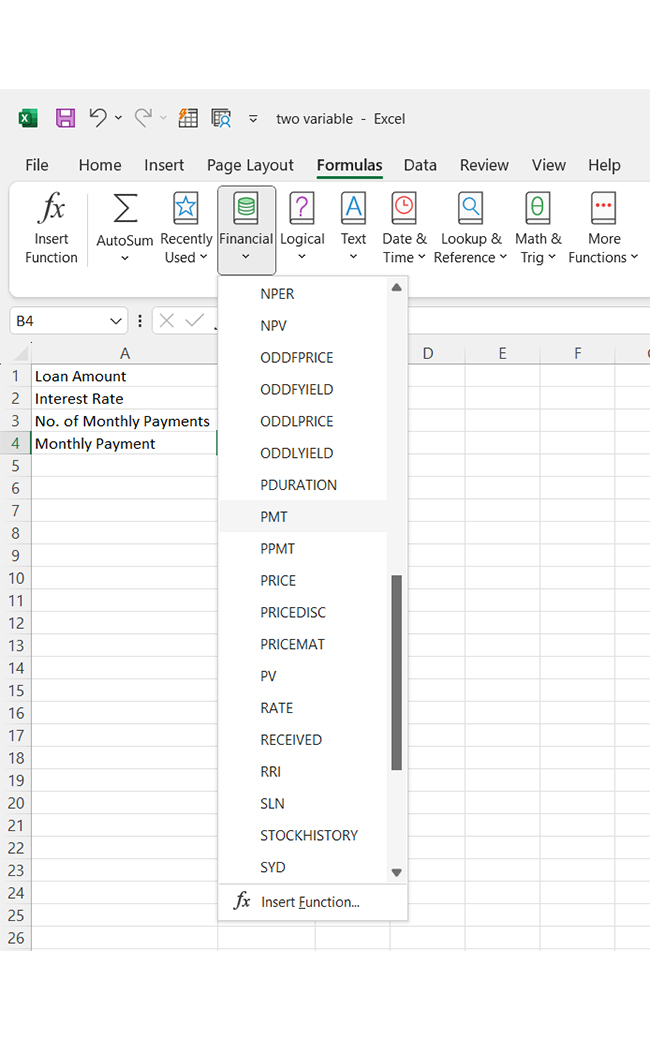
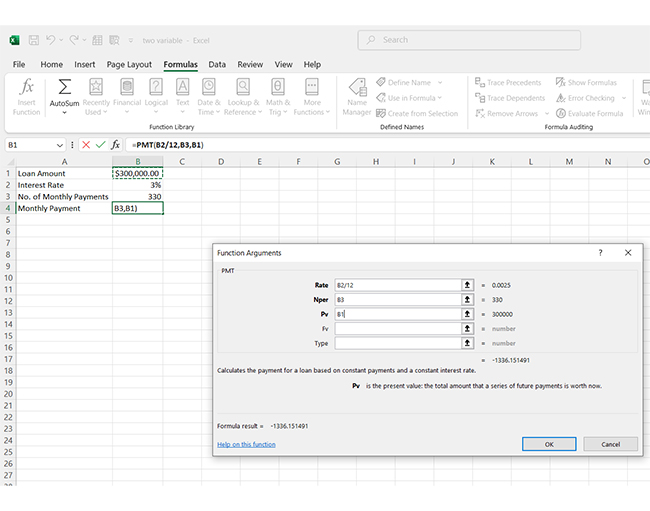
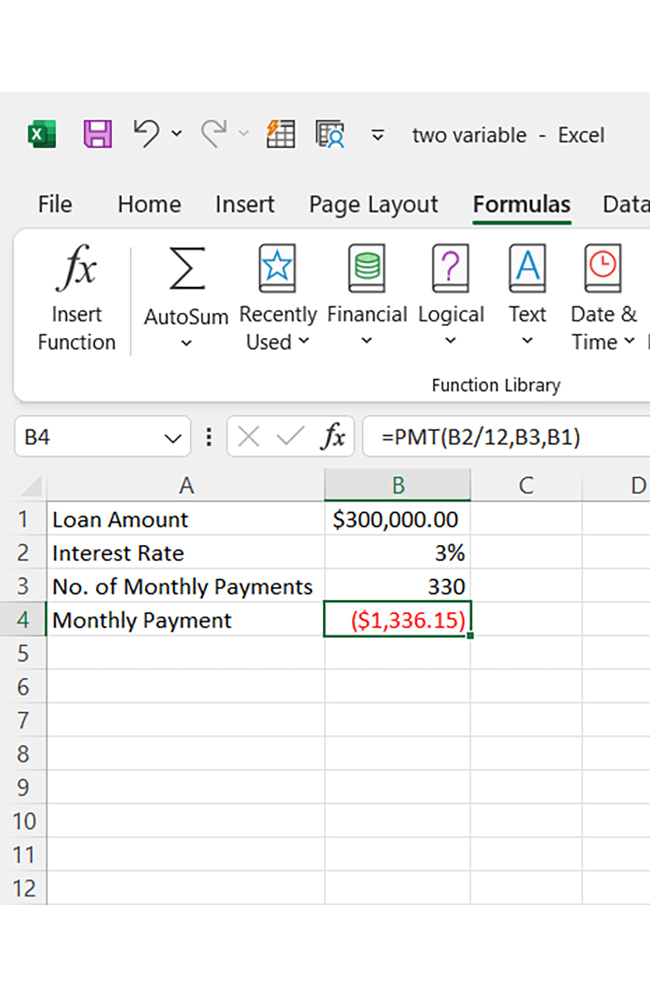
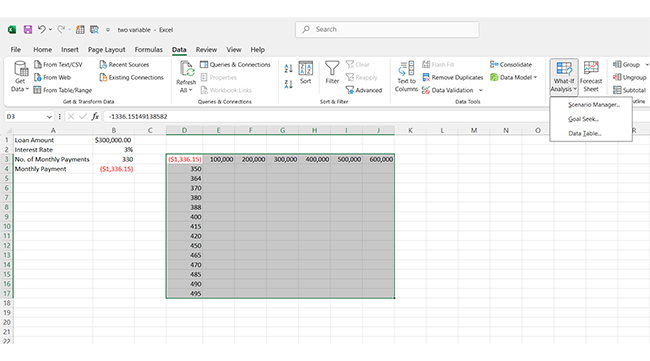
Do you need to analyze how a single change impacts your results in Excel? A one-variable data table is your answer. It’s quick, effective, and perfect for “what-if” scenarios. Follow these steps to create one effortlessly.

  1. Add your data: Enter your data neatly into the Excel sheet. Apply the formula and ensure you use the necessary formula for your calculation.
Apply Formula for Learning How to Use a Data Table in Excel
  1. Check the result: Excel will display the calculated value, like your “Mortgage Amount”.
Mortgage Amount for Learning How to Use a Data Table in Excel
  1. Drag the cell: Drag the formula down or across to extend it.
Drag Formula Down for Learning How to Use a Data Table in Excel
  1. Select the data: Highlight the entire range of your data. Go to the “Data” Tab; Click on “Data” and choose “What-If Analysis” > “Data Table”.
Click Data and Choose What-If Analysis for Learning How to Use a Data Table in Excel
  1. Add input value: In the “Column Input Cell”, enter the reference for your variable.
Enter Reference for Variable for Learning How to Use a Data Table in Excel
  1. See the results: Excel instantly generates the one-variable data table.
See Results for Learning How to Use a Data Table in Excel

How to Make a Two-Variable Data Table in Excel?

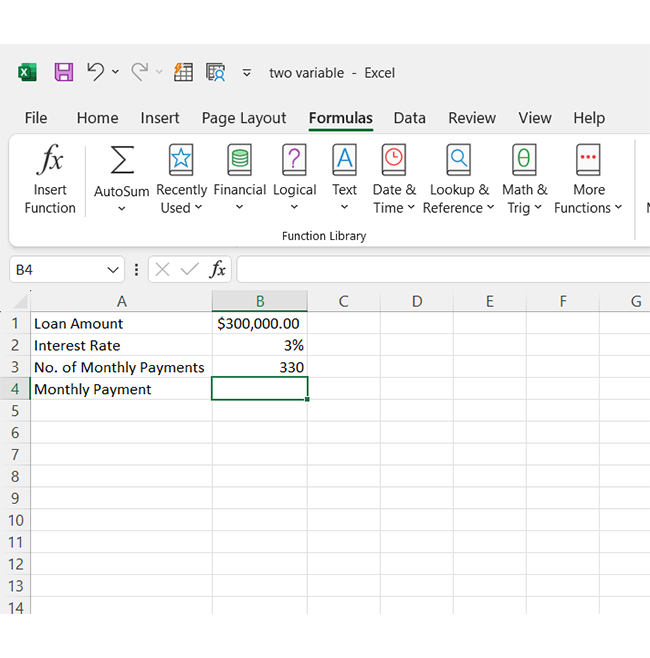
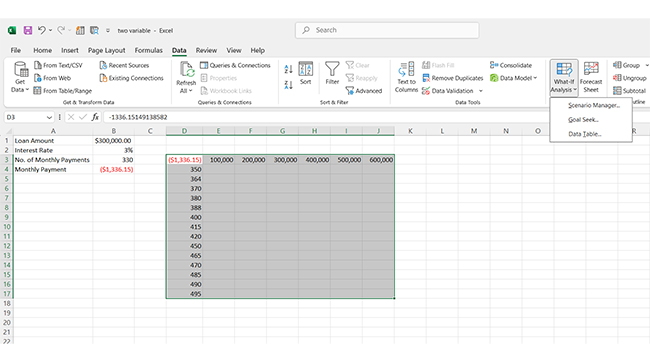
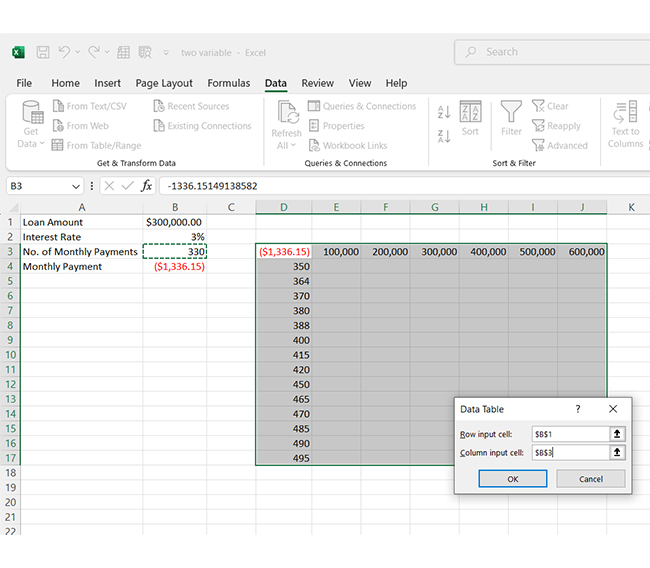
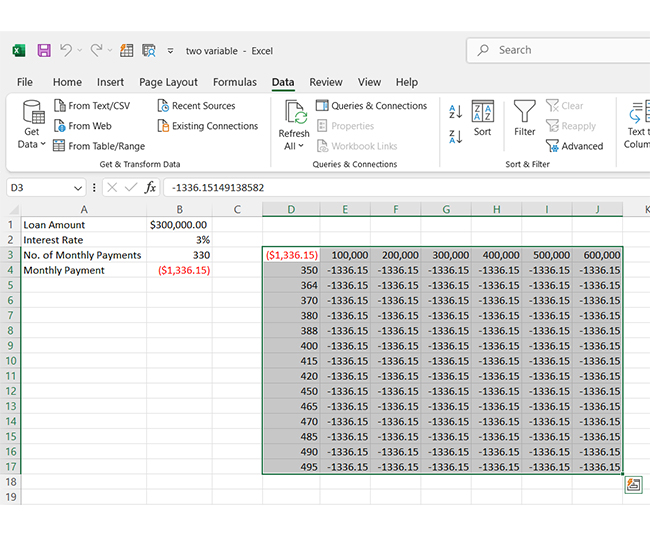
Have you ever wondered how different inputs affect your results? A two-variable data table in Excel can show you instantly! Let’s walk through the steps to create one:

  1. Set up your data: Enter your data and use a formula like PMT to calculate a value (e.g., “Monthly Payment”). Place the formula where the results will appear.
Enter Data for Learning How to Use a Data Table in Excel
Use a Formula Like PMT for Learning How to Use a Data Table in Excel
  1. You can now choose your cell value and proceed by clicking “OK” as shown below:
Choose Cell Value for Learning How to Use a Data Table in Excel
  1. The results will appear as follows:
Result will Appear for Learning How to Use a Data Table in Excel
  1. Add X and Y variables: List one set of input values (e.g., interest rates) along the top row (X-axis). Add the second set (e.g., loan amounts) in the first column (Y-axis).
Add X and Y Variables for Learning How to Use a Data Table in Excel
  1. Select the data range: Highlight the table, including the formula and input variables. Go to Data > What-If Analysis > Data Table.
Select Data Range for Learning How to Use a Data Table in Excel
  1. Input row and column values: In the pop-up, link the Row Input Cell to the X-axis variable and the Column Input Cell to the Y-axis variable. Click OK to generate results.
Input Row and Column Values for Learning How to Use a Data Table in Excel
  1. View the two-variable table: Excel fills the table with calculated values, showing how each combination of inputs affects the result.
View Two Variable Table for Learning How to Use a Data Table in Excel

How to Use Data Tables in Excel?

Excel might seem like a maze at first. But once you master organizing data and using data tables, you’ll realize it’s a game-changer. Here’s how:

  1. Set up your formula: Start by building the formula you want to analyze. For example, if you’re calculating loan payments, use a formula like =PMT(rate, nper, pv) in one cell.2.
  2. Prepare your input values: List the values you want to test. These could be interest rates, payments, or other variables. Organize them in a row or column.
  3. Select your range: Highlight the cells. Include the input values and empty space for results.
  4. Access the data table tool: Go to the “Data” tab. Select “What-If Analysis” and then “Data Table”.
  5. Input your references: Tell Excel which variable to test:
    • Use “Column Input Cell” if values are in a column.
    • Use “Row Input Cell” if values are in a row.
  1. View the results: Click OK. Excel will instantly fill in the results.
  2. Format your table: Make it easy to read:
    • Bold the headers.
    • Add borders.
    • Use colors for highlights.

How to Edit Data Table Results in Excel?

Editing Data Tables in Excel requires understanding their dynamic nature. Here’s how to do it:

  • Understand data tables: Tables auto-calculate based on formulas, so their values cannot be edited directly.
  • Break the link: Copy the table and use “Paste Values” to convert formulas into editable static data.
  • Modify source data: Change the input values or formula, and Excel will update the table automatically.
  • Recalculate the table: Press F9 or use Formulas > Calculate Now to refresh the calculations.
  • Adjust the layout: You can format the table’s appearance without affecting its functionality.
  • Delete or recreate: Remove and rebuild the table to reflect new data or inputs.

How to Delete a Data Table in Excel?

Sometimes, Excel tables can feel like that guest who overstays their welcome. You set them up, and they serve their purpose, but now it’s time to clear the space and move on. So, how do you gracefully say goodbye to a data table in Excel without disrupting the rest of your work? Here’s a step-by-step guide:

  • Select the data table: Click and drag to highlight the entire Data Table, including the input variables (the row and column headers). Make sure you select the whole range to avoid leaving anything behind.
  • Delete the content: Press Delete on your keyboard to remove the data inside the table. This action clears all the calculated values while keeping the table’s formatting and structure.
  • Clear formatting (Optional): If your Data Table has special formatting (like borders, colors, or shading), you can clear it. Go to Home > Clear > Clear Formats to reset the cells’ default appearance.
  • Remove formula links: Data Tables are linked to specific formulas and input cells. To break these links, overwrite the cells where the table was with blank spaces or static data. It ensures no accidental calculations occur.
  • Delete input variables: The input variables (row and column headers) may remain. If you don’t need them for other calculations, select and delete them to fully clean up the area.
  • Reset the worksheet area: If you want to tidy up further, you can delete the space where the table was. Highlight the range, right-click, and select “Delete”. Choose Shift Cells Up or Shift Cells Left to remove gaps and keep your worksheet organized.

How to Analyze Excel Data Tables?

Excel Data Tables are great, but let’s be honest—they’re not the life of the party. Sure, they help organize and analyze data, but when it comes to data visualization, Excel can feel a bit… underwhelming.

What’s the fuss with data visualizations? Numbers alone don’t always tell the full story; plain tables can make insights easy to miss. Data visualizations make data analysis a breeze.

Since Excel is not the life of the party…Where do we run to?

That’s where ChartExpo steps in. This powerful tool transforms your Excel data into stunning, easy-to-understand visuals, making analysis effortless. move columns in Excel with ease, then take it further with intuitive charts. Ready to level up your data game? Install ChartExpo.
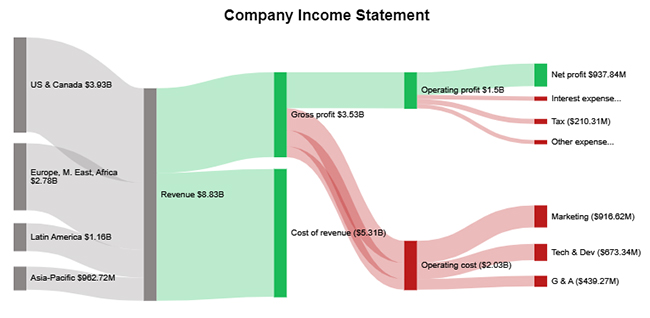
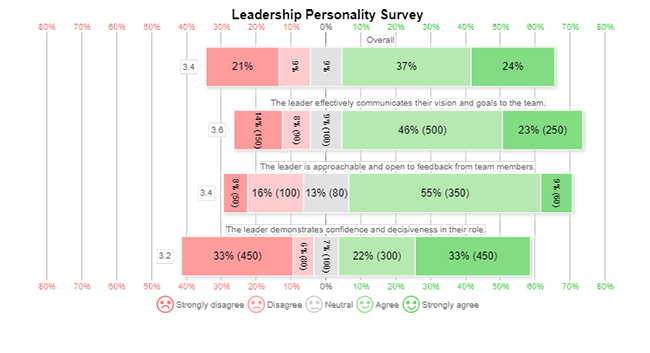
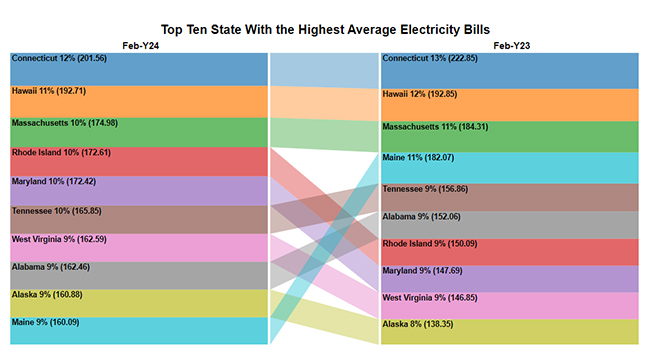
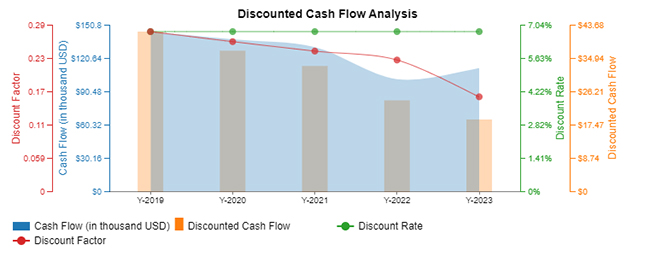
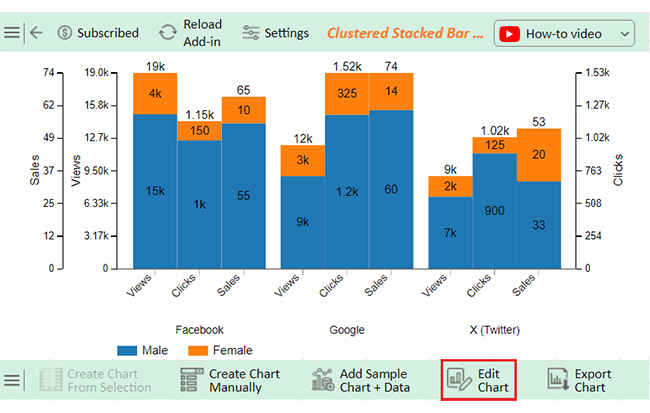
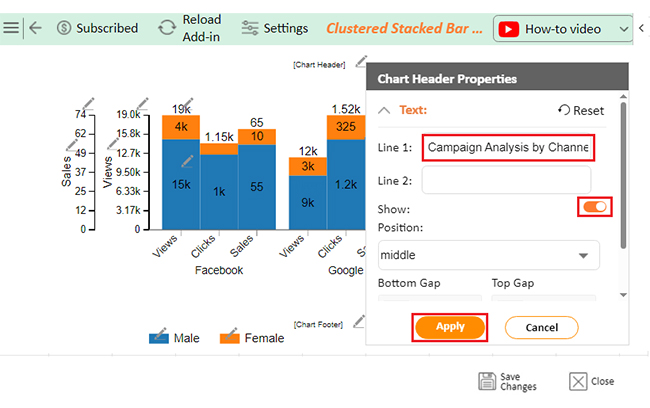
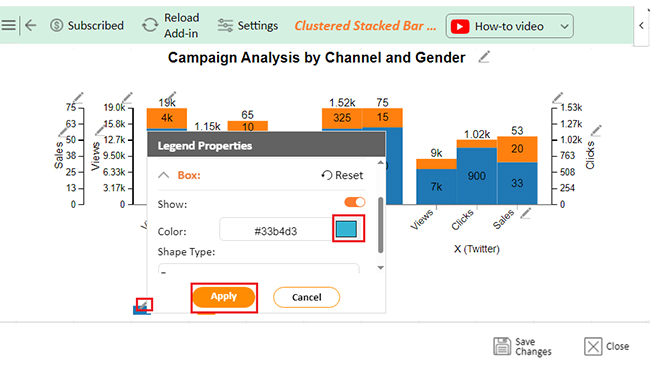
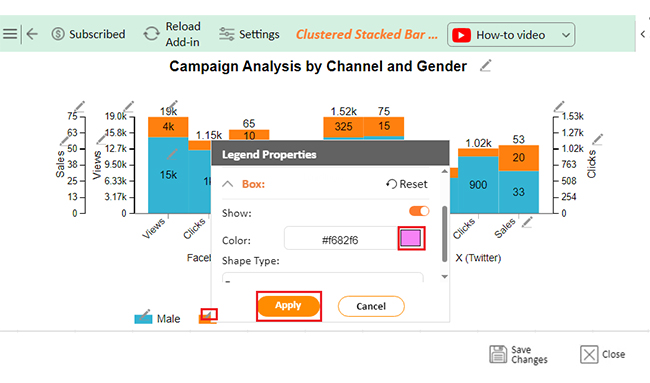
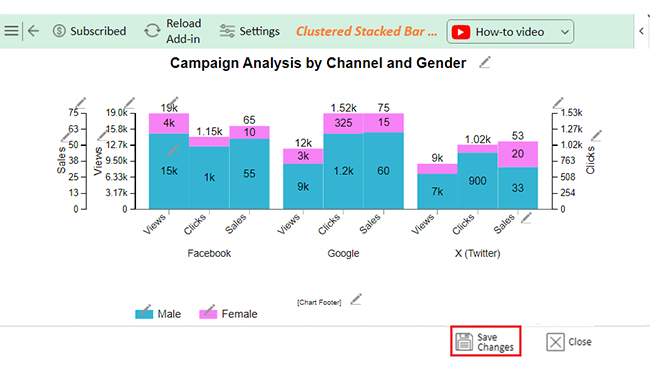
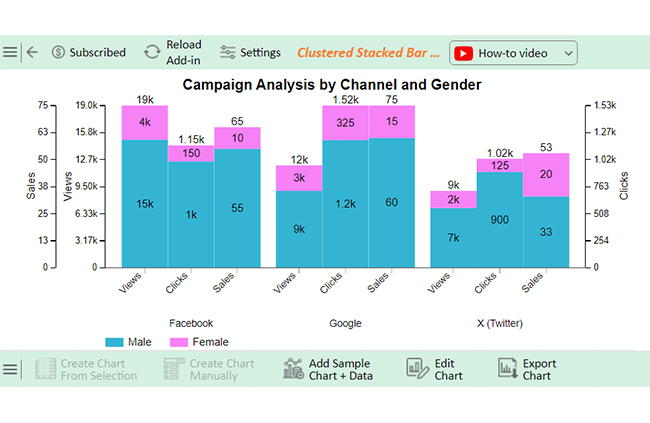
The charts below charts are created in Excel using ChartExpo:

Sankey Chart

Sankey Diagram After Doing How to Use a Data Table in Excel

Likert Scale Chart

Likert Scale Chart After Doing How to Use a Data Table in Excel

Comparison Bar Chart

Comparison Bar Chart After Doing How to Use a Data Table in Excel

Multi Axis Line Chart

Multi Axis Line Chart After Doing How to Use a Data Table in Excel

Clustered Stacked Bar Chart:

Clustered Stacked Bar Chart After Doing How to Use a Data Table in Excel

Let’s learn how to install ChartExpo in Excel.
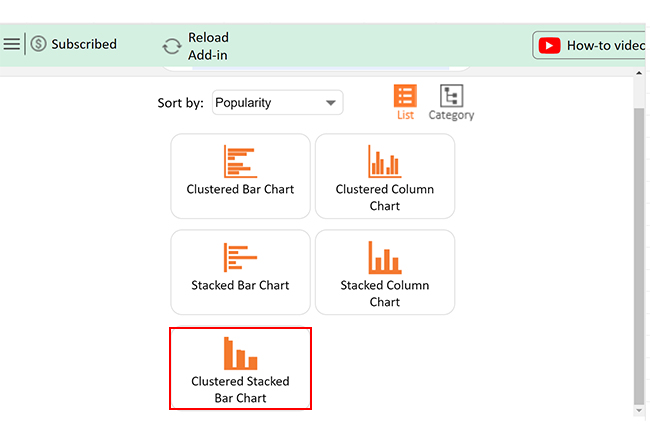
  1. Open your Excel application.
  2. Open the worksheet and click the “Insert” menu.
  3. You’ll see the “My Apps” option.
  4. In the Office Add-ins window, click “Store” and search for ChartExpo on my Apps Store.
  5. Click the “Add” button to install ChartExpo in your Excel.

ChartExpo charts are available both in Google Sheets and Microsoft Excel. Please use the following CTAs to install the tool of your choice and create beautiful visualizations with a few clicks in your favorite tool.

Example

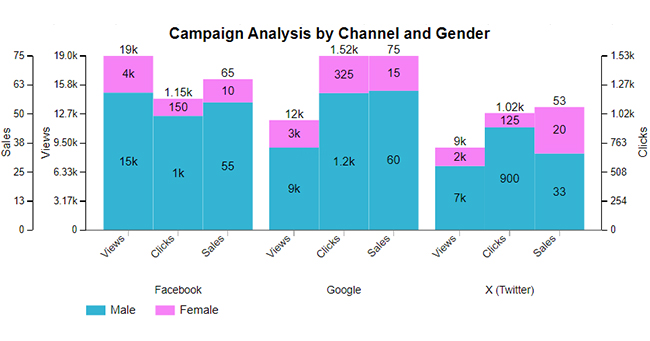
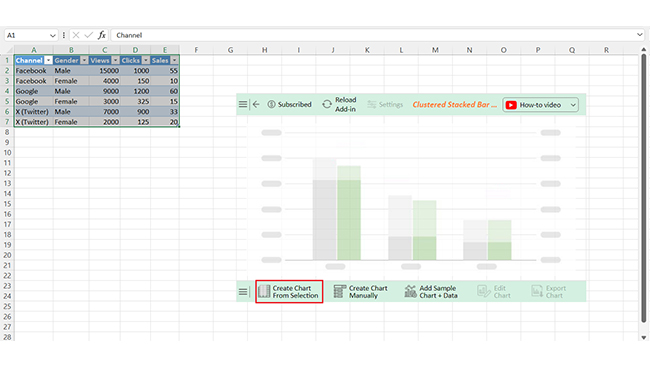
Let’s analyze and interpret this sample data in Excel using ChartExpo, making analyzing and interpreting data easier and more efficient.

Channel Gender Views Clicks Sales
Facebook Male 15000 1000 55
Facebook Female 4000 150 10
Google Male 9000 1200 60
Google Female 3000 325 15
X (Twitter) Male 7000 900 33
X (Twitter) Female 2000 125 20
  • To get started with ChartExpo, install ChartExpo in Excel.
  • Now Click on My Apps from the INSERT menu.
insert chartexpo in excel
  • Choose ChartExpo from My Apps, then click Insert.
open chartexpo in excel
  • Once it loads, scroll through the charts list to locate and choose the “Clustered Stacked Bar Chart”. This chart is best suited to this scenario.
search clustered stacked bar chart in excel
  • You will see a Clustered Stacked Bar Chart on the screen.
See Clustered Stacked Bar Chart After Doing How to Use a Data Table in Excel
  • Click the “Create Chart From Selection” button after selecting the data from the sheet, as shown.
Click Create Chart From Selection After Doing How to Use a Data Table in Excel
  • ChartExpo will generate the visualization below for you.
Initial Visual After Doing How to Use a Data Table in Excel
  • If you want to have the chart’s title, click Edit Chart, as shown in the above image.
  • Click the pencil icon next to the Chart Header to change the title.
  • It will open the properties dialog. Under the Text section, you can add a heading in Line 1 and enable Show.
  • Give the appropriate title of your chart and click the Apply button.
Add Chart Header After Doing How to Use a Data Table in Excel
  • You can change the color of the Male section by clicking on the Legend small pencil icon:
Change Color Male Section After Doing How to Use a Data Table in Excel
  • You can change the color of the Female section by clicking on the Legend small pencil icon:
Change Color Female Section After Doing How to Use a Data Table in Excel
  • Click the “Save Changes” button to persist the changes.
Click Save Changes After Doing How to Use a Data Table in Excel
  • Your Clustered Stacked Bar Chart will appear as below.
Final How to Use a Data Table in Excel

Insights

  • Male users outperform female users in views, clicks, and sales across all channels.
  • Google drives the most sales, particularly among male users.
  • Facebook leads in total views but shows lower sales efficiency.

What are the Benefits of Using Data Tables in Excel?

Data Table is one of Excel’s lesser-known but incredibly powerful tools. It simplifies analyzing data and making data-driven decisions—without the headache. Here are seven key benefits of using data tables in Excel:

  • Dynamic and interactive: They automatically update results when input values or formulas change. It ensures your data is always accurate and up to date.
  • Ease of comparison: One-variable and two-variable tables make comparing outcomes simple. You can easily spot patterns and trends across different scenarios.
  • Error reduction: By automating calculations, Data Tables eliminate manual errors. You can trust your results even with complex datasets.
  • Time-saving: You can reuse a Data Table with different inputs once set up. It saves hours of repetitive work and simplifies analysis.
  • Supports decision-making: Data Tables provide clear insights that help you make smarter choices. Their visual layout makes complex data easier to understand.
  • Professional and versatile: They are perfect for financial models, data presentations, and strategy planning. With clean formatting, they add polish to your work.

FAQs

How do I insert a data table into an Excel chart?

Select your chart, go to the Chart Design tab, and click Add Chart Element > Data Table. Choose the display option you prefer, and the table will appear below your chart.

Why can’t I change part of a data table in Excel?

Excel Data Tables are linked to formulas and input cells, so values update automatically. You can’t edit individual cells directly because the table calculates results based on their structure and underlying references.

Wrap Up

Using a data table in Excel is essential for effective data analysis. It helps simplify complex calculations and enhances decision-making. Data tables provide a clear and structured way to compare scenarios, whether for business or personal use.

One-variable and two-variable data tables offer flexibility. They allow you to test outcomes based on changing inputs, saving time and effort. This feature is ideal for forecasting, budgeting, and scenario planning.

Data tables also improve accuracy. By automating calculations, they reduce the risk of errors. This ensures your analysis is reliable and actionable.

Setting up a data table is straightforward. With Excel’s built-in tools, you can create one in minutes. The process is simple, even for beginners. By mastering this feature, you gain better control over your data. It enhances productivity and makes problem-solving faster and easier.

Conclusively, learning to use a data table in Excel is invaluable. It helps organize your data, analyze variables, and make informed decisions.

Do not hesitate.

Install ChartExpo and practice these steps to unlock Excel’s full potential for smarter, more efficient data handling.

How much did you enjoy this article?

ExcelAd2
Start Free Trial!
146478

Related articles

next previous
Microsoft Excel12 min read

Key Performance Indicators in Healthcare for Better Insights

Key Performance Indicators in healthcare track patient care and efficiency. Learn about these KPIs, top examples, and how to use them to improve outcomes.

Microsoft Excel10 min read

BMI Calculation Formula in Excel for Better Fitness Insights

The BMI calculation formula in Excel helps track and analyze body mass index. Explore step-by-step instructions and tips to simplify BMI tracking in Excel.

Microsoft Excel29 min read

How to Create a Tornado Chart in Excel? A Complete Guide

Click to learn how to plot a Tornado Chart in Excel using easy-to-follow steps. Also, we’ll address the following question: what is a Tornado Diagram?

Microsoft Excel14 min read

How to Create a Scatter Plot in Excel with 3 Variables?

Click to discover how to create a Scatter Plot in Excel with 3 variables. We’ll also address the following question: why do we use Scatter Plot Graph?

Microsoft Excel12 min read

Construction Budget Spreadsheet for Better Planning

A construction budget spreadsheet helps track expenses and control costs. This blog explores benefits, top templates, and tips for better budgeting in Excel.

ChartExpo logo

Turn Data into Visual
Stories

CHARTEXPO

  • Home
  • Gallery
  • Videos
  • Services
  • Pricing
  • Contact us
  • FAQs
  • Privacy policy
  • Terms of Service
  • Sitemap

TOOLS

  • ChartExpo for Google Sheets
  • ChartExpo for Microsoft Excel
  • Power BI Custom Visuals by ChartExpo
  • Word Cloud

CATEGORIES

  • Bar Charts
  • Circle Graphs
  • Column Charts
  • Combo Charts
  • Comparison Charts
  • Line Graphs
  • PPC Charts
  • Sentiment Analysis Charts
  • Survey Charts

TOP CHARTS

  • Sankey Diagram
  • Likert Scale Chart
  • Comparison Bar Chart
  • Pareto Chart
  • Funnel Chart
  • Gauge Chart
  • Radar Chart
  • Radial Bar Chart
  • Sunburst Chart
  • see more
  • Scatter Plot Chart
  • CSAT Survey Bar Chart
  • CSAT Survey Chart
  • Dot Plot Chart
  • Double Bar Graph
  • Matrix Chart
  • Multi Axis Line Chart
  • Overlapping Bar Chart
  • Control Chart
  • Slope Chart
  • Clustered Bar Chart
  • Clustered Column Chart
  • Box and Whisker Plot
  • Tornado Chart
  • Waterfall Chart
  • Word Cloud
  • see less

RESOURCES

  • Blog
  • Resources
  • YouTube
SIGN UP FOR UPDATES

We wouldn't dream of spamming you or selling your info.

© 2025 ChartExpo, all rights reserved.