• Home
  • Tools dropdown img
    • Spreadsheet Charts

      • ChartExpo for Google Sheets
      • ChartExpo for Microsoft Excel
    • Power BI Charts

      • Power BI Custom Visuals by ChartExpo
    • Word Cloud

  • Charts dropdown img
    • Chart Category

      • Bar Charts
      • Circle Graphs
      • Column Charts
      • Combo Charts
      • Comparison Charts
      • Line Graphs
      • PPC Charts
      • Sentiment Analysis Charts
      • Survey Charts
    • Chart Type

      • Box and Whisker Plot
      • Clustered Bar Chart
      • Clustered Column Chart
      • Comparison Bar Chart
      • Control Chart
      • CSAT Survey Bar Chart
      • CSAT Survey Chart
      • Dot Plot Chart
      • Double Bar Graph
      • Funnel Chart
      • Gauge Chart
      • Likert Scale Chart
      • Matrix Chart
      • Multi Axis Line Chart
      • Overlapping Bar Chart
      • Pareto Chart
      • Radar Chart
      • Radial Bar Chart
      • Sankey Diagram
      • Scatter Plot Chart
      • Slope Chart
      • Sunburst Chart
      • Tornado Chart
      • Waterfall Chart
      • Word Cloud
    • Google Sheets
      Microsoft Excel
  • Services
  • Pricing
  • Contact us
  • Blog
  • Support dropdown img
      • Gallery
      • Videos
      • Contact us
      • FAQs
      • Resources
    • Please feel free to contact us

      atsupport@chartexpo.com

Categories
All Data Visualizations Data Analytics Surveys
Add-ons/
  • Google Sheets
  • Microsoft Excel
  • Power BI
All Data Visualizations Data Analytics Surveys
Add-ons
  • Google Sheets
  • Microsoft Excel
  • Power BI

We use cookies

This website uses cookies to provide better user experience and user's session management.
By continuing visiting this website you consent the use of these cookies.

Ok

ChartExpo Survey


Home > Blog > Microsoft Excel

How to Calculate Payback Period in Excel? Like a Pro

Do you wish to know how to calculate the payback period in Excel for your investment activities? You’re not alone. In today’s data-driven world, one must understand the financial feasibility of every investment. How to calculate payback period in Excel is an essential skill for anyone engaging in financial analysis.

How to Calculate Payback Period in Excel

The payback period is the time expected to earn the initial investment back. There are various reasons why the payback period is significant. However, the most important is that it offers a measure of risk and benefit.

How to calculate the payback period in Excel? Many finance professionals often ask themselves this question. Excel was developed to help businesspeople complete everyday business and financial operations. Its features make it widely used to create business strategies and to assess investments for viability.

We will dive into each step on how to calculate the payback period in Excel in this blog post. We will equip you with the knowledge to become confident in making financial decisions. This technique will augment your practical knowledge of financial management skills.

Let us, therefore, begin our journey together and learn how to calculate the payback period in Excel.

Table of Contents:

  1. What is the Payback Period?
  2. Why Calculation of the Payback Period Is Important?
  3. How We Can Calculate the Payback Period?
  4. What is a Good Payback Period?
  5. How to Analyze the Payback Period in Excel?
  6. What are the Advantages and Disadvantages of a Payback Period?
  7. Wrap Up

First…

What is the Payback Period?

Definition: The payback period is the time it takes for your earnings to equal the initial investment. It is like a financial stopwatch. It tells you how long it takes to recoup the initial investment.

Picture this: You invest in a project or buy equipment. Let’s say you invest $10,000 in a business. If you’re making $2,000 a year from that investment, it would take 5 years to get your $10,000 back. That’s your payback period – 5 years.

The payback period is a simple way to gauge how fast your investment will start making money. Shorter payback periods mean quicker returns. It’s a popular tool because it’s easy to calculate and understand.

But remember, it doesn’t consider long-term profits or the time value of money. You must also consider other factors, such as ongoing costs and potential profits.

Why Calculation of the Payback Period Is Important?

Calculation of the payback period helps you see how long it will take to recover your initial investment. This is pretty handy when you’re making data-driven decisions. Let’s dive into why it’s so important:

  • Quick Evaluation

The payback period represents the time it will take to earn back the money you originally spent. That is to say, it allows you to understand how soon the project’s returns would turn profitable. This aids in the effective prioritization of projects based on the payback period.

  • Risk Assessment

Shorter payback periods often indicate lower risk. When investments recoup the initial investment in a relatively shorter period, it mitigates the capital return period.

Further, it is a sign of minimal exposure to the potential risks of market fluctuations, unexpected expenses, etc. By understanding the risks associated with different payback periods, it becomes easy to:

    • Make informed decisions.
    • Manage resources.
    • Build a solid investment portfolio based on your risk tolerance level.
  • Capital Allocation

The payback period plays a crucial role in guiding capital allocation decisions. You can compare the payback periods of various investment options. This will help you determine which projects offer the quickest returns on investment capital. This information facilitates strategic capital allocation, prioritizing projects with shorter payback periods.

  • Liquidity Planning

The payback period is essential for managing cash flow and liquidity. It indicates how quickly you will recover the capital you invested. Thus, you can make plans on how to pay your debts and manage future expenses. Or plan further investments more accurately. This foresight ensures better financial stability and liquidity management, reducing the risk of cash flow shortages or liquidity constraints.

  • Decision Making

The payback period may influence your decision-making process. It provides a clear understanding of the potential and feasibility of investment opportunities.

It might not be the only deciding factor. However, it helps align your decisions with your financial goals and the level of risk you are willing to accept.

How We Can Calculate the Payback Period?

Indeed, calculating the payback period can show you when you will get your investment back. Here is a simple guide to calculate the payback period:

  1. Identify initial investment: First, you need to know how much cash you are contributing. This is the money you will pay out at the start of a project or business.
  2. Estimate cash flows: Forecast your cash flow – cash you get back from your investment periodically. The period might be weekly, monthly, or annual, whichever suits your project.
  3. Calculate cumulative cash flows: The next step is to add the total cash you received per period. Then, find out how much you received in total over time.
  4. Determine payback period: Once you’ve tallied up your earnings, you’ll find the payback period the time it takes to recoup your initial investment. It’s similar to the finish line mark on a race track. The moment you cross it, you’ve got your money back!

Here is the formula for calculating the payback period:

Formula for Learning How to Calculate Payback Period in Excel

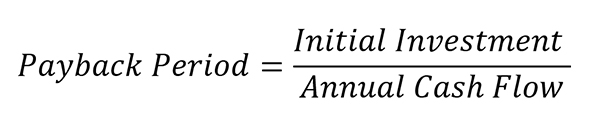
This payback period equation will tell you when to expect your investment/project to return your initial investment.

What is a Good Payback Period?

Determining what is a good payback period is not a one-size-fits-all affair. Let’s explore some key factors to consider:

  • Risk mitigation: A good payback period helps mitigate risks by ensuring the initial investment returns quickly. The short payback periods mean minimal exposure to potential market changes or unexpected setbacks.
  • Liquidity: Most often, shorter payback periods are associated with enhanced liquidity. More cash becomes available for reinvestment or other needs once money is returned quickly.
  • Opportunity cost: Consider what you have to give up to get paid back on investment sooner. While shorter payback periods offer faster returns, they may also mean sacrificing potentially higher returns from longer-term investments. It’s similar to weighing the pros and cons of taking a shorter route versus a scenic detour.
  • Adaptability: A good payback period allows for adaptability in changing market conditions. If circumstances shift, having a shorter payback period is ideal. It means you can quickly reassess and reallocate resources to more promising opportunities. You have the flexibility to change course if a better option arises.

How to Analyze the Payback Period in Excel?

Ah, data analysis, the thrilling adventure of turning numbers into insights. However, squinting over rows and columns in Excel can make anyone feel lost. This is where data visualization swoops in to make complex data digestible at a glance.

Sure, Excel crunches numbers like a pro. But when visualizing data, it’s like asking a penguin to fly. This is where ChartExpo comes into play.

ChartExpo offers dynamic and interactive visualization options, including Mekko charts or Waterfall charts, to complement your data analysis endeavors. So, bid farewell to static charts and embrace the dynamic world of data visualization with ChartExpo!

Let’s learn how to install ChartExpo in Excel.

  1. Open your Excel application.
  2. Open the worksheet and click the “Insert” menu.
  3. You’ll see the “My Apps” option.
  4. In the Office Add-ins window, click “Store” and search for ChartExpo on my Apps Store.
  5. Click the “Add” button to install ChartExpo in your Excel.

ChartExpo charts are available both in Google Sheets and Microsoft Excel. Please use the following CTAs to install the tool of your choice and create beautiful visualizations with a few clicks in your favorite tool.

Example

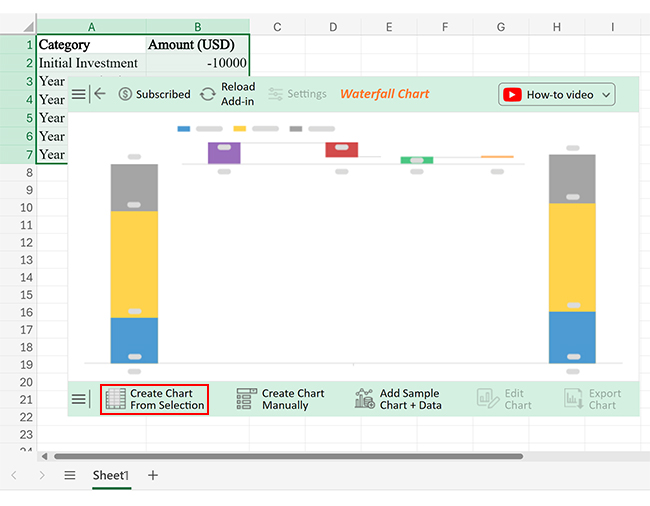
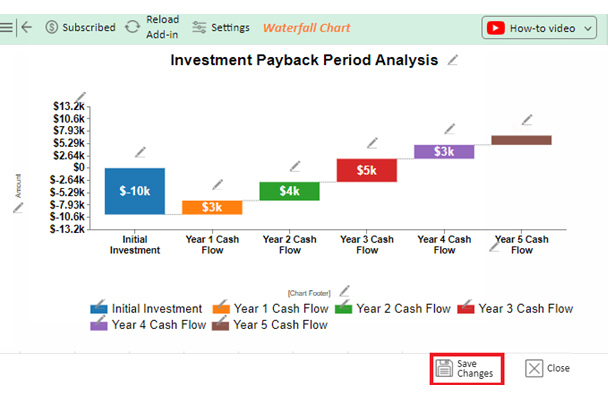
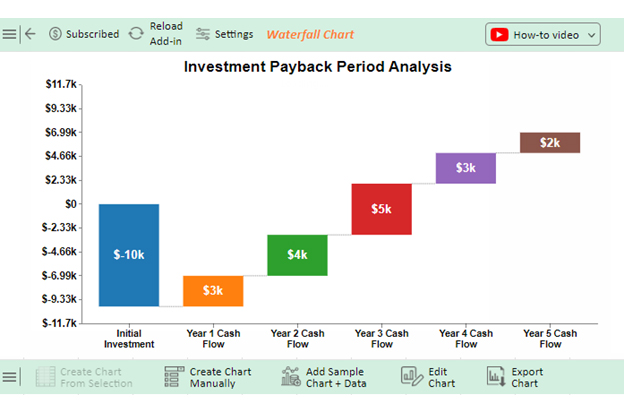
Let’s say you want to analyze the investment data below in Excel.

Category Amount (USD)
Initial Investment -10000
Year 1 Cash Flow 3000
Year 2 Cash Flow 4000
Year 3 Cash Flow 5000
Year 4 Cash Flow 3000
Year 5 Cash Flow 2000

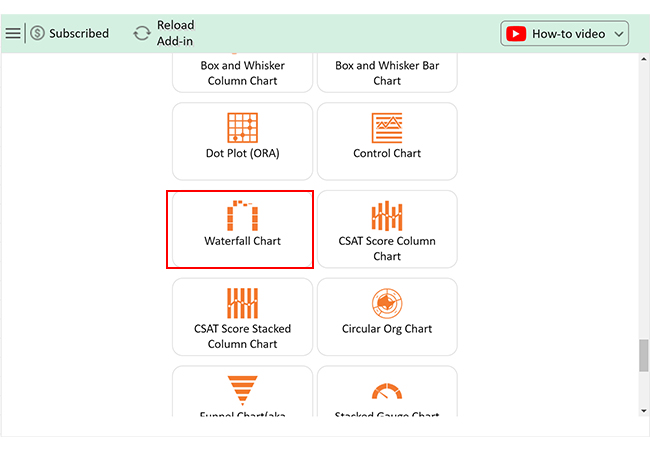
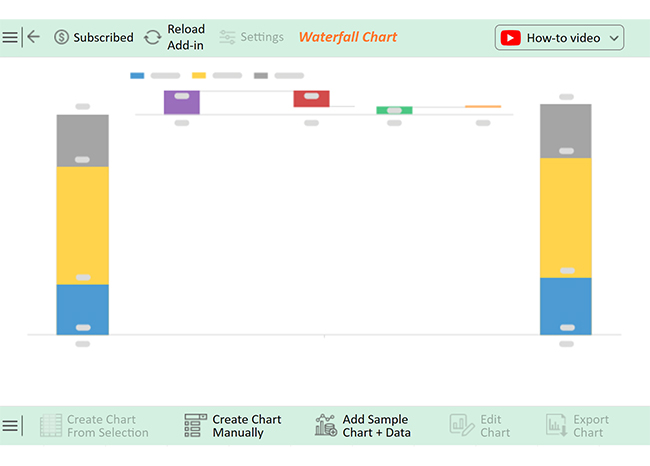
Follow these steps to create a visualization in Excel using ChartExpo and glean valuable insights.

  • To get started with ChartExpo, install ChartExpo in Excel.
  • Now Click on My Apps from the INSERT menu.
insert chartexpo in excel
  • Choose ChartExpo from My Apps, then click Insert.
open chartexpo in excel
  • Once it loads, scroll through the charts list to locate and choose the “Waterfall Chart”. This chart is best suited to this scenario.
search waterfall chart in excel
  • You will see a Waterfall Chart on the screen.
Waterfall Chart Screen After Learning How to Calculate Payback Period in Excel
  • Click the “Create Chart From Selection” button after selecting the data from the sheet, as shown.
Click Create Chart From Selection After Learning How to Calculate Payback Period in Excel
  • ChartExpo will generate the visualization below for you.
Initial Visualization After Learning How to Calculate Payback Period in Excel
  • If you want to have the chart’s title, click Edit Chart, as shown in the above image.
  • Click the pencil icon next to the Chart Header to change the title.
  • It will open the properties dialog. Under the Text section, you can add a heading in Line 1 and enable Show.
  • Give the appropriate title of your chart and click the Apply button.
Edit Chart After Learning How to Calculate Payback Period in Excel
  • You can disable the “Set as Total” of “Year 5 Cash Flow” as follows:
Disable the Set as Total After Learning How to Calculate Payback Period in Excel
  • Click the Save Changes button to persist the changes.
Save Changes After Learning How to Calculate Payback Period in Excel
  • Your Waterfall Chart will appear as below.
Final How to Calculate Payback Period in Excel

Insights

  • The starting capital was -$10,000.
  • In the next five years, there was a gradual increase in cash flows: $3,000 in Year 1, $4,000 in Year 2, $5,000 in Year 3, $3,000 in Year 4, and $2,000 in Year 5.
  • The total cash received exceeds the invested amount, indicating a favorable payback period.
  • The chart indicates that the project reached its target in the third year.

What are the Advantages and Disadvantages of a Payback Period?

Let’s take a closer look at the advantages and disadvantages of using the payback period as a tool for investment evaluation.

Advantages

  • Simple to understand: One of the biggest advantages of the payback period is its simplicity. It makes it easy for investors and stakeholders to grasp without needing complex financial knowledge.
  • Liquidity assessment: The time taken for the initial investment to be recouped helps evaluate liquidity. This enables you to prepare for future cash requirements and ascertain financial flexibility.
  • Risk evaluation: You can use the payback period to evaluate the risk associated with an investment. Shorter periods imply less risky ventures, ensuring safety and peace of mind.
  • Decision-making: The payback period aids decision-making by offering a clear timeframe for recouping the initial investment. This assists in comparing different projects and making informed choices about resource allocation.

Disadvantages

  • Time value of money ignored: One disadvantage of using the payback period is that it ignores the time value of money. It treats all cash flows as equal. Why is this a disadvantage? Money received today is worth more than an identical sum received in the future because of inflation and opportunity cost.
  • Limited time horizon: A shortcoming of the payback period is its limited time range. It only considers when the original capital investment will be recouped. This fails to consider the long-term advantages or disadvantages associated with an investment. Thus, it fails to give a complete picture of its profitability.
  • Risk and uncertainty overlooked: Although the payback period assists in assessing risks, it may not recognize some risks and uncertainties. For example, market volatility or changes in industry regulations can lead to potentially misguided investment decisions.
  • Subjectivity in cutoff criteria: What may constitute an acceptable payback period varies from one investor or organization to another. This subjectivity may lead to inconsistencies in investment evaluation and decision-making. Potentially, this results in missed opportunities or poor investment choices.

FAQs

What’s a good payback period?

What constitutes a “good payback period” varies with industry standards, risk tolerance, and investment objectives. Generally speaking, a lower payback period is good as it shows quicker returns on investments.

Do you want a high or low payback period?

A low payback period is generally preferred because it means you recoup your investment faster. This indicates quicker profitability and less exposure to risk. Conversely, high payback periods show that it will take a long to recover your initial investment.

What is a major disadvantage of the payback period?

The payback time ignores some important aspects of the time value of money. It treats all cash flows equally. However, money received sooner is worth more than money received later due to inflation and opportunity cost.

Wrap Up

Calculating the payback period in Excel can streamline financial analysis and decision-making processes. First, organize your data by listing initial investments and estimated cash flows per time frame. Next, create a column for cumulative cash flows.

Utilize Excel formulas to calculate cumulative cash flows: add the initial investment to the cash flow of each period. Do this until you reach a period where cumulative cash flow exceeds this value.

The payback period occurs when cumulative cash flows cross over the initial investment. This is when the full payback of all investments takes place.

Excel’s computational capabilities expedite this process, providing accurate and efficient results. Moreover, Excel allows for easy adjustments and scenario analysis. This enables you to explore different investment scenarios and their respective payback periods.

Excel can help with making informed decisions on investing. This includes assessing projects’ viability and profitability against strategic goals and tolerance for uncertainty or risks.

There are, however, several factors we must bear in mind surrounding the payback period. Even though it provides simplicity and quick insights, it disregards the time value of money. It does not consider such factors as inflation and opportunity costs.

In conclusion, utilizing Excel to calculate the payback period enhances financial analysis and decision-making processes. Embrace it with ChartExpo to evaluate investment opportunities, assess risks, and allocate resources judiciously.

How much did you enjoy this article?

ExcelAd2
Start Free Trial!
135056

Related articles

next previous
Microsoft Excel8 min read

Excel Task Tracker Template for Smarter Task Insights

Task tracker template in Excel organizes tasks, tracks deadlines, and boosts efficiency. Learn its benefits, and explore expert tips to simplify task management.

Microsoft Excel10 min read

Invoice Tracker Template in Excel for Better Insights

An invoice tracker Excel template helps track invoices, due dates, and payments. Learn how to use this template for better financial management.

Microsoft Excel12 min read

Key Performance Indicators in Healthcare for Better Insights

Key Performance Indicators in healthcare track patient care and efficiency. Learn about these KPIs, top examples, and how to use them to improve outcomes.

Microsoft Excel10 min read

BMI Calculation Formula in Excel for Better Fitness Insights

The BMI calculation formula in Excel helps track and analyze body mass index. Explore step-by-step instructions and tips to simplify BMI tracking in Excel.

Microsoft Excel29 min read

How to Create a Tornado Chart in Excel? A Complete Guide

Click to learn how to plot a Tornado Chart in Excel using easy-to-follow steps. Also, we’ll address the following question: what is a Tornado Diagram?

ChartExpo logo

Turn Data into Visual
Stories

CHARTEXPO

  • Home
  • Gallery
  • Videos
  • Services
  • Pricing
  • Contact us
  • FAQs
  • Privacy policy
  • Terms of Service
  • Sitemap

TOOLS

  • ChartExpo for Google Sheets
  • ChartExpo for Microsoft Excel
  • Power BI Custom Visuals by ChartExpo
  • Word Cloud

CATEGORIES

  • Bar Charts
  • Circle Graphs
  • Column Charts
  • Combo Charts
  • Comparison Charts
  • Line Graphs
  • PPC Charts
  • Sentiment Analysis Charts
  • Survey Charts

TOP CHARTS

  • Sankey Diagram
  • Likert Scale Chart
  • Comparison Bar Chart
  • Pareto Chart
  • Funnel Chart
  • Gauge Chart
  • Radar Chart
  • Radial Bar Chart
  • Sunburst Chart
  • see more
  • Scatter Plot Chart
  • CSAT Survey Bar Chart
  • CSAT Survey Chart
  • Dot Plot Chart
  • Double Bar Graph
  • Matrix Chart
  • Multi Axis Line Chart
  • Overlapping Bar Chart
  • Control Chart
  • Slope Chart
  • Clustered Bar Chart
  • Clustered Column Chart
  • Box and Whisker Plot
  • Tornado Chart
  • Waterfall Chart
  • Word Cloud
  • see less

RESOURCES

  • Blog
  • Resources
  • YouTube
SIGN UP FOR UPDATES

We wouldn't dream of spamming you or selling your info.

© 2025 ChartExpo, all rights reserved.