• Home
  • Tools dropdown img
    • Spreadsheet Charts

      • ChartExpo for Google Sheets
      • ChartExpo for Microsoft Excel
    • Power BI Charts

      • Power BI Custom Visuals by ChartExpo
    • Word Cloud

  • Charts dropdown img
    • Chart Category

      • Bar Charts
      • Circle Graphs
      • Column Charts
      • Combo Charts
      • Comparison Charts
      • Line Graphs
      • PPC Charts
      • Sentiment Analysis Charts
      • Survey Charts
    • Chart Type

      • Box and Whisker Plot
      • Clustered Bar Chart
      • Clustered Column Chart
      • Comparison Bar Chart
      • Control Chart
      • CSAT Survey Bar Chart
      • CSAT Survey Chart
      • Dot Plot Chart
      • Double Bar Graph
      • Funnel Chart
      • Gauge Chart
      • Likert Scale Chart
      • Matrix Chart
      • Multi Axis Line Chart
      • Overlapping Bar Chart
      • Pareto Chart
      • Radar Chart
      • Radial Bar Chart
      • Sankey Diagram
      • Scatter Plot Chart
      • Slope Chart
      • Sunburst Chart
      • Tornado Chart
      • Waterfall Chart
      • Word Cloud
    • Google Sheets
      Microsoft Excel
  • Services
  • Pricing
  • Contact us
  • Blog
  • Support dropdown img
      • Gallery
      • Videos
      • Contact us
      • FAQs
      • Resources
    • Please feel free to contact us

      atsupport@chartexpo.com

Categories
All Data Visualizations Data Analytics Surveys
Add-ons/
  • Google Sheets
  • Microsoft Excel
  • Power BI
All Data Visualizations Data Analytics Surveys
Add-ons
  • Google Sheets
  • Microsoft Excel
  • Power BI

We use cookies

This website uses cookies to provide better user experience and user's session management.
By continuing visiting this website you consent the use of these cookies.

Ok

ChartExpo Survey


Home > Blog > Microsoft Excel

Free Questionnaire Maker For Your Next Survey

Creating and analyzing surveys is an essential skill in today’s data-driven world. Surveys serve various purposes, from market research to academic studies and employee feedback; the applications are numerous. They provide valuable insights that can inform future strategies and actions.

You need a versatile tool – a free questionnaire maker to embark on this journey.

Free Questionnaire Maker

Together, we’ll discover the art of crafting surveys using a user-friendly, free questionnaire maker. This tool will help you design surveys that are as sleek and stylish as a James Bond tuxedo. From multiple-choice questions to open-ended inquiries, the possibilities are limitless.

And the best part?

You don’t need to be a tech genius or have a PhD in statistics to create insightful surveys.

But the journey doesn’t end there. Analyzing survey data is equally crucial. We’ll guide you through the steps to interpret your results, discover patterns, and draw actionable conclusions.

Let’s dive in and master the art of survey creation and analysis together.

Table of Contents:

  1. What is a  Free Questionnaire Maker?
  2. Why Do We Use a Free Questionnaire Maker?
  3. Pros of Using a Free Questionnaire Maker
  4. Revolutionize Data Collection: Craft a Survey with a Free Questionnaire Maker
  5. How to Evaluate Your Free Questionnaire Data?
  6. Wrap Up

What is a Free Questionnaire Maker?

A free questionnaire maker is a digital tool designed for crafting surveys and questionnaires. It simplifies creating structured questions, whether multiple choice, rating scales, or open-ended queries.

These tools offer templates, customization options, and data collection features, making it easy to gather information from respondents. They are widely used in research, marketing, and data analysis to gather insights and feedback efficiently.

Why Do We Use a Free Questionnaire Maker?

Why break the bank when you can break the mold? Here are some reasons why researchers are ditching expensive software and jumping aboard the free questionnaire maker train.

  1. Data collection: These tools include features for distributing surveys, such as email invitations, social media sharing, or embedding surveys on websites. This versatility allows you to collect responses from various sources and demographics, increasing the richness of the data.
  2. Customization: A free online questionnaire creator provides extensive customization possibilities. You can create questions tailored to specific needs: multiple-choice, Likert scale, ranking, or open-ended questions. This customization guarantees that the survey aligns perfectly with your research or data collection objectives.
  3. Data management: Free questionnaire makers come with built-in data management tools. They automatically collect and store survey responses in a structured format, reducing the risk of data entry errors. Consequently, you can easily organize this data for further analysis.
  4. Analysis tools: Many free questionnaire makers also offer basic data analysis capabilities. You can generate reports, charts, and graphs directly from the collected data. While these features may not be as robust as dedicated statistical software, they are sufficient for preliminary insights.
  5. Collaboration: Many free questionnaire makers allow multiple users to collaborate on survey creation and data analysis. This feature is especially beneficial for research teams and businesses where teamwork is essential.

Pros of Using a Free Questionnaire Maker

A free questionnaire maker is like having a personal assistant who can gather and organize responses. This leaves you more time to sip your coffee and ponder life’s more important questions.

Why?

  1. Cost savings: As the name suggests, free questionnaire makers are cost-effective. They eliminate the need to purchase expensive survey software or hire professional survey designers. This cost-saving aspect is particularly advantageous for startups, small businesses, non-profits, and institutions with limited budgets.
  2. User-friendly interface: Free questionnaire makers are designed to be user-friendly. They feature intuitive, drag-and-drop interfaces, making creating surveys without extensive training achievable.
  3. Efficiency: Free questionnaire makers streamline the entire survey process. They provide templates and question libraries that save time in survey creation. Additionally, many offer features like skip logic and randomization. This enhances data collection from survey efficiency by presenting questions based on respondents’ previous answers.
  4. Scalability: A free questionnaire maker can accommodate projects of different scales. Whether conducting a quick survey or a comprehensive research study, this tool can adapt to your needs.
  5. Accessibility: Since the tool is web-based, you can access it from anywhere with an internet connection. This accessibility allows for remote collaboration among team members and easy access to surveys by respondents.

Revolutionize Data Collection: Craft a Survey with a Free Questionnaire Maker

It’s time to become the survey-slinging detective you were always meant to be!

How? Let me guide you.

Let’s say you want to launch a hair salon. This necessitates you to conduct market research to understand customer preferences.

Assume your survey research consists of the following questions:

  • How important is the cleanliness of the hair salon to you?
  • How important is the ambiance of the hair salon to you?
  • How important is the professionalism of the hair salon staff to you?
  • How important are the prices of the services offered by the hair salon to you?

You want to map the response scale below to each question.

  • Extremely Unimportant
  • Unimportant
  • Not Sure
  • Important
  • Extremely Important

How do you go about this?

Use Google Forms

Why Google Forms?

  • Google Forms is entirely free to use.
  • It allows you to create and customize forms with multiple question types, including scale and grid questions.
  • Google Forms are mobile-friendly, allowing respondents to submit their responses from their mobile phones easily.
  • The data collected from the forms is automatically stored in a Google Sheets spreadsheet, making analysis convenient.
  • Google Forms supports logic branching, enabling different questions based on previous responses.

Follow the steps below to create your survey using Google Forms.

  • Open Google Forms and sign in with your Google account.
  • Click the “Blank” button to create a new form.
survey in google forms 1 ce440
  • Give your form a title and description that reflects your brand or purpose.
  • Choose the type of question you want to use, such as multiple-choice, checkbox, or short answer.
  • Type your question in the “Untitled Question” section for multiple-choice questions. Then write “Option 1” and choose “Add option” for more options.
survey in google forms 2 ce440
  • You can customize the look and feel of your survey to match your brand or theme.
  • Preview the form before sharing it with your target audience.
  • Click the share button to distribute it to your target audience.
survey in google forms 3 ce440
  • Once you collect enough responses, click the “Link to Sheets” button.
survey in google forms 4 ce440
  • Download the responses as a .csv file from the drop-down menu.
survey in google forms 5 ce440

How to Evaluate Free Questionnaire Data?

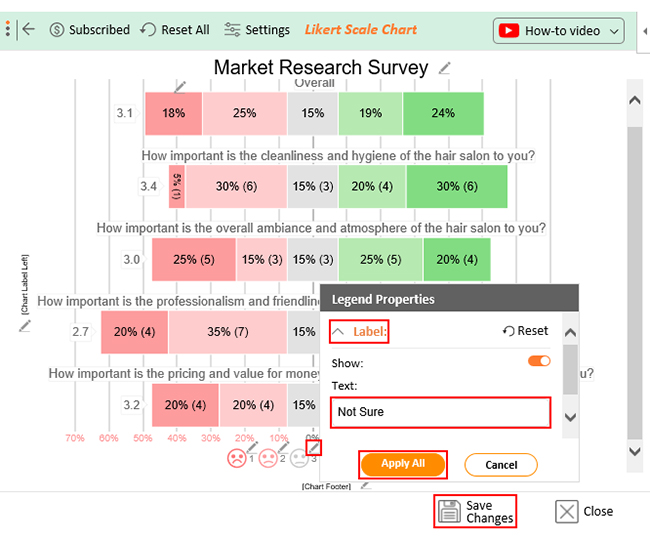
Excel, the trusty spreadsheet sidekick we’ve all grown fond of, is a powerful tool for data analysis. But when it comes to visualizing data, it’s like asking a penguin to dance the tango. Sure, it’s got bar graphs and pie charts, but what about those nuanced Likert scale responses?

That’s where ChartExpo steps in.

ChartExpo is a data-driven chart maker that creates visualizations guaranteed to wow your audience, all while keeping your presentations penguin-tango-free.

Benefits of Using ChartExpo

  • ChartExpo provides a wide range of visualizations, letting you handpick the perfect one for your data.
  • Navigating ChartExpo’s user interface is smoother than a hot knife through butter. It’s your backstage pass to crafting appealing, insightful charts without the techy headache.
  • ChartExpo isn’t just a one-size-fits-all deal; it’s your stylist for visuals. Tweak colors, fonts, and styles to your heart’s content – your charts should be as unique as you are.
  • ChartExpo is a budget-friendly superstar! It rolls out the red carpet with a free 7-day trial and an all-access $10 monthly pass. Thus, it gives your wallet more reasons to smile than a lottery winner.

How to Install ChartExpo in Excel?

  1. Open your Excel application.
  2. Open the worksheet and click the “Insert” menu.
  3. You’ll see the “My Apps” option.
  4. In the office Add-ins window, click “Store” and search for ChartExpo on my Apps Store.
  5. Click the “Add” button to install ChartExpo in your Excel.

ChartExpo charts are available both in Google Sheets and Microsoft Excel. Please use the following CTA’s to install the tool of your choice and create beautiful visualizations in a few clicks in your favorite tool.

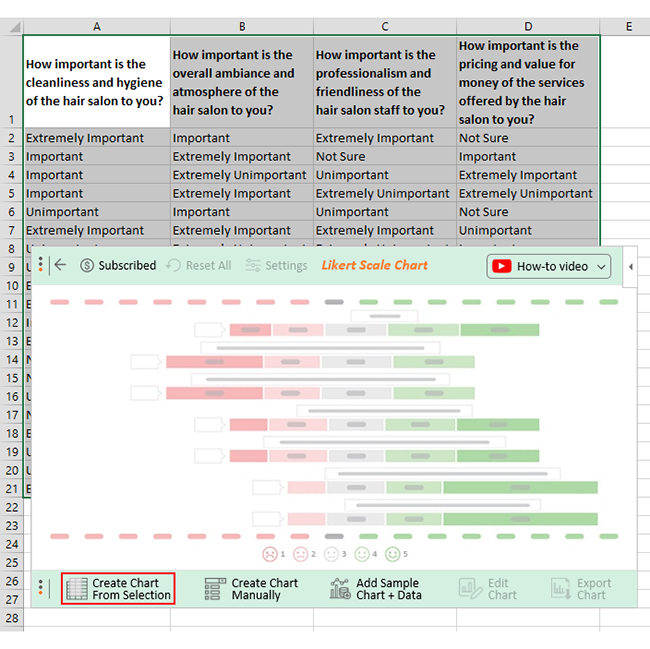
Let’s say your survey yields the results table below.

How important is the cleanliness of the hair salon to you? How important is the ambiance of the hair salon to you? How important is the professionalism of the hair salon staff to you? How important is the pricing of the services offered by the hair salon to you?
Extremely Important Important Extremely Important Not Sure
Important Extremely Important Not Sure Important
Important Extremely Unimportant Unimportant Extremely Important
Important Extremely Important Extremely Unimportant Extremely Unimportant
Unimportant Important Unimportant Not Sure
Extremely Important Extremely Important Extremely Important Unimportant
Unimportant Extremely Unimportant Extremely Unimportant Important
Unimportant Important Not Sure Unimportant
Extremely Important Important Unimportant Extremely Unimportant
Extremely Important Not Sure Unimportant Extremely Important
Important Unimportant Important Unimportant
Extremely Unimportant Unimportant Not Sure Extremely Unimportant
Not Sure Important Unimportant Important
Not Sure Extremely Important Important Unimportant
Unimportant Not Sure Unimportant Extremely Important
Not Sure Extremely Unimportant Extremely Unimportant Extremely Unimportant
Extremely Important Extremely Unimportant Important Not Sure
Unimportant Not Sure Extremely Important Extremely Important
Unimportant Extremely Unimportant Extremely Unimportant Extremely Important
Extremely Important Unimportant Unimportant Extremely Important

This table contains example data. Expect many responses and questions in real life.

  • To get started with ChartExpo, install ChartExpo in Excel.
  • Navigate to the INSERT menu and select My Apps. 
insert chartexpo in excel
  • Select ChartExpo and click the “Insert” button.
open chartexpo in excel
  • Once it loads, choose the “Likert Scale Chart” from the charts list.
search likert scale chart in excel
  • Select the data from the sheet and click the “Create Chart From Selection” button.
Create Chart From Selection ce440
  • When you click the “Create Chart From Selection” button, you have to map responses with numbers manually. The Likert scale has this arrangement:
    • Extremely Unimportant = 1
    • Unimportant = 2
    • Not Sure = 3
    • Important = 4
    • Extremely Important = 5
  • Once all is set, click the “Create Chart” button.
Map Likert Responses to Numbers ce440
  • ChartExpo will generate the visualization below for you.
Free Questionnaire Maker Design Template
  • Click the “Edit Chart” button to modify your chart.
  • Click the pencil icon next to the Chart Header to add a title.
  • This will open the properties dialog.
  • Add a heading in Line 1 under the Text section and enable the Show option. Then click the “Apply” button.
apply title on chart ce440
  • Let’s say you want to add text responses instead of numbers against every emoji.
  • Click the pencil icon next to the respective emoji. Expand the “Label” properties and write the required text. Then click the “Apply All” button.
  • Click the “Save Changes” button to persist the changes.
apply label value on chart ce440
  • Your final chart will appear below.
Final Free Questionnaire Maker

Insights

  • 50% of respondents prioritize cleanliness when choosing a hair salon. 35% consider it unimportant, and 15% are unsure about its importance.
  • Regarding the ambiance, 45% find it important, while 40% consider it unimportant.
  • The professionalism of the staff is deemed important by 30% of respondents, while 55% do not consider it a significant factor.
  • 45% value pricing, while 40% do not.
  • Overall, 43% of respondents find these factors essential in their decision-making process, while the same percentage do not.

FAQs

How do I create a free survey questionnaire?

  1. Sign up for a free online survey creator like Google Forms.
  2. Choose a template or start from scratch.
  3. Add questions, customize options, and design.
  4. Distribute the survey via email, social media, or links.
  5. Collect and analyze responses for insights.

How do I create a self-made questionnaire?

  1. Define your research goals and target audience.
  2. Craft clear and unbiased questions.
  3. Choose question types (multiple-choice, Likert scales, etc.).
  4. Organize questions logically.
  5. Test the questionnaire with a small group.
  6. Revise based on feedback.
  7. Finalize and distribute to gather data.

How do I create a free questionnaire in Google Forms?

  1. Open Google Forms in your Google account.
  2. Click “+ Blank” to start a new form.
  3. Add questions using various question types.
  4. Customize design and settings.
  5. Share the form link or embed it.
  6. Collect responses in Google Sheets for analysis.

Wrap Up

The ability to craft tailored surveys, gather data efficiently, and visualize results is a formidable skill. It transcends industries, from marketing to academia, empowering you to understand people’s opinions, behaviors, and preferences.

Creating and analyzing surveys with a free questionnaire maker can be a game-changer in your quest for insights. These tools offer accessibility, customization, and cost-effectiveness, empowering individuals and organizations alike.

Embracing free questionnaire makers unlocks a world of possibilities. You can collect feedback, conduct market research, assess employee satisfaction, and more, all while saving time and resources.

However, it’s not just about creating surveys; it’s about wielding data as a weapon of knowledge. Analyzing the collected data with the right tool, like ChartExpo, elevates your findings to actionable insights. This analytical prowess can shape strategies, drive improvements, and steer organizations toward success.

As you embark on the surveying journey, remember that the right questionnaire maker is your trusted companion. It’s your ticket to unlocking the treasure trove of insights hidden within the responses of your target audience. Embrace, use it wisely, and watch your understanding of the world expand.

Happy surveying!

How much did you enjoy this article?

ExcelAd2
Start Free Trial!
129627

Related articles

next previous
Microsoft Excel8 min read

Excel Task Tracker Template for Smarter Task Insights

Task tracker template in Excel organizes tasks, tracks deadlines, and boosts efficiency. Learn its benefits, and explore expert tips to simplify task management.

Microsoft Excel10 min read

Invoice Tracker Template in Excel for Better Insights

An invoice tracker Excel template helps track invoices, due dates, and payments. Learn how to use this template for better financial management.

Microsoft Excel12 min read

Key Performance Indicators in Healthcare for Better Insights

Key Performance Indicators in healthcare track patient care and efficiency. Learn about these KPIs, top examples, and how to use them to improve outcomes.

Microsoft Excel10 min read

BMI Calculation Formula in Excel for Better Fitness Insights

The BMI calculation formula in Excel helps track and analyze body mass index. Explore step-by-step instructions and tips to simplify BMI tracking in Excel.

Microsoft Excel29 min read

How to Create a Tornado Chart in Excel? A Complete Guide

Click to learn how to plot a Tornado Chart in Excel using easy-to-follow steps. Also, we’ll address the following question: what is a Tornado Diagram?

ChartExpo logo

Turn Data into Visual
Stories

CHARTEXPO

  • Home
  • Gallery
  • Videos
  • Services
  • Pricing
  • Contact us
  • FAQs
  • Privacy policy
  • Terms of Service
  • Sitemap

TOOLS

  • ChartExpo for Google Sheets
  • ChartExpo for Microsoft Excel
  • Power BI Custom Visuals by ChartExpo
  • Word Cloud

CATEGORIES

  • Bar Charts
  • Circle Graphs
  • Column Charts
  • Combo Charts
  • Comparison Charts
  • Line Graphs
  • PPC Charts
  • Sentiment Analysis Charts
  • Survey Charts

TOP CHARTS

  • Sankey Diagram
  • Likert Scale Chart
  • Comparison Bar Chart
  • Pareto Chart
  • Funnel Chart
  • Gauge Chart
  • Radar Chart
  • Radial Bar Chart
  • Sunburst Chart
  • see more
  • Scatter Plot Chart
  • CSAT Survey Bar Chart
  • CSAT Survey Chart
  • Dot Plot Chart
  • Double Bar Graph
  • Matrix Chart
  • Multi Axis Line Chart
  • Overlapping Bar Chart
  • Control Chart
  • Slope Chart
  • Clustered Bar Chart
  • Clustered Column Chart
  • Box and Whisker Plot
  • Tornado Chart
  • Waterfall Chart
  • Word Cloud
  • see less

RESOURCES

  • Blog
  • Resources
  • YouTube
SIGN UP FOR UPDATES

We wouldn't dream of spamming you or selling your info.

© 2025 ChartExpo, all rights reserved.