Categories
Excel spreadsheet for debt snowball—what makes it so effective?
Debt can feel overwhelming, but a clear plan changes everything. The debt snowball method helps you gain momentum as you pay off balances from smallest to largest. An Excel spreadsheet for debt snowball keeps everything organized, tracking payments and progress in one place.


Many of us juggle car loans, student debt, and mortgages. Paying the minimum keeps balances lingering for years. The debt snowball strategy flips the script, focusing on small wins that build motivation.
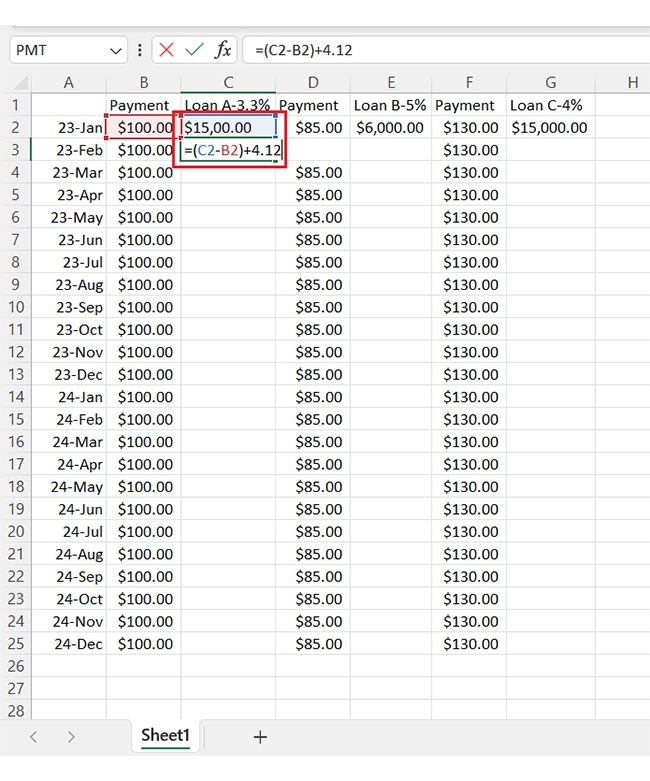
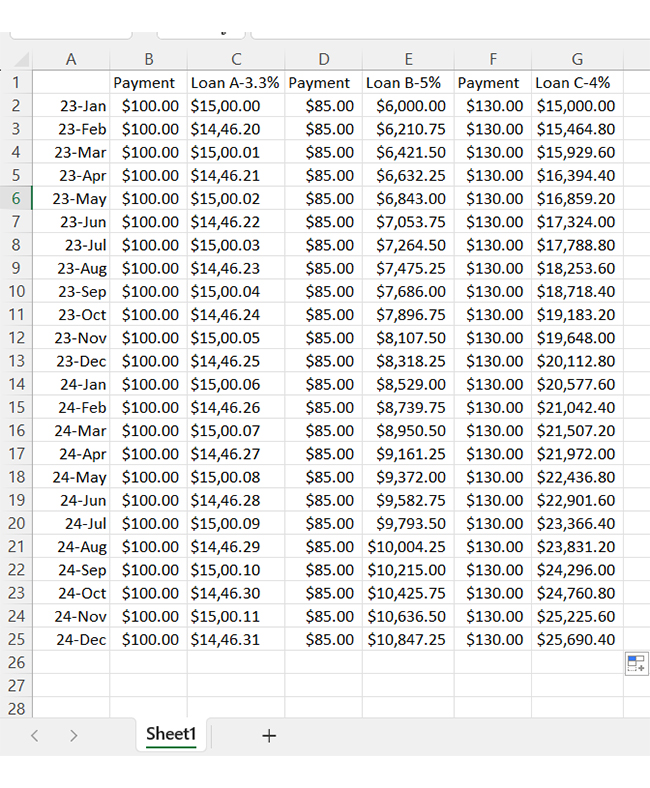
A well-structured Excel spreadsheet for debt snowball simplifies the process. Enter your debts, list minimum payments, and track extra costs on the smallest balance. Then, roll that payment into the next one each time a debt is paid off.
Seeing progress fuels momentum. Data consolidation in Excel can combine multiple debt sources into one clear view.
The snowball method focuses on quick wins, keeping motivation high. A spreadsheet eliminates guesswork, showing exactly how long the payoff will take. Moreover, converting Excel data to graphs helps visualize progress, turning numbers into clear insights.
Financial freedom starts with a plan. A simple spreadsheet helps you stay on track, adjust payments, and celebrate progress. An income statement template in Excel can also track your overall financial health, ensuring long-term stability.
Definition: An Excel spreadsheet for debt snowball helps track debt payments. It organizes balances, interest rates, and minimum payments in one place.
The debt snowball method focuses on paying the smallest debt first. Once paid off, that payment rolls into the next debt, building momentum and motivation.
This spreadsheet automates calculations and shows progress over time. It helps visualize a clear path to debt-free. Moreover, using a monthly financial report template in Excel helps you track overall income, expenses, and debt payments.
Paying off debt can feel overwhelming. But with the right tool, you can stay on track and motivated. The debt snowball Excel spreadsheet is a powerful yet simple tool to organize and eliminate debt. Here’s why it works so well:
Debt can feel like a mountain, but the right strategy helps you climb it faster. The Debt Snowball and Debt Avalanche methods have their strengths. Let’s use a comparison chart template to compare them so you can choose the best fit.
| Method | Debt Snowball | Debt Avalanche |
| Approach | Pay off the smallest debt first, then move to the next smallest | Pay off the debt with the highest interest rate first. |
| Motivation | Quick wins keep you motivated. Paying off small debts first gives a sense of accomplishment. | Saves the most money over time. Eliminating high-interest debt first reduces overall costs. |
| Steps | 1. List debts from smallest to largest.
2. Pay minimums on all but the smallest debt. 3. Throw all extra money into the smallest debt .4. After paying it off, apply that payment to the next smallest debt. 5. Repeat until debt-free. |
1. List debts from highest to lowest interest rate.
2. Pay minimums on all but the highest-interest debt. 3. Put all extra money toward the highest-interest debt. 4. After paying it off, apply that payment to the next highest-interest debt. 5. Repeat until debt-free. |
| Best For | Those who need motivation and quick wins to stay on track. | Those who want to pay the least interest get out of debt faster. |
| Drawback | You might pay more in interest over time. Since you ignore interest rates, high-interest debts may linger longer. | Progress can feel slow at first. Paying off large debts first may take longer to see results. |
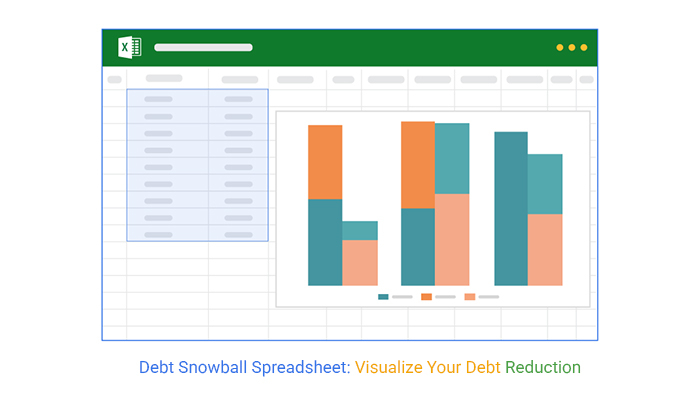
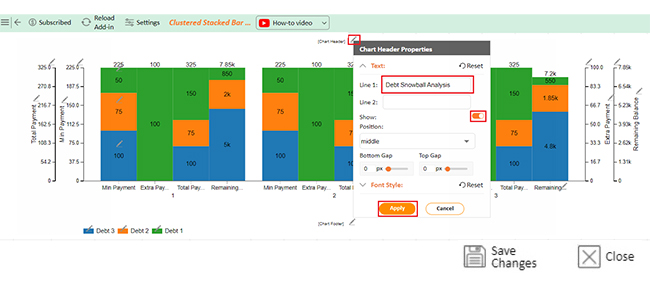
Want to crush your debt and stay organized? An Excel snowball debt spreadsheet tracks payments and shows real-time progress. Moreover, use this data for an Excel chart to visualize your debt reduction. Setting it up is easier than you think;
Let’s see how to use the snowball method and data modeling in Excel to become debt-free.


Are you drowning in debt? The debt snowball method can help you dig your way out, one payment at a time.
An Excel spreadsheet makes tracking easy, but let’s be honest—Excel’s charts can be a headache. What’s the fuss about charts? Data storytelling brings your financial journey to life, making it easier to see patterns and progress. Data visualization is key to understanding your progress.
But don’t worry about Excel’s limitations. I have a solution: ChartExpo.
ChartExpo transforms boring spreadsheets into clear, insightful visuals, making your debt payoff journey more motivating and manageable. First, learn how to clean data, install Excel, and transform your data into meaningful visualizations.
How?
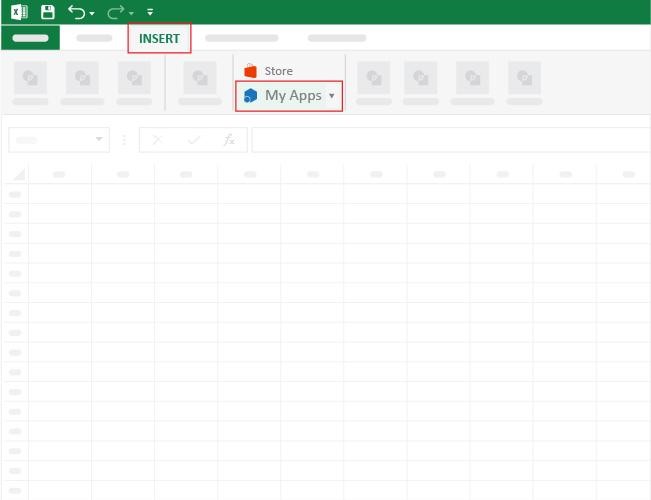
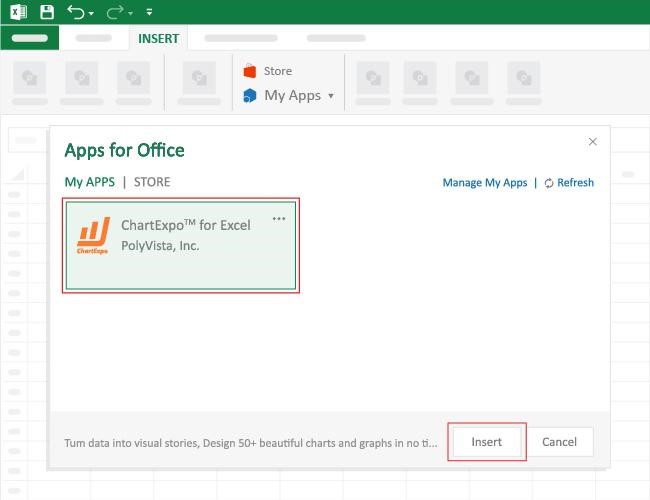
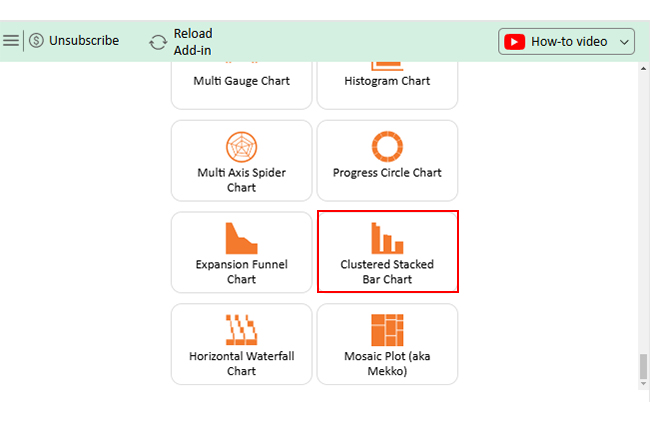
How to Install ChartExpo in Excel?
ChartExpo charts are available both in Google Sheets and Microsoft Excel. Please use the following CTAs to install the tool of your choice and create beautiful visualizations with a few clicks in your favorite tool.
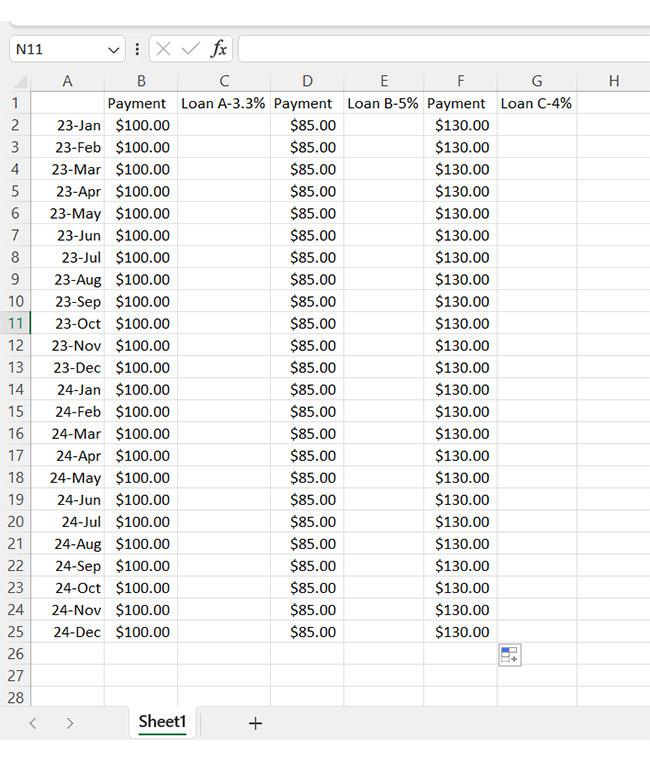
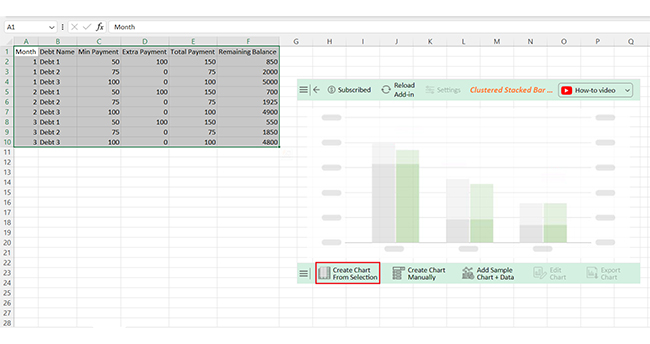
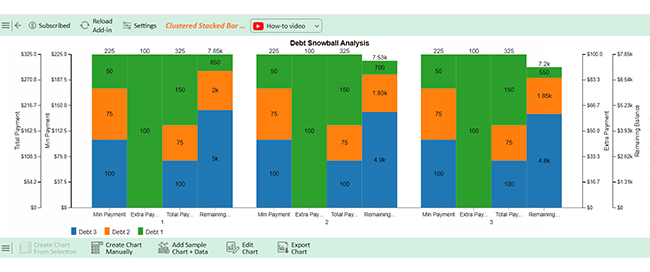
Let’s analyze this sample data and learn how to create a report in Excel using ChartExpo;
| Month | Debt Name | Min Payment | Extra Payment | Total Payment | Remaining Balance |
| 1 | Debt 1 | 50 | 100 | 150 | 850 |
| 1 | Debt 2 | 75 | 0 | 75 | 2000 |
| 1 | Debt 3 | 100 | 0 | 100 | 5000 |
| 2 | Debt 1 | 50 | 100 | 150 | 700 |
| 2 | Debt 2 | 75 | 0 | 75 | 1925 |
| 2 | Debt 3 | 100 | 0 | 100 | 4900 |
| 3 | Debt 1 | 50 | 100 | 150 | 550 |
| 3 | Debt 2 | 75 | 0 | 75 | 1850 |
| 3 | Debt 3 | 100 | 0 | 100 | 4800 |
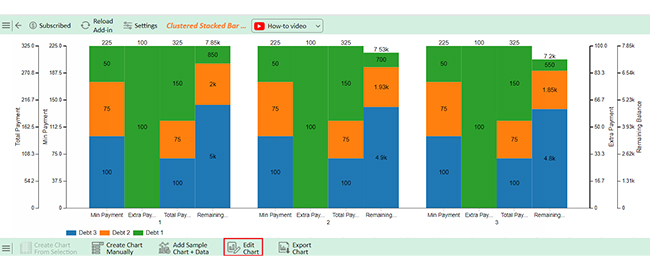
The debt snowball method gains momentum by focusing on small wins. A spreadsheet makes the process easier, keeping everything organized. Visual analytics helps you track progress more effectively, turning numbers into clear, actionable insights. Here’s how it works step by step:


Excel doesn’t have a built-in debt snowball template. However, you can create one using formulas and tables. Many free and paid templates are also available online. These templates help track payments, balances, and progress toward becoming debt-free faster.
An Excel spreadsheet for debt snowball keeps your debt payoff plan organized. It tracks balances, payments, and progress in one place.
Debt can be overwhelming, but small wins create motivation. The debt snowball method builds momentum by focusing on the smallest balance first. Paying off one debt at a time boosts confidence and keeps you moving forward.
Tracking payments is key to success. A spreadsheet helps you see where your money is going. Moreover, using data transformation in Excel, you can clean and structure your financial data for better tracking.
Automation makes calculations effortless. The spreadsheet updates totals, calculates payoff dates, and adjusts remaining balances. Therefore, you always have a clear picture of your progress.
Visualizing your progress keeps you motivated. Advanced Excel charts help display debt reduction trends, making it easier to stay on track. Watching balances shrink month by month keeps you focused on the goal.
Staying consistent is the secret to success. A spreadsheet ensures you stick to the plan without confusion. A progress bar in Excel shows real-time progress toward debt freedom.
Debt freedom is possible with the right strategy. Small actions lead to big results over time. This debt snowball method keeps you on track and motivated to reach your financial goals.
Do you want better results? Install ChartExpo to enhance your Excel experience by creating clear, insightful charts to track progress.
How much did you enjoy this article?


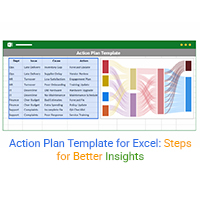
Use an Action Plan Template for Excel to organize tasks, set deadlines, and track progress across any project, from business to personal goals and more.
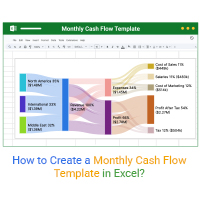
What is a Cash Flow Template? Click to learn how to create a Monthly Cash Flow Template in Excel to keep track of your Financial Position.
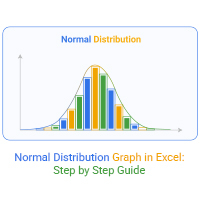
A normal distribution graph in Excel shows patterns, averages, and outliers. Learn how to create one, see examples, and boost your data analysis skills.