• Home
  • Tools dropdown img
    • Spreadsheet Charts

      • ChartExpo for Google Sheets
      • ChartExpo for Microsoft Excel
    • Power BI Charts

      • Power BI Custom Visuals by ChartExpo
    • Word Cloud

  • Charts dropdown img
    • Chart Category

      • Bar Charts
      • Circle Graphs
      • Column Charts
      • Combo Charts
      • Comparison Charts
      • Line Graphs
      • PPC Charts
      • Sentiment Analysis Charts
      • Survey Charts
    • Chart Type

      • Box and Whisker Plot
      • Clustered Bar Chart
      • Clustered Column Chart
      • Comparison Bar Chart
      • Control Chart
      • CSAT Survey Bar Chart
      • CSAT Survey Chart
      • Dot Plot Chart
      • Double Bar Graph
      • Funnel Chart
      • Gauge Chart
      • Likert Scale Chart
      • Matrix Chart
      • Multi Axis Line Chart
      • Overlapping Bar Chart
      • Pareto Chart
      • Radar Chart
      • Radial Bar Chart
      • Sankey Diagram
      • Scatter Plot Chart
      • Slope Chart
      • Sunburst Chart
      • Tornado Chart
      • Waterfall Chart
      • Word Cloud
    • Google Sheets
      Microsoft Excel
  • Services
  • Pricing
  • Contact us
  • Blog
  • Support dropdown img
      • Gallery
      • Videos
      • Contact us
      • FAQs
      • Resources
    • Please feel free to contact us

      atsupport@chartexpo.com

Categories
All Data Visualizations Data Analytics Surveys
Add-ons/
  • Google Sheets
  • Microsoft Excel
  • Power BI
All Data Visualizations Data Analytics Surveys
Add-ons
  • Google Sheets
  • Microsoft Excel
  • Power BI

We use cookies

This website uses cookies to provide better user experience and user's session management.
By continuing visiting this website you consent the use of these cookies.

Ok

ChartExpo Survey


Home > Blog > Power BI

ETL versus ELT: How to Optimize for Faster Insights

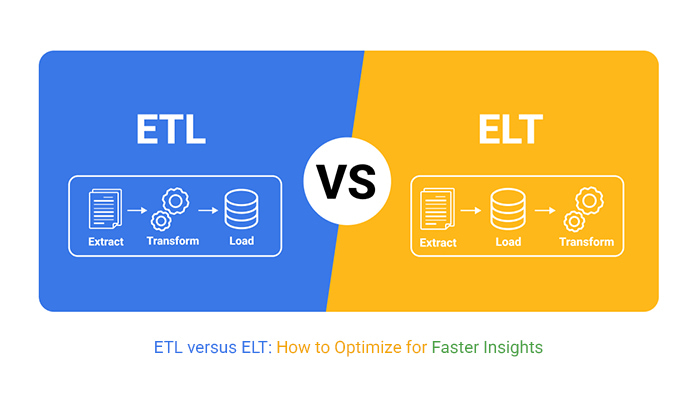
ETL (Extract, Transform, Load) and ELT (Extract, Load, Transform) are data processing approaches. ETL helps transform data before loading it into a data warehouse. ELT, on the other hand, loads raw data before transformation, enabling flexibility.

ETL versus ELT

This guide dives deep into the ETL versus ELT debate. It shows you when to use the ETL versus ELT, the difference between the ETL versus ELT, and the similarities between the ETL and ELT. You’ll also discover how to do the ELT and ETL processes, and how they differ from each other.

Table of Contents:

  1. What is ETL versus ELT?
  2. Difference Between ETL vs ELT
  3. Similarities Between ETL and ELT
  4. How to Analyze ETL vs ELT in Power BI?
  5. How Do the ELT and ETL Processes Differ from Each Other?
  6. Use Cases of ELT versus ETL
  7. Pros and Cons of ELT vs ETL
  8. Which is Better: ETL or ELT?
  9. FAQs
  10. Wrap Up

What is ETL versus ELT?

  1. ETL (Extract, Transform, Load):
    • Extract: Data is extracted from multiple sources.
    • Transform: The data is transformed (cleaned, aggregated, or formatted) before loading into the target data warehouse.
    • Load: The transformed data is loaded into the data warehouse for analysis.
  2. ELT (Extract, Load, Transform):
    • Extract: Data is extracted from the source system
    • Load: The raw data is loaded into the data warehouse (or data lake).
    • Transform: Data transformation occurs after the loading. The power of modern cloud-based systems is leveraged to process and transform data at scale.

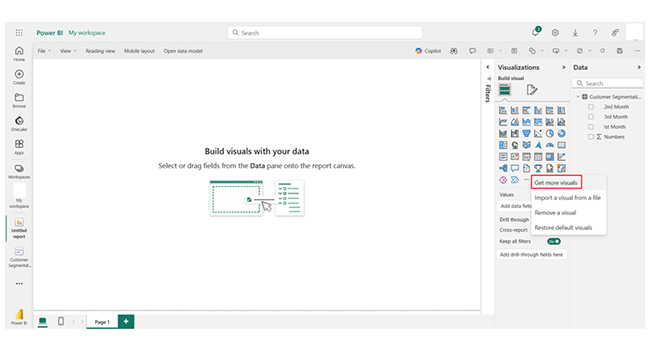
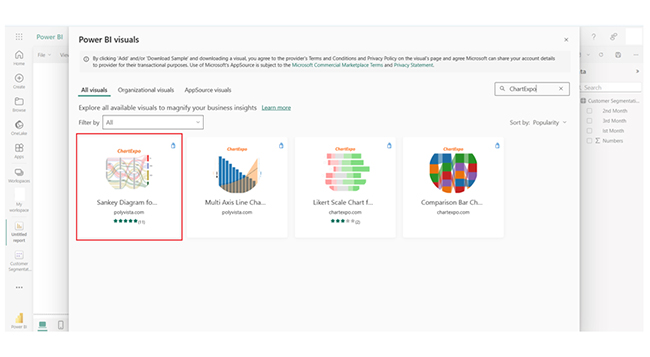
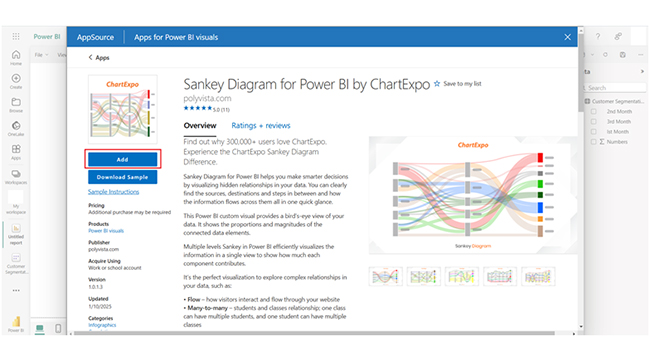
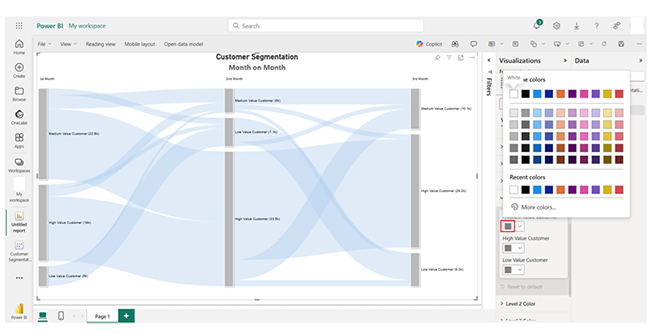
Visualizing ETL Versus ELT in Power BI Using Sankey Diagram for Data Flow Representation

Visualizing ETL Versus ELT in Google Sheets Using Sankey Diagram for Data Flow Representation

Visualizing ETL Versus ELT in Microsoft Excel Using Sankey Diagram for Data Flow Representation

Difference Between ETL vs ELT

  • Process Flow: ETL has the Extract —> Transform —> Load process flow, while ELT has the Extract —> Load —> Transform process flow.
  • Transformation Timing: In ETL, data is transformed before loading into the target system. However, data is loaded into the target system first and then transformed in ELT.
  • Complexity: In ETL, transformation happens at the source side, and that requires more processing power and time. In ELT, transformation occurs in the data warehouse, and that makes it more scalable and flexible.
  • Use Case: ETL is ideal for traditional data warehouses with structured data that needs significant transformation. ELT, on the other hand, is best for cloud-based systems (or big data environments) where transformation can be handled post-load.

 Similarities Between ETL and ELT

  • Data Extraction: Both processes extract data from multiple sources.
  • Data Loading: Both load extracted data into a target system (or data repository) for transformation.
  • Data Cleansing: Both involve data cleansing, either before (or after) loading, but that depends on the method.
  • Data Transformation: Both processes involve transforming raw data into a usable format for business insights.

How to Analyze ETL vs ELT in Power BI?

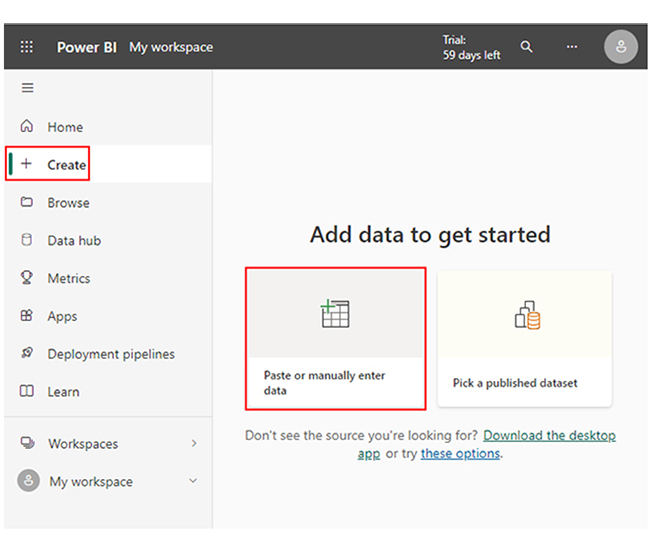
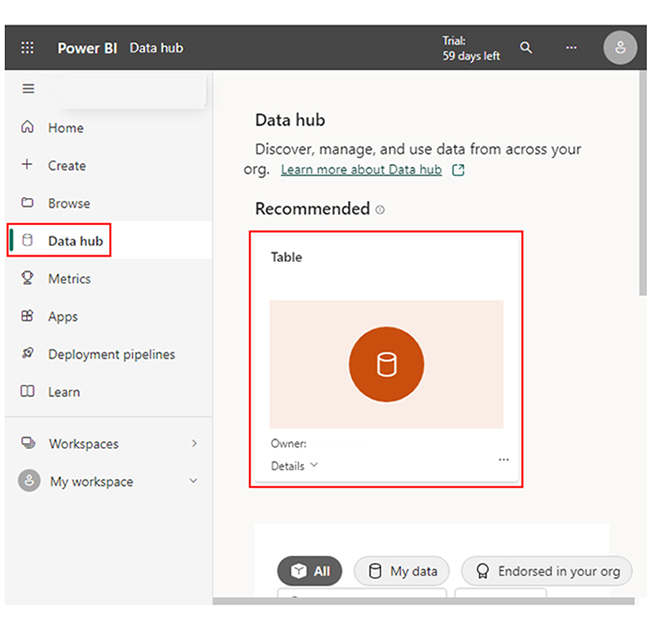
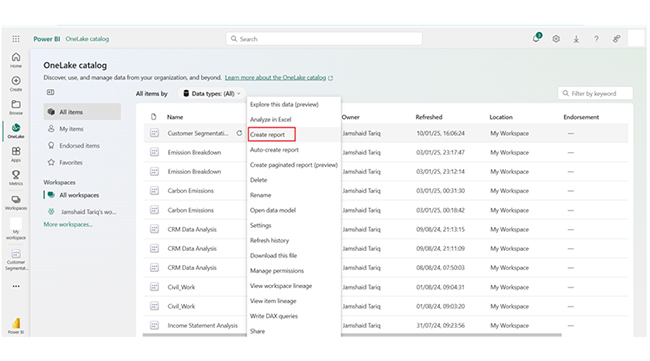
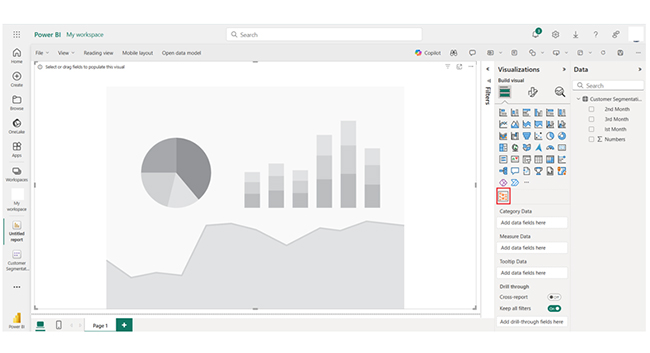
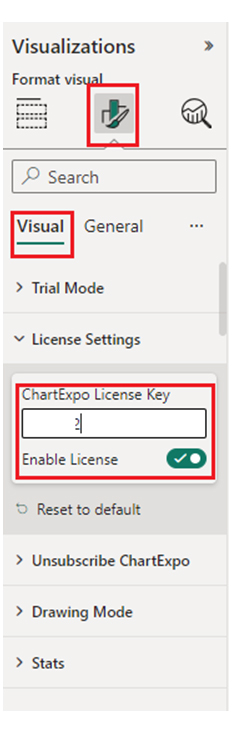
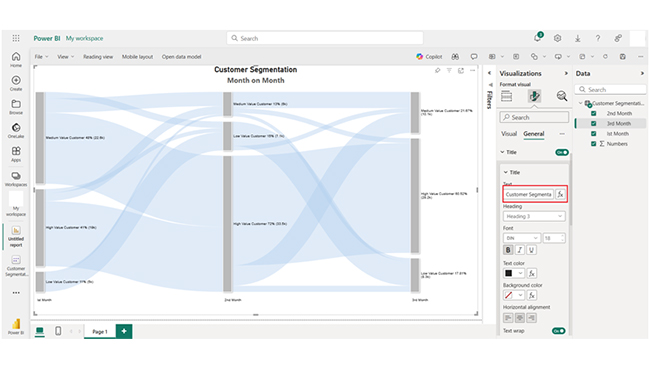
This section shows you how to use Power BI, and how Power BI transforms data. You’ll discover the Power BI metrics to look out for during data mining.

When performing market analysis, here are the data visualization stages you’ll follow.

  • Stage 1: Log into Power BI, enter your email, and click the “Submit” button.
ETL versus ELT
  • You’ll be redirected to a Microsoft account, enter your password, and click “Sign in.”
ETL versus ELT
  • You can opt to stay signed in.
ETL versus ELT
  • Stage 2: Create a Data Set and Select the Data Set to Use in the Sankey Diagram.
  • Navigate to the left-side menu, and click on the “Create” option. After that, select “Paste or manually enter data.”
ETL versus ELT
  • The following Customer Segmentation data will be used for this illustration.
ETL versus ELT
ETL versus ELT
  • Paste the Power BI dataset table into the “Power Query” window. Next, select the third “Create” option.
ETL versus ELT
  • Navigate to the left-side menu, and click on the “Data Hub” option. Power BI will populate the data set list. If no data set has been created, you’ll get an error message.
ETL versus ELT
  • Click on the “Create report” dropdown.
ETL versus ELT
  • To add the Power BI Sankey Diagram Extension by ChartExpo, you’ll have to use an add-in or Power BI visual from AppSource. Navigate to the right side of the Power BI dashboard, and open the Power BI visualizations panel.
  • Click the ellipsis symbol (…) to import the Power BI Sankey Diagram extension by ChartExpo. In the following menu that opens, select the “Get more visuals” option.
ETL versus ELT
  • In the following window that opens, enter “ChartExpo” in the highlighted search box. You’ll see the “Sankey Diagram for Power BI by ChartExpo.”
ETL versus ELT
  • After that, click on the Sankey Diagram and also click the highlighted “Add” button.
ETL versus ELT
  • Power BI will add the “Sankey Diagram for Power BI by ChartExpo” icon in the visualization panel.
ETL versus ELT
  • To draw a Sankey Diagram with ChartExpo’s Power BI extension, you’ll have to select the “Sankey Diagram for Power BI by ChartExpo” icon in the visualization panel. You’ll have to select the fields to use in the Sankey chart. Provide an email address or a ChartExpo license key.
  • Add the key under the Visual section. After that, you’ll see the Sankey Chart.
ETL versus ELT
  • You can add the top header text in the chart under the General section.
ETL versus ELT
  • After that, click on General and add the top header text.
ETL versus ELT
  • You can disable the percentage value.
ETL versus ELT
  • Set the Level Labels on the top position.
ETL versus ELT
  • To change the Nodes, follow the steps below:
ETL versus ELT
  • Here’s the final Sankey Chart.
ETL versus ELT

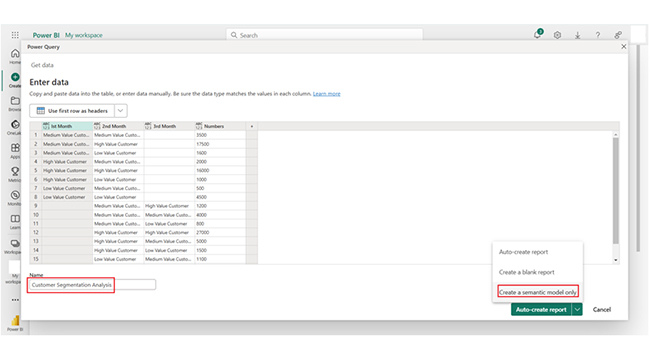
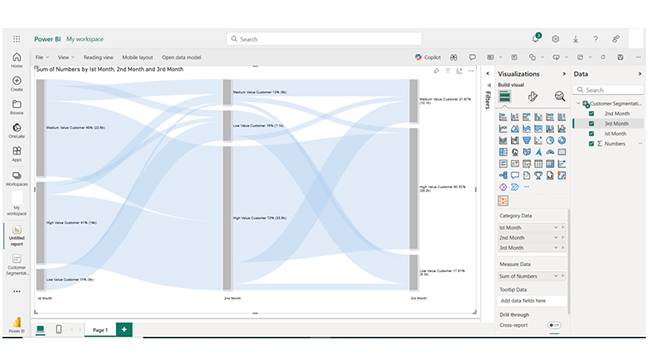
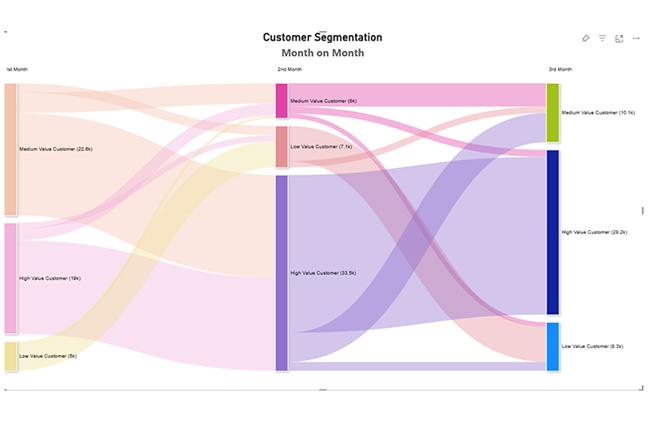
The Power BI report sample above shows how important data storytelling is. You can use the same steps outlined above to perform a regular data presentation or predictive analytics.

Insights

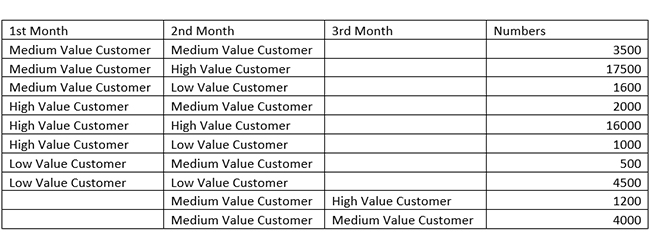
The data tracks customer transitions across value categories over three months. High-value customers dominate revenue, with consistent retention and some downgrades.

Medium-value customers frequently shift between higher and lower tiers, and that reflects volatility. Low-value customers remain in their category but occasionally upgrade, and that indicates potential growth opportunities in targeted engagement.

How Do the ELT and ETL Processes Differ from Each Other?

  1. Process Flow

  • ETL:
    • Extract: Data is extracted from multiple sources (like APIs, or databases).
    • Transform: Data is enriched, cleaned, and transformed to meet the requirements of the target system.
    • Load:
  • ELT:
    • Extract: Data is extracted from multiple sources (like ETL).
    • Load: Data is loaded directly into the target system without any transformation.
    • Transform: Data is transformed within the target system (for example: warehouse, cloud data).
  1. Timing of Transformation

    • ETL: Data transformation happens before the data is loaded into the data warehouse (or target system).
    • ELT: Transformation occurs after the data is loaded into the target system.
  1. Technology and Infrastructure

    • ETL: It requires more processing power on the source system (or external transformation tools).
    • ELT: It relies on the target system (which could be cloud-based data platforms like Snowflake, AWS Redshift, or Google BigQuery) to process and transform large volumes of raw data.

Use Cases of ELT versus ETL

ETL Use Cases:

  • Traditional Data Warehouses: Data must be transformed and cleared before loading.
  • Financial and Regulatory Reporting: It ascertains that data is pre-processed for accuracy and compliance.

ELT Use Cases:

  • Cloud-Based Warehouses: It leverages the scalability and computing power of cloud platforms.
  • Big Data: Effective for handling large volumes of raw data in near real-time.

Pros and Cons of ELT vs ETL

ETL Pros

  • Pre-processed Data: The transformed data is ready for analysis.
  • Controlled Transformations: It ascertains that the data is clean and consistent before loading.
  • Good for Smaller Datasets: It works well with traditional, structured data in on-premise environments.

ETL Cons

  • Slower Data Load: Transformation before loading can delay the process.
  • Limited Flexibility: The changes in transformation require re-extraction of data.

ELT Pros

  • Scalable: It works well with large datasets and cloud environments.
  • Flexibility: It allows transformations after data is loaded.
  • Faster Data Load: Raw data is loaded first, and that makes the process quicker.

ELT Cons

  • Requires Advanced Infrastructure: It leverages cloud computing power for transformations.
  • Post-load Processing: It can delay analysis since transformations occur later.

Which is Better: ETL or ELT?

ETL is Better When

  • Working with smaller, structured datasets (or on-premise systems).
  • Ensuring consistency (and quality) of data before analysis is crucial.

ELT is Better When

  • Working with large, unstructured, or raw datasets in cloud-based environments.
  • Scalability is needed, and that comes into play with modern big data platforms (or real-time analytics).

FAQs

What is the difference between ETL and ELT with an example?

ETL transforms data before loading it into the target system. It’s the best fit for structured data. Financial reporting is a good example. ELT loads raw data first and transforms it later. It’s the best fit for big data. Marketing analysis is a good example.

Why ETL and not ELT?

ETL is preferred when data requires significant cleaning, transformation, or aggregation before analysis. It ascertains high-quality, consistent data for regulated industries or structured data environments, and that reduces the risk of errors.

Wrap Up

ETL transforms data before loading. ELT, on the other hand, loads raw data first and transforms it later. ETL is used for structured data that needs preprocessing. ELT is used for scalable, flexible cloud-based environments.

ETL plays a major role in complex data transformation. It’s necessary when intricate data manipulations (like aggregations) are required upfront. If you’re working with unstructured data, you’re better off with ELT. ELT is a great fit for data lakes where raw, unstructured data is processed later.

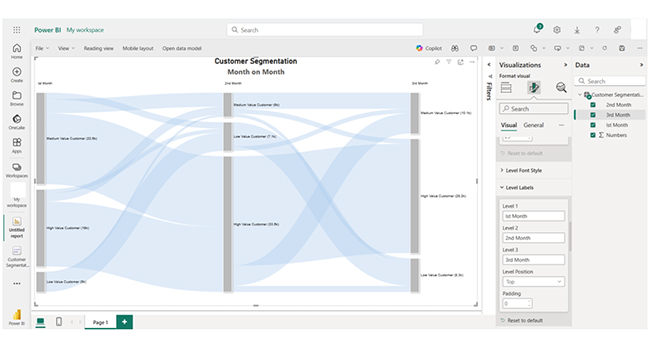
By following the steps in this guide, you’ll be able to create compelling visuals with a Sankey chart.

Now you have a good understanding of the ETL versus ELT debate, which of these data processing approaches will you use in your next data analysis process?

How much did you enjoy this article?

PBIAd2
Start Free Trial!
148881

Related articles

next previous
Power BI12 min read

How to Create Sankey Diagram in Microsoft Power BI?

Learn How to Create Sankey Diagram in Microsoft Power BI using Desktop & Web Service. What they are and how to use them effectively.

Power BI8 min read

Power BI Artificial Intelligence: Insights Using Visuals

Discover all there is to know about the Power BI artificial intelligence. You'll also discover how AI is used in Power BI, and how to use it for analysis and more.

Power BI9 min read

Budgeting in Healthcare: Use Visuals to Spot Budget Gaps

This guide helps you discover what budgeting in healthcare is. You'll also discover the factors that affect hospital budgets and types of budgeting in healthcare.

Power BI9 min read

Predictive Analytics in Power BI for Making Insightful Visuals

This guide shows you everything you need to know about Predictive Analytics in Power BI. It also shows you how it works, and how to interpret the results.

Power BI8 min read

Quarterly Business Review Template for Optimum Reports

Discover what the quarterly business review template is. This guide also shows you the best practices to consider when using the QBR template.

ChartExpo logo

Turn Data into Visual
Stories

CHARTEXPO

  • Home
  • Gallery
  • Videos
  • Services
  • Pricing
  • Contact us
  • FAQs
  • Privacy policy
  • Terms of Service
  • Sitemap

TOOLS

  • ChartExpo for Google Sheets
  • ChartExpo for Microsoft Excel
  • Power BI Custom Visuals by ChartExpo
  • Word Cloud

CATEGORIES

  • Bar Charts
  • Circle Graphs
  • Column Charts
  • Combo Charts
  • Comparison Charts
  • Line Graphs
  • PPC Charts
  • Sentiment Analysis Charts
  • Survey Charts

TOP CHARTS

  • Sankey Diagram
  • Likert Scale Chart
  • Comparison Bar Chart
  • Pareto Chart
  • Funnel Chart
  • Gauge Chart
  • Radar Chart
  • Radial Bar Chart
  • Sunburst Chart
  • see more
  • Scatter Plot Chart
  • CSAT Survey Bar Chart
  • CSAT Survey Chart
  • Dot Plot Chart
  • Double Bar Graph
  • Matrix Chart
  • Multi Axis Line Chart
  • Overlapping Bar Chart
  • Control Chart
  • Slope Chart
  • Clustered Bar Chart
  • Clustered Column Chart
  • Box and Whisker Plot
  • Tornado Chart
  • Waterfall Chart
  • Word Cloud
  • see less

RESOURCES

  • Blog
  • Resources
  • YouTube
SIGN UP FOR UPDATES

We wouldn't dream of spamming you or selling your info.

© 2025 ChartExpo, all rights reserved.