Categories
Energy budgeting involves managing and planning energy consumption efficiently to reduce environmental impact and costs. It helps households and organizations allocate energy use, thereby promoting financial savings and sustainability over time.


This guide dives deep into what the Energy Budget is, the strategies to budget your energy, and how to perform energy budgeting. It also explains the importance of data storytelling in an energy flow diagram.
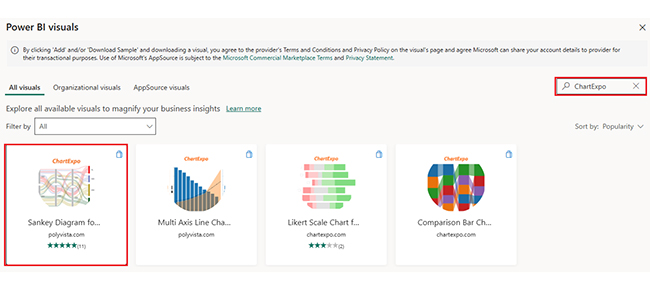
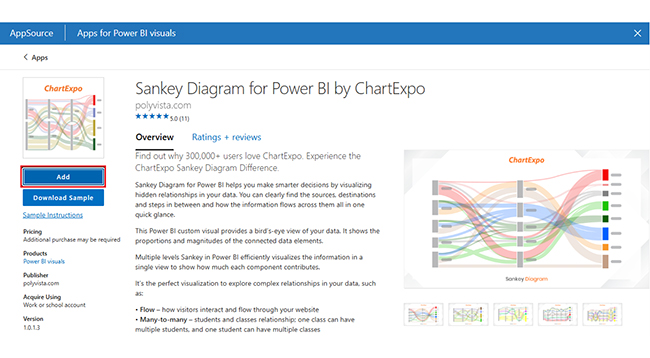
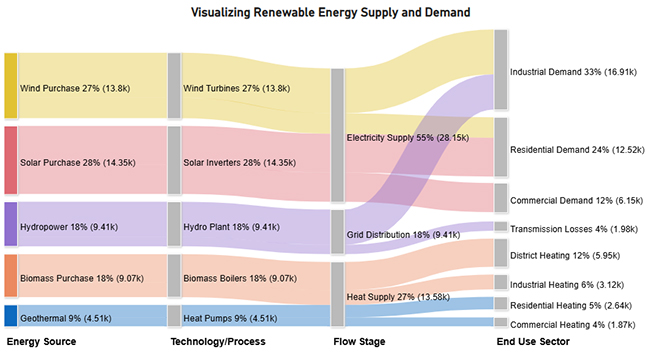
The role of visual analytics, like the Sankey Diagram and the renewable energy chart, in the data analytics and data visualization of energy budgeting will be discussed in this guide. You’ll also be shown some monthly budget examples and financial metrics to look out for when creating energy budgeting for your organization.
Definition: An energy budget is a plan that tracks and manages the amount of energy consumed against the energy available or produced. It helps in monitoring energy usage, identifying inefficiencies, and setting goals for conservation.
Energy budgets are used in businesses, homes, and environmental systems to ascertain efficient energy use, sustainability, and cost savings, especially within performance-based budgeting. An energy budget can also be seen as the balance between incoming solar energy and outgoing heat energy.
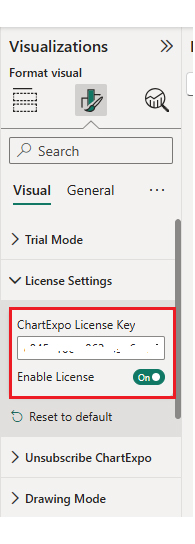
How to analyze your energy budgeting template in Power BI using tools like a Sankey diagram generator to visualize flows and uncover clearer insights.
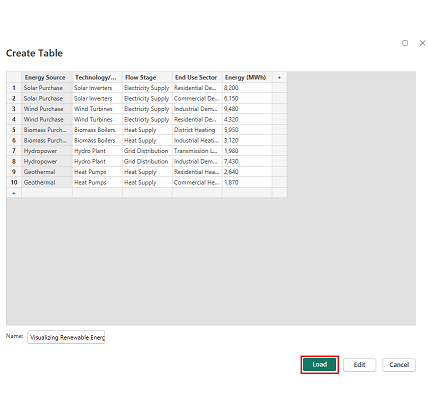
Example:
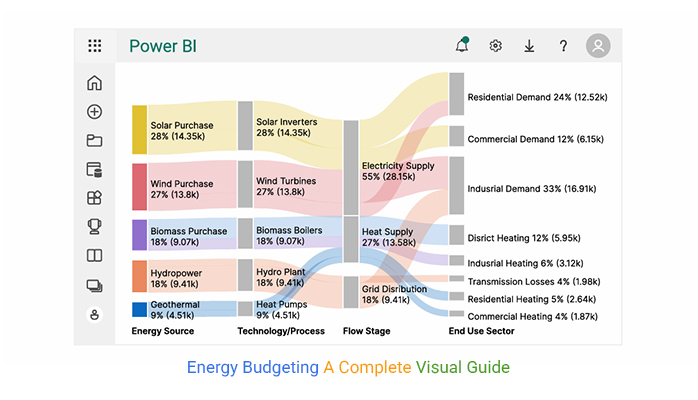
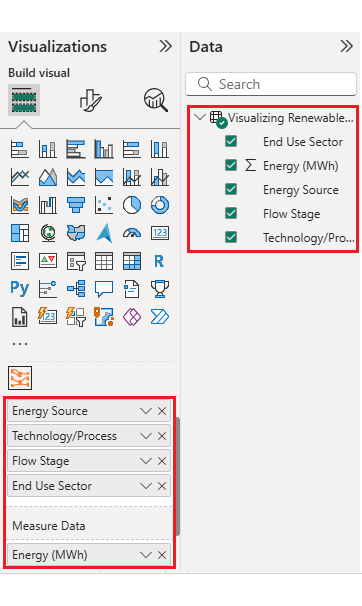
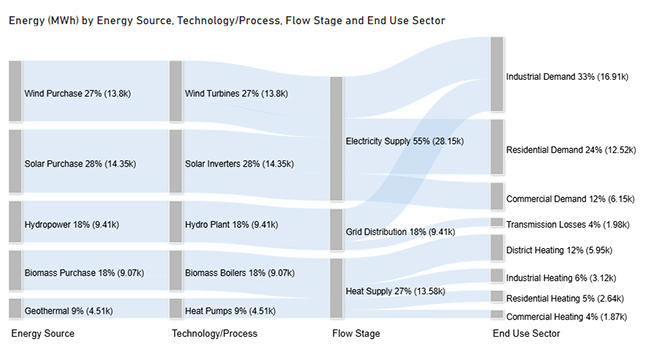
Consider we have the following data for an energy flow diagram.
| Energy Source | Technology/Process | Flow Stage | End Use Sector | Energy (MWh) |
| Solar Purchase | Solar Inverters | Electricity Supply | Residential Demand | 8,200 |
| Solar Purchase | Solar Inverters | Electricity Supply | Commercial Demand | 6,150 |
| Wind Purchase | Wind Turbines | Electricity Supply | Industrial Demand | 9,480 |
| Wind Purchase | Wind Turbines | Electricity Supply | Residential Demand | 4,320 |
| Biomass Purchase | Biomass Boilers | Heat Supply | District Heating | 5,950 |
| Biomass Purchase | Biomass Boilers | Heat Supply | Industrial Heating | 3,120 |
| Hydropower | Hydro Plant | Grid Distribution | Transmission Losses | 1,980 |
| Hydropower | Hydro Plant | Grid Distribution | Industrial Demand | 7,430 |
| Geothermal | Heat Pumps | Heat Supply | Residential Heating | 2,640 |
| Geothermal | Heat Pumps | Heat Supply | Commercial Heating | 1,870 |
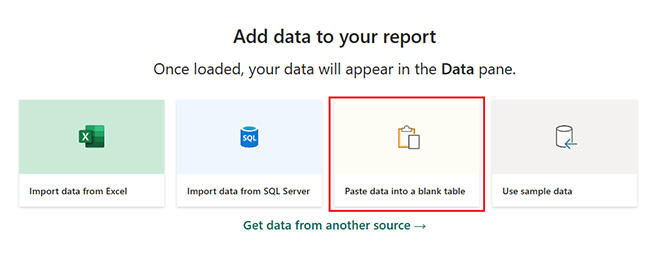
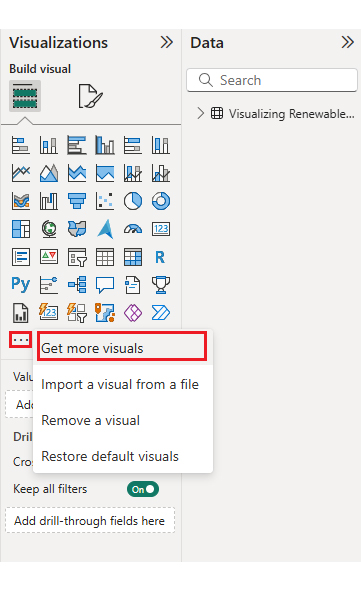
Chart Creation Steps in Power BI

You can budget your energy by tracking usage, setting monthly limits, adjusting habits, using energy-efficient appliances, and monitoring bills to stay within goals while reducing environmental impact and costs.
The energy budget rule refers to balancing energy output and input, and that ensures that the amount of energy consumed does not exceed the available (or allocated) energy for a specified period or activity.
The energy budget method involves tracking energy inputs (like fuel and electricity) and outputs (like production and consumption) to ascertain efficient use, control costs, and reduce waste. This helps promote sustainability and financial management.
An energy budget tracks energy usage versus availability to ascertain efficiency. Calculating budget electricity helps identify savings opportunities, manage costs, and promote sustainable energy consumption for environmental and financial benefits.
To properly perform energy budgeting, you’ll have to set energy goals and conduct periodic audits. Always establish clear and realistic energy-saving goals, like limiting peak-hour consumption or reducing usage by 10%.
Furthermore, you have to carry out regular facility or home energy audits to detect inefficiencies or leaks. These audits also help identify opportunities for further savings.
Finally, you have to review your energy bills monthly and compare them with your budget. If you’re exceeding the budget, reassess usage patterns and make adjustments.
Now that you know what the energy budget is, how will you use Power BI visualization tools to represent your facility’s energy budget?
How much did you enjoy this article?


Calculate accounts receivable turnover ratio to measure credit collection speed, improve cash flow, and strengthen your financial strategy. Read on!

Change Management KPIs are the key to tracking adoption, performance, and ROI during transitions. Find out which metrics matter. Read on!

Data collection methods and techniques determine the quality of every insight you act on. Explore key approaches for gathering reliable data. Read on!


