• Home
  • Tools dropdown img
    • Spreadsheet Charts

      • ChartExpo for Google Sheets
      • ChartExpo for Microsoft Excel
    • Power BI Charts

      • Power BI Custom Visuals by ChartExpo
    • Word Cloud

  • Charts dropdown img
    • Chart Category

      • Bar Charts
      • Circle Graphs
      • Column Charts
      • Combo Charts
      • Comparison Charts
      • Line Graphs
      • PPC Charts
      • Sentiment Analysis Charts
      • Survey Charts
    • Chart Type

      • Box and Whisker Plot
      • Clustered Bar Chart
      • Clustered Column Chart
      • Comparison Bar Chart
      • Control Chart
      • CSAT Survey Bar Chart
      • CSAT Survey Chart
      • Dot Plot Chart
      • Double Bar Graph
      • Funnel Chart
      • Gauge Chart
      • Likert Scale Chart
      • Matrix Chart
      • Multi Axis Line Chart
      • Overlapping Bar Chart
      • Pareto Chart
      • Radar Chart
      • Radial Bar Chart
      • Sankey Diagram
      • Scatter Plot Chart
      • Slope Chart
      • Sunburst Chart
      • Tornado Chart
      • Waterfall Chart
      • Word Cloud
    • Google Sheets
      Microsoft Excel
  • Services
  • Pricing
  • Contact us
  • Blog
  • Support dropdown img
      • Gallery
      • Videos
      • Contact us
      • FAQs
      • Resources
    • Please feel free to contact us

      atsupport@chartexpo.com

Categories
All Data Visualizations Data Analytics Surveys
Add-ons/
  • Google Sheets
  • Microsoft Excel
  • Power BI
All Data Visualizations Data Analytics Surveys
Add-ons
  • Google Sheets
  • Microsoft Excel
  • Power BI

We use cookies

This website uses cookies to provide better user experience and user's session management.
By continuing visiting this website you consent the use of these cookies.

Ok

ChartExpo Survey


Home > Blog > Data Analytics

Electricity Cost Comparison: Trends and Insights

Electricity cost comparison is not only about numbers; it’s about giving you the ability to make informed choices.

Electricity Cost Comparison

For what reason?

Imagine this: you get your monthly utility bill and see a notable rise in cost. If you don’t have a point of reference, you might end up agreeing to pay more. Yet, a simple electricity cost comparison may uncover overlooked possible savings.

Did you know? The average rate for household electricity in the U.S. is around 16.1 cents/kWh according to the US EIA. However, these rates can vary widely between states and even within different utility companies inside the same state. A variance that could be as high as 10 cents per kilowatt-hour.

The U.S. Energy Information Administration reports that residential electricity prices have been rising on average about 3% yearly over the last decade. In consequence, the ability to compare such costs is increasingly valuable.

Electricity cost comparison can add up to saving a lot. In all rights, money should not be trickled down to things where it could have been saved! Therefore, come and explore with us the significance of comparing electricity costs. We will investigate how this practice can significantly improve your financial health.

Table of Contents:

  1. Why Comparing Electricity Prices is Important?
  2. How to Compare Electricity Rates?
  3. Factors to Consider When Comparing Electricity Charges
  4. How to Evaluate Electricity Supplier Rates?
  5. Advantages of Electricity Cost Comparison
  6. Wrap Up

First…

Why Comparing Electricity Prices is Important?

Comparing electricity prices is a crucial practice for consumers and businesses alike. It ensures you get the best deal and make informed decisions that can impact your financial health and environmental footprint. Here are reasons why comparing electricity prices is important:

  • Cost savings: Comparing electricity prices helps identify the most cost-effective providers and plans. This can lead to significant savings on your monthly utility bills.
  • Budget planning: Understanding electricity costs helps in accurate budget planning. It allows households and businesses to allocate funds more efficiently and avoid unexpected expenses.
  • Tariff optimization: Comparing prices lets you choose the best tariff that suits your consumption pattern. Different plans offer various rates and benefits; selecting the right one can optimize your electricity expenditure.
  • Transparency and accountability: Comparing prices helps you better understand what you are being charged for. This transparency holds electricity providers accountable and ensures you are not overpaying.
  • Encourages competition: Regularly comparing electricity prices fosters a competitive market. This competition can lead to lower prices and improved services as providers strive to attract and retain customers.
  • Energy efficiency: Awareness of different pricing plans can encourage more energy-efficient behavior. Knowing that certain tariffs are more expensive at peak times can motivate you to shift usage to off-peak periods.
  • Regulatory compliance: Comparing electricity prices helps ensure providers comply with regulatory standards. It keeps you informed about market rates and enables you to avoid plans that may not meet legal or safety requirements.
  • Supports renewable energy adoption: By comparing and choosing providers offering renewable energy options, you support adopting sustainable practices. This benefits the environment and promotes the growth of green energy markets.

How to Compare Electricity Rates?

Comparing electricity rates involves a systematic approach to ensure you understand all aspects of available plans. Here are the steps to effectively compare electricity rates:

  1. Gather basic information: Start by collecting your recent electricity bills. Note your average monthly usage, peak usage times, and current rates. This information is crucial for making accurate comparisons.
  2. Identify available providers: Research and list all electricity providers available in your area. Local government websites or energy comparison platforms can help you identify these providers.
  3. Understand rate structures: Familiarize yourself with different rate structures, such as fixed rates, variable rates, and time-of-use rates. Understanding these will help you compare plans more effectively.
  4. Compare pricing plans: Look at the pricing plans offered by each provider. Pay attention to the per-kilowatt-hour (kWh) rate and any additional fees or charges that may apply.
  5. Consider contract terms: Review the contract terms for each plan. Note the contract length, early termination fees, and any clauses that might affect your decision.
  6. Factor in customer service and reputation: Research customer reviews and ratings for each provider. Good customer service and a solid reputation are important for long-term satisfaction.
  7. Calculate total cost: Use your gathered usage data to calculate the total cost for each plan. Include all charges, fees, and potential penalties for an accurate comparison.
  8. Evaluate additional benefits: Consider any benefits the providers offer, such as renewable energy options, loyalty rewards, or energy-saving programs.
  9. Compare total costs: Once you have all the details, compare each plan’s total costs and benefits side-by-side, as well as the cost of living comparison by city. This will help you identify the most cost-effective and beneficial option.
  10. Check regulatory disclosures: Ensure the providers comply with all regulatory requirements. This includes checking for any recent violations or legal issues affecting service reliability.
  11. Tools for Comparison: To simplify the process, use online comparison tools and websites. These tools can provide side-by-side comparisons and highlight key differences between plans.

Factors to Consider When Comparing Electricity Charges

When comparing electricity charges from different suppliers, evaluating various factors is essential. Why? To ensure you select the best option for your needs. These factors encompass a range of elements that affect overall value and service quality:

  • Pricing structure: Examine whether the rate is fixed, variable, or time-of-use. Fixed rates remain constant, variable rates can fluctuate, and time-of-use rates vary based on the day or season.
  • Contract terms: Review the length of the contract and any early termination fees. Understand the conditions under which you can switch providers or terminate the contract without incurring penalties.
  • Billing and payment options: Consider the flexibility of billing and payment options. Look for suppliers that offer convenient payment methods, such as:
    • Online payments
    • Autopay
    • Budget billing plans that spread costs evenly throughout the year
  • Customer service and reputation: Research each supplier’s customer service quality and reputation. Look for customer reviews, ratings, and reported issues. Good customer service is crucial for resolving issues promptly and effectively.
  • Renewable energy options: Check if the supplier offers renewable energy plans or green energy options. Supporting renewable energy can reduce your environmental impact and promote sustainability.
  • Regulatory compliance and transparency: Ensure the supplier complies with local regulations and maintains transparency in their pricing and terms. Regulatory compliance ensures reliability and protects you from unfair practices.
  • Value-added services: Evaluate additional services, such as energy-saving programs, home energy audits, or smart home integrations. These services can add value and help you manage energy consumption more effectively.
  • Total cost comparison: Calculate the total cost of each plan, including all fees, charges, and potential penalties. This will give you a clearer picture of the actual cost you will incur.
  • Contract flexibility: Assess the flexibility of the contract terms. Some suppliers may offer flexible terms, allowing you to adjust your plan or switch providers without heavy penalties.
  • Local availability and coverage: Confirm that the supplier has good coverage and availability in your area. Local suppliers may better understand regional needs and offer more tailored services.

How to Evaluate Electricity Supplier Rates?

Data analysis can be a labyrinth of numbers, a maze of spreadsheets, and a battleground of complex algorithms. In this digital age, evaluating electricity supplier rates requires more than crunching numbers. It demands the ability to bring data to life.

Data visualization plays a pivotal role in unraveling the intricacies of electricity supplier rates. It turns raw data into actionable insights that leap off the screen.

While Excel is a powerhouse for number-crunching, its data visualization limitations can frustrate analysts.

Enter ChartExpo the solution that unleashes the true potential of data visualization. It empowers you to see beyond the numbers, whether you’re using a Box and Whisker Plot or a Comparison Bar Chart and many other chart options to uncover the stories hidden within the data.

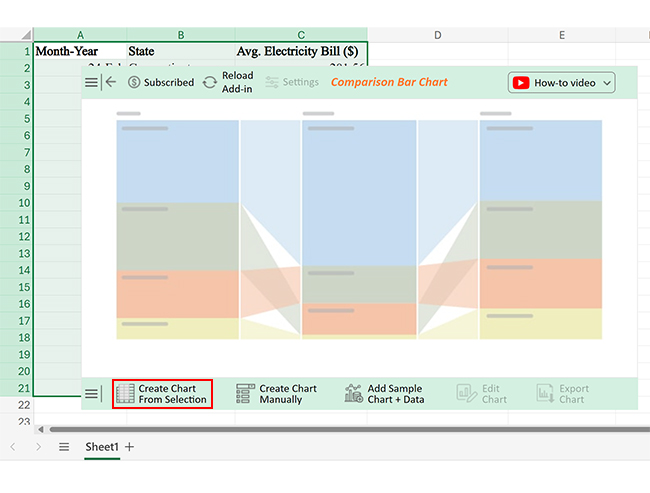
Let’s learn how to install ChartExpo in Excel.

  1. Open your Excel application.
  2. Open the worksheet and click the “Insert” menu.
  3. You’ll see the “My Apps” option.
  4. In the Office Add-ins window, click “Store” and search for ChartExpo on my Apps Store.
  5. Click the “Add” button to install ChartExpo in your Excel.

ChartExpo charts are available both in Google Sheets and Microsoft Excel. Please use the following CTAs to install the tool of your choice and create beautiful visualizations with a few clicks in your favorite tool.

Example

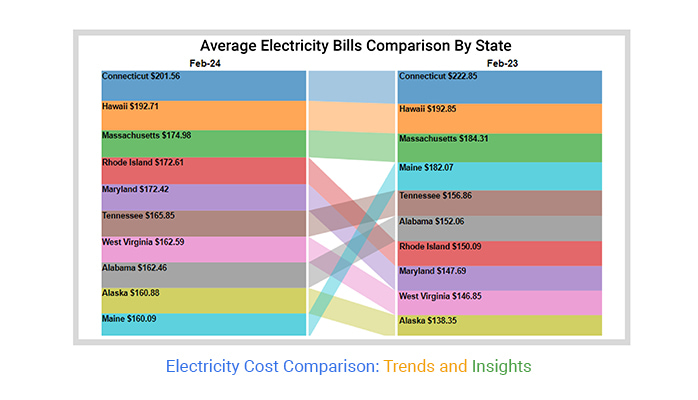
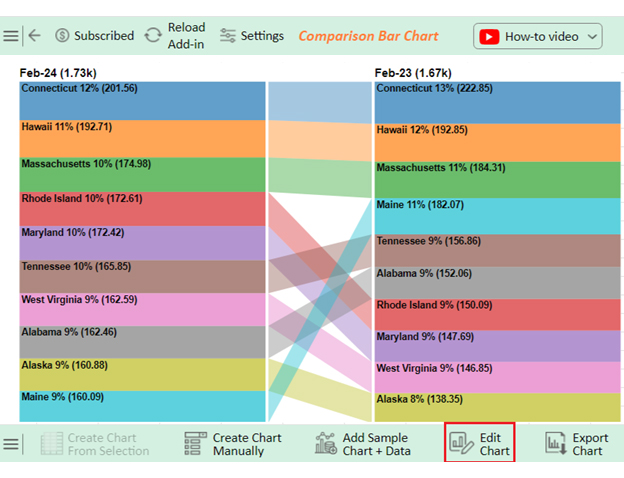
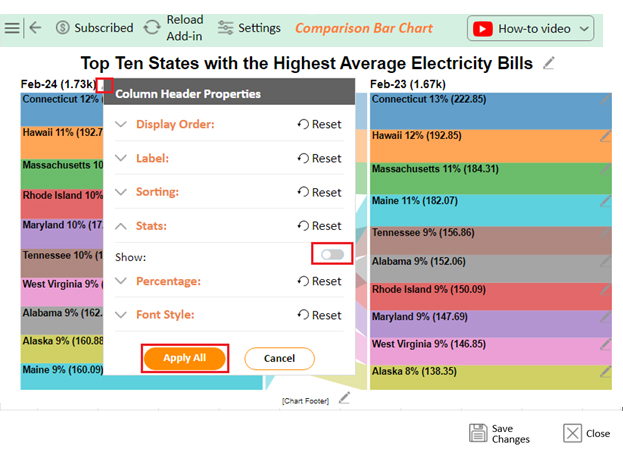
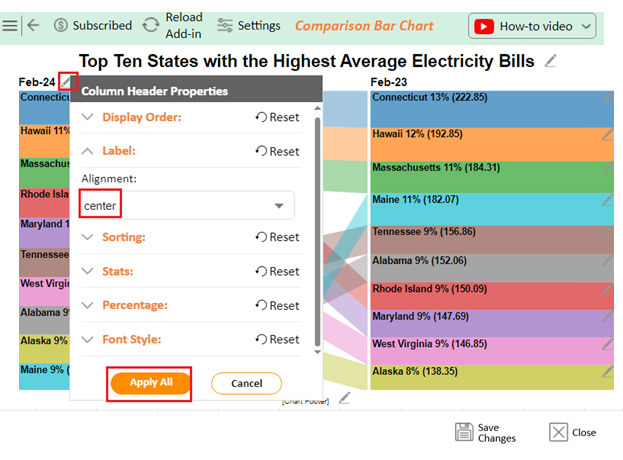
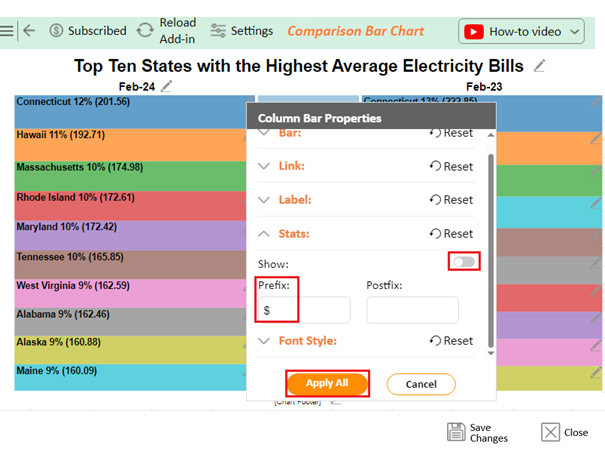
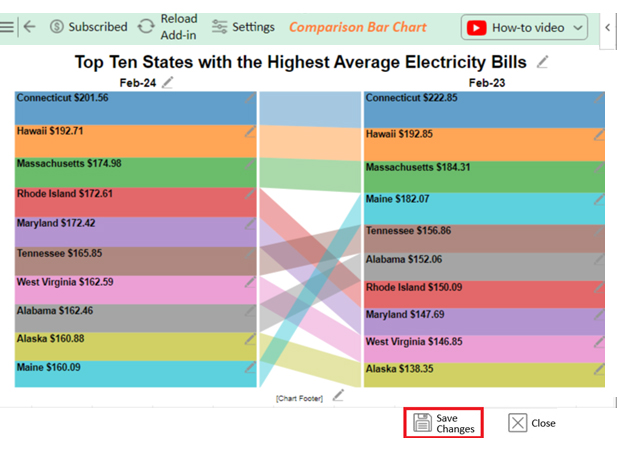
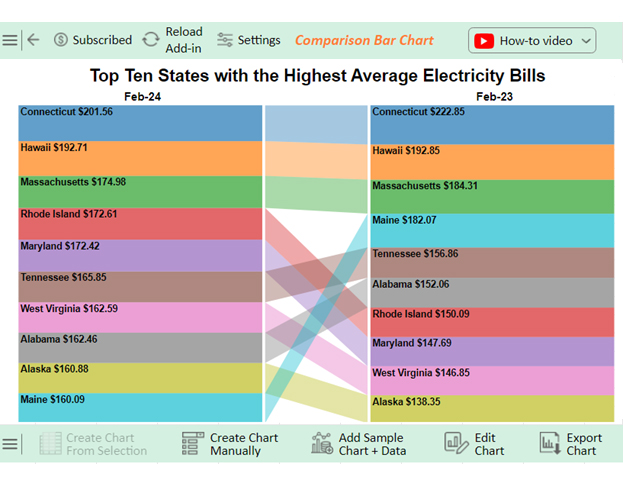
Let’s analyze the electricity cost comparison example data below using ChartExpo.

Month-Year State Avg. Electricity Bill ($)
Feb-24 Connecticut 201.56
Feb-23 Connecticut 222.85
Feb-24 Hawaii 192.71
Feb-23 Hawaii 192.85
Feb-24 Massachusetts 174.98
Feb-23 Massachusetts 184.31
Feb-24 Rhode Island 172.61
Feb-23 Rhode Island 150.09
Feb-24 Maryland 172.42
Feb-23 Maryland 147.69
Feb-24 Tennessee 165.85
Feb-23 Tennessee 156.86
Feb-24 West Virginia 162.59
Feb-23 West Virginia 146.85
Feb-24 Alabama 162.46
Feb-23 Alabama 152.06
Feb-24 Alaska 160.88
Feb-23 Alaska 138.35
Feb-24 Maine 160.09
Feb-23 Maine 182.07
  • To get started with ChartExpo, install ChartExpo in Excel.
  • Access My Apps under the INSERT menu.
insert chartexpo in excel
  • Choose ChartExpo and click the “Insert” button.
open chartexpo in excel
  • After ChartExpo loads, choose the “Comparison Bar Chart” from the chart list.
search comparison bar chart in excel
  • Select the data from the sheet, and click the “Create Chart From Selection” button.
Click Create Chart From Selection for Doing Electricity Cost Comparison
  • ChartExpo will create the visualization below for you.
Edit Chart for Doing Electricity Cost Comparison
  • If you want to have the chart’s title, click Edit Chart, as shown in the above image.
  • Click the pencil icon next to the Chart Header to change the title.
  • It will open the properties dialog. Under the Text section, you can add a heading in Line 1 and enable Show.
  • Give the appropriate title of your chart and click the Apply button.
Add Chart Header for Doing Electricity Cost Comparison
  • You can disable the stats by clicking on the small pencil icon as follows:
Disable Stats for Doing Electricity Cost Comparison
  • You can align into the center by clicking on the small pencil icon as follows:
Align Center for Doing Electricity Cost Comparison
  • You can add the dollar sign with values and disable the stats by clicking on the small pencil icon:
Add Prefix for Doing Electricity Cost Comparison
  • Click the “Save Changes” button to ensure the changes are permanent.
Save Changes for Doing Electricity Cost Comparison
  • Your final chart will then resemble the image below.
Final Electricity Cost Comparison

Insights

  • Connecticut’s average electricity bill dropped to $201.56 on Feb-24, down from $222.85 on Feb-23.
  • The cost of Hawaii’s bill stayed consistent at approximately $192.
  • The price of Massachusetts decreased to $174.98 from $184.31.
  • In Rhode Island, Maryland, Tennessee, West Virginia, Alabama, and Alaska, the prices rose to $172.61, $172.42, $165.85, $162.59, $162.46, and $160.88, in that order.
  • Maine’s price dropped to $160.09 from $182.07.

Advantages of Electricity Cost Comparison

Comparing electricity costs empowers you to make informed decisions about energy use and providers. Here are the key advantages of the electricity cost comparison method:

  • Transparent pricing: Comparing electricity costs promotes transparency by allowing consumers to see and understand the pricing structures of various providers. This clarity helps avoid hidden fees and unexpected charges, ensuring you know exactly what you are paying for.
  • Choice and flexibility: Electricity cost comparison provides a broader range of options. This means you can choose a plan that best suits your specific needs.
  • Improved value for money: By comparing different plans, you can find the best value for your money. This doesn’t always mean the lowest price but the best combination of cost, service quality, and additional benefits.
  • Optimization of energy usage: Knowing the details of different pricing plans can encourage more efficient energy use. For example, time-of-use plans can incentivize shifting energy consumption to cheaper off-peak times. This can lead to lower overall costs and more efficient energy use.
  • Enhanced consumer empowerment: The ability to compare and choose between multiple providers empowers consumers. It encourages active participation in the energy market, fostering a competitive environment that can lead to better services and pricing.

FAQs

Who has the highest electricity prices?

Countries like Germany and Denmark often have the highest electricity prices. Use the electricity cost comparison method to find current rates and determine which provider offers the best deal in your area. This ensures you get the best value.

Why does electricity cost different in different states?

Electricity costs vary due to regional fuel prices, energy supply and demand, state regulations, and infrastructure costs. Additionally, the availability of renewable energy sources and local weather conditions also influence electricity prices across different states.

How do we reduce the cost of electricity?

To reduce electricity costs:

  • Use energy-efficient appliances
  • Switch to LED lighting
  • Implement smart thermostats
  • Optimize usage during off-peak hours
  • Unplug devices when not in use
  • Consider renewable energy sources like solar panels for long-term savings

Wrap Up

Electricity cost comparison is crucial for both households and businesses. It ensures you get the best deal available. By comparing prices, you can significantly reduce your electricity expenses, leading to substantial savings over time.

Comparing electricity rates offers transparency. You gain a clear understanding of what you are paying for, which helps avoid hidden fees and unexpected charges. It also allows for more informed decision-making.

Moreover, the ability to compare gives you more choices. You can select a plan that best fits your needs. Whether you prefer fixed rates for stability or variable rates for flexibility, comparison gives you options. This flexibility is beneficial for managing your budget effectively.

Cost comparison encourages better value for money. You can evaluate the price, service quality, and additional benefits. This means you can find a plan that offers the best overall value, not just the lowest price. This holistic view helps in choosing the most beneficial plan.

Another advantage is optimizing energy usage. Knowing the details of various pricing plans can encourage more efficient energy consumption. For example, you might shift usage to off-peak hours if it saves money. This can lead to both financial savings and energy efficiency.

Lastly, electricity cost comparison enhances consumer empowerment. It allows you to take control of your energy expenses. By actively participating in the energy market, you foster competition among providers, which can result in better services and pricing.

In conclusion, comparing electricity costs is essential. It provides transparency, more choices, better value for money, and optimized energy usage. It empowers consumers and fosters competition. Overall, it is vital for managing and effectively reducing electricity expenses.

How much did you enjoy this article?

PBIAd1
Start Free Trial!
135938

Related articles

next previous
Data Analytics31 min read

Data Analysis Without Nonsense: Fix the Right Problem, Fast

Data analysis can mislead when metrics look right but outcomes fail. Learn how to spot red flags, fix failures, and make better decisions. Read on!

Data Analytics29 min read

Variance Analysis Isn’t a Math Problem, It’s a Trust Problem

Variance analysis helps identify what went wrong, who owns it, and what to do next. Use it to drive decisions, not just reports. Learn more!

Data Analytics10 min read

Supplier Comparison Template: Download It Now

A supplier comparison template streamlines vendor evaluation by comparing cost and quality. Click here to learn its benefits and how to analyze them.

Data Analytics32 min read

Ecommerce Analytics: How to Fix What It Often Gets Wrong

Ecommerce analytics often lead to mixed signals and costly misreads. Fix attribution gaps, align teams, and act on the right data. Get started now!

Data Analytics30 min read

When Sales Funnel Breaks: Failures, Fixes, & Funnel Debt

Is your sales funnel hiding costly gaps? Learn how pipeline stalls, false metrics, and handoff chaos could be draining revenue. Get started now!

ChartExpo logo

Turn Data into Visual
Stories

CHARTEXPO

  • Home
  • Gallery
  • Videos
  • Services
  • Pricing
  • Contact us
  • FAQs
  • Privacy policy
  • Terms of Service
  • Sitemap

TOOLS

  • ChartExpo for Google Sheets
  • ChartExpo for Microsoft Excel
  • Power BI Custom Visuals by ChartExpo
  • Word Cloud

CATEGORIES

  • Bar Charts
  • Circle Graphs
  • Column Charts
  • Combo Charts
  • Comparison Charts
  • Line Graphs
  • PPC Charts
  • Sentiment Analysis Charts
  • Survey Charts

TOP CHARTS

  • Sankey Diagram
  • Likert Scale Chart
  • Comparison Bar Chart
  • Pareto Chart
  • Funnel Chart
  • Gauge Chart
  • Radar Chart
  • Radial Bar Chart
  • Sunburst Chart
  • see more
  • Scatter Plot Chart
  • CSAT Survey Bar Chart
  • CSAT Survey Chart
  • Dot Plot Chart
  • Double Bar Graph
  • Matrix Chart
  • Multi Axis Line Chart
  • Overlapping Bar Chart
  • Control Chart
  • Slope Chart
  • Clustered Bar Chart
  • Clustered Column Chart
  • Box and Whisker Plot
  • Tornado Chart
  • Waterfall Chart
  • Word Cloud
  • see less

RESOURCES

  • Blog
  • Resources
  • YouTube
SIGN UP FOR UPDATES

We wouldn't dream of spamming you or selling your info.

© 2025 ChartExpo, all rights reserved.