Categories
Understanding relationships between two variables doesn’t have to be complicated. The right visualization instantly reveals trends, patterns, and correlations that are hard to spot in raw data.
A line graph can compare two related datasets in a single view, making analysis focused and easy to understand.
With so many chart options available, choosing the wrong one can make your data confusing instead of insightful. That’s why selecting the right chart is critical for effective data visualization.

A line graph is one of the most effective ways to compare two variables over time in a single, clear view. Instead of using multiple charts, it helps you present related data together, making your analysis more focused and easier to understand.
In this guide, you’ll learn how to create a double line graph and use it to compare trends, track performance, and present data more effectively.
Definition: A double line graph (or dual-line chart) displays two data series on the same axes, making it easy to compare trends and relationships over time. It simplifies complex datasets, saving space while improving clarity, and is ideal for dashboards comparing metrics like sales vs. profit or traffic vs. conversions.
It is especially useful when you want to analyze how two variables move together or differ across the same period. By placing both lines in a single view, you can quickly identify patterns, correlations, and changes in direction.
A double line graph is used to compare two related datasets in a single view, making it easier to identify trends, patterns, and relationships over time. Instead of analyzing separate charts, you can use a double line graph or an x and y axis chart to see how both variables behave side by side.
Here are three examples:
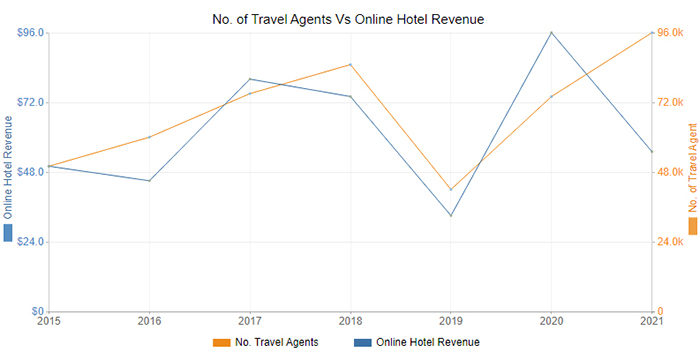
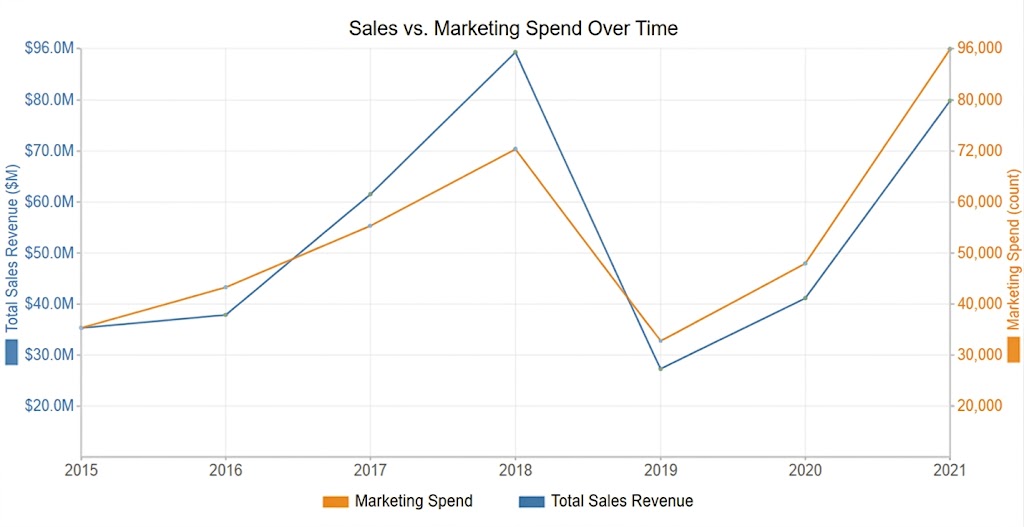
A company can track monthly sales revenue alongside marketing expenses to see how investment in campaigns correlates with sales performance. This helps identify trends and optimize marketing budgets.
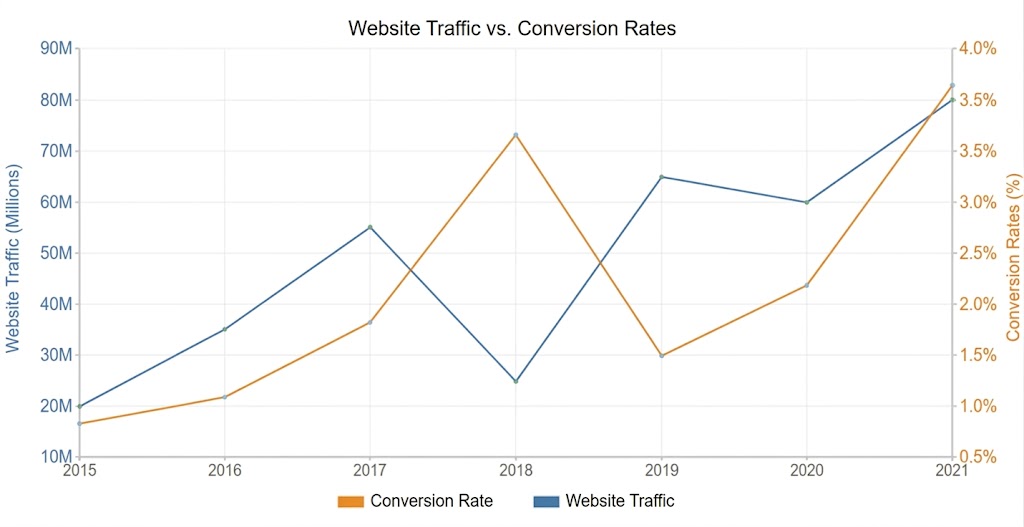
Digital marketers can compare website visits with conversion rates over weeks or months. A two-line graph quickly highlights if higher traffic is translating into more leads or sales.
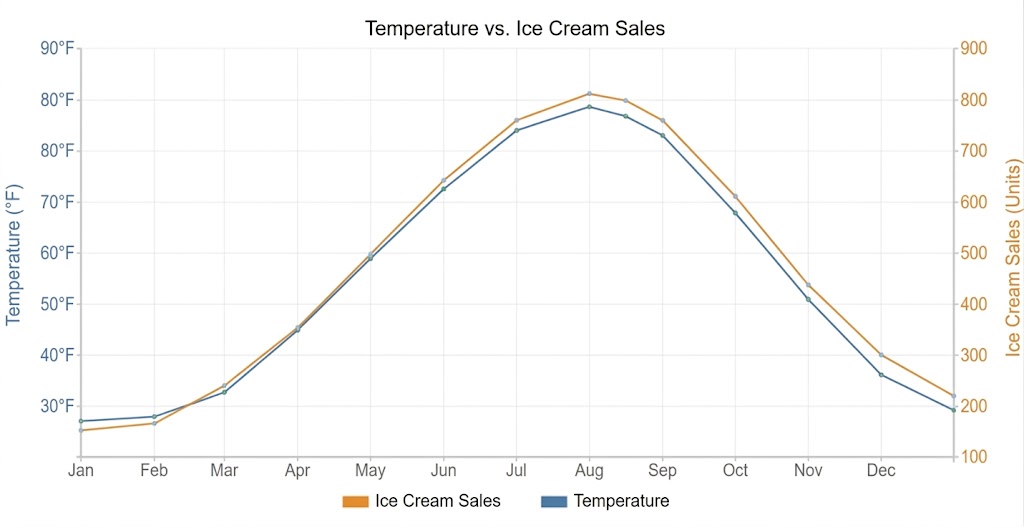
For a retail or seasonal business, comparing daily temperature with ice cream sales shows how weather impacts demand. Patterns and correlations are easily visible, aiding inventory planning.
Follow these 6 simple steps to create a clear and effective double-line graph:
Organize your dataset into three columns: one for the time period (X-axis) and two for the variables you want to compare (Y-axis). Make sure the data is accurate, clean, and consistent.
Assign the horizontal axis to the time period (e.g., months, years) and the vertical axis to numerical values. Use a consistent scale to ensure an accurate comparison.
Select your dataset, go to the Insert tab in Google Sheets, and choose a 2D line chart. Both data series will be plotted automatically.
Use distinct colors or line styles for each variable so users can easily identify and compare them.
Include a clear title, axis labels, and a legend to explain what each line represents. Proper labeling improves readability and interpretation.
Adjust line thickness, markers, and gridlines to make the chart visually clean and easy to read. For advanced or ready-made double-line charts, you can enhance your visuals using a tool like ChartExpo.

Here’s how to read it effectively:
Start by identifying what each axis represents. The horizontal axis usually shows time (e.g., days, months, years), while the vertical axis represents the values being measured.
Look at the legend to understand what each line represents. Different colors or styles help distinguish between the two variables.
Observe how each line moves across the graph. Look for upward or downward trends, fluctuations, or stable periods in the data.
Examine how the lines relate to each other. Do they move in the same direction, cross each other, or show opposite trends? This helps reveal relationships between variables.
Identify peaks, dips, and points where the lines intersect. These moments often highlight significant changes or events in the data.
Use your observations to understand what the data means. For example, you can determine whether two variables are correlated, identify performance gaps, or uncover patterns over time.
| Feature / Aspect | Double Line Graph | Single Line Graph |
| Definition | Displays two data series on the same chart for comparison | Displays one data series to show a single trend |
| Purpose | Compare two variables over time | Track changes in one variable over time |
| Data Series | Two lines representing different datasets | One line representing a single dataset |
| Insights | Shows relationships, similarities, or differences between variables | Focuses on trend analysis of one variable |
| Complexity | Slightly more complex but more informative | Simple and easy to read |
| Best Use Case | Comparing metrics like sales vs profit, traffic vs conversions | Tracking one metric like revenue growth or website visits |
| Visualization Clarity | Requires clear labeling to avoid confusion | Very clear due to a single line |
| Space Efficiency | Combines two datasets into one chart | May require multiple charts for comparison |
Use them in these situations:
When you need to analyze how two variables interact, such as sales vs. profit, revenue vs. expenses, or website traffic vs. conversions.
To observe trends, patterns, and changes in both variables across days, months, or years.
When your goal is to determine whether two metrics move together, independently, or in opposite directions.
When you want to present two datasets in a single chart to save space without losing clarity.
Useful for spotting peaks, dips, or intersections between the two lines, which can indicate important events or shifts in trends, especially when supported by quick visuals like a sparkline in Excel for instant pattern recognition.
Keep these common pitfalls in mind:
Avoid including more than two lines. Adding extra lines makes the chart cluttered and harder to interpret. For multiple variables, consider other chart types or separate visuals.
Ensure both variables use the same scale or a clearly labeled secondary axis. Inconsistent scales can mislead users and distort comparisons.
Don’t use colors that are too similar or hard to distinguish. Clear, contrasting colors make it easier to tell the lines apart.
Avoid unnecessary gridlines, markers, or labels. Keep the chart clean and focused on the two key data series.
Always provide context for the data. Failing to explain time periods, units, or events can make trends hard to understand.
Here are the top five advantages:
You can quickly see how two metrics relate, move together, or diverge over time, making trends and patterns easy to identify.
Instead of using two separate charts, a double line graph combines both datasets in a single visual, keeping dashboards clean and concise.
Displaying both lines together helps uncover correlations, inverse trends, or independent behaviors between variables.
Ideal for monitoring changes, growth, or declines in both metrics across time periods, enabling better forecasting and planning.
Highlighting patterns, anomalies, or key intersections, it provides actionable insights for business, marketing, or operational decisions.
This graph is useful for comparing two sets, but certain mistakes can make them confusing or misleading. Avoid these common errors:
A double line graph should focus on only two variables. Adding more lines clutters the chart and reduces clarity.
Using inconsistent or unclear scales can misrepresent data relationships. Always label axes clearly and consider a secondary axis if needed.
Lines that are too similar in color or style can confuse viewers. Use contrasting colors and clear markers to differentiate the two datasets.
Avoid excessive gridlines, labels, or decorative elements. Keep the chart simple and focused on the key data.
Not labeling axes, omitting a legend, or skipping data sources makes interpretation difficult. Always include context for clarity.
A double-line graph compares two variables in a single chart, ideal for spotting correlations. Multi-line graphs display three or more datasets, which can reveal complex patterns but may become cluttered.
Yes, Excel allows you to create double-line graphs using 2D line charts. Simply plot two data series and customize axes, colors, and labels for clarity.
Double axes are ideal when the two variables have different scales or units. This ensures each dataset is clearly represented without distorting the relationship between them.
Visualizing insights from two variables doesn’t have to be complicated. While many chart options exist, using the wrong one can make your data harder to understand. For comparing two metrics effectively, this type of line chart is the ideal solution.
It saves space and keeps your dashboard clean, performing the work that might otherwise require two separate visuals.
If you want ready-made options beyond Spreadsheet’s standard charts, consider using third-party tools. ChartExpo is an add-in you can easily integrate into Google Sheets to access pre-built, visually appealing double line graphs. It requires no coding or advanced technical skills, making it simple to create clear, insightful visualizations.
With the right approach, creating this chart doesn’t have to be a challenge. By following the steps in this guide, you can turn raw data into actionable insights and make your dashboards more effective.
Sign up for a 7-day free trial today to explore ready-to-use charts and elevate your data storytelling.
How much did you enjoy this article?


Calculate accounts receivable turnover ratio to measure credit collection speed, improve cash flow, and strengthen your financial strategy. Read on!

Change Management KPIs are the key to tracking adoption, performance, and ROI during transitions. Find out which metrics matter. Read on!

Data collection methods and techniques determine the quality of every insight you act on. Explore key approaches for gathering reliable data. Read on!


