

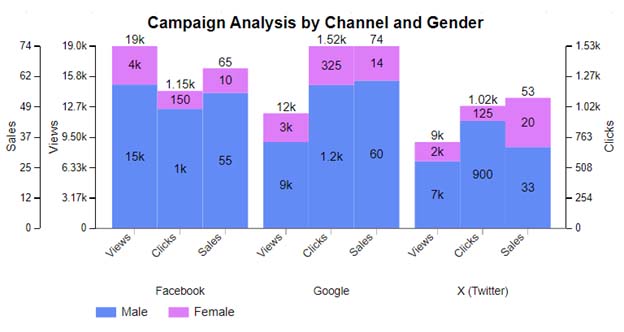
Here are the top 10 Google Sheets charts created in a spreadsheet using ChartExpo.
Categories
What is the difference between a database and a spreadsheet? Both manage data, but their roles are vastly different. Spreadsheets handle small datasets effectively, while databases precisely manage large volumes of information. Knowing which to choose depends on your needs, goals, and approaches for analyzing and interpreting data.
Spreadsheets are versatile and user-friendly. Tools like Excel and Google Sheets let you organize, calculate, and visualize data. They’re ideal for smaller projects or individual tasks. However, as data grows, spreadsheets become harder to manage and prone to errors. This limits their effectiveness for complex business scenarios or other functions like healthcare analytics.


Databases, on the other hand, excel in handling complexity. They store vast amounts of data efficiently, allowing multiple users to work simultaneously. With structured query languages (SQL) and advanced features, databases are critical for tasks requiring precision and scalability. Their role in enabling data discovery for businesses highlights their importance.
This blog post explores the advantages and limitations of each. Let’s help you make informed decisions to streamline your data management.
First…
Definition: A database and a spreadsheet are tools for managing data. A database stores large amounts of structured data, allowing efficient retrieval and updates. It organizes information using tables, queries, and relationships, making it essential for data-driven decision-making in businesses and organizations.
A spreadsheet, like Excel or Google Sheets, is a grid-based tool for organizing, calculating, and visualizing smaller datasets. It’s user-friendly and ideal for budgeting or data analysis, offering a straightforward approach for individual or small-scale projects.
The key difference lies in scale and complexity. Databases efficiently handle vast amounts of data and multiple users, supporting seamless collaboration and complex operations. On the other hand, spreadsheets work best for individual tasks and simpler data management. Each serves unique purposes based on needs, providing flexibility for diverse scenarios.
Spreadsheet simplicity and accessibility make them a favorite tool for individuals and small teams, especially in business analytics. While databases are powerful, they can be complex and overwhelming for smaller tasks. Spreadsheets provide a straightforward alternative, enabling quick setup and faster results, making them ideal for day-to-day business analytics needs.
Here’s a table showing the similarities between databases and spreadsheets based on various features:
| Feature | Database | Spreadsheet |
| Data Storage | Stores large volumes of data efficiently. | Stores data in rows and columns for easy access. |
| Data Organization | Organizes data into tables and fields. | Organizes data in grids with rows and columns. |
| Data Entry | Allows data to be inputted into structured tables. | Allows manual input of data into cells. |
| Data Sorting | Allows sorting by different fields. | Sorts data in ascending or descending order. |
| Formulas and Functions | Supports complex calculations using SQL queries. | Supports formulas for calculations (e.g., SUM, AVERAGE). |
| Data Filtering | Allows filtering based on conditions. | Filters data based on user-defined criteria. |
| Multi-User Access | Multiple users can access and modify data simultaneously. | Collaboration is possible in cloud-based spreadsheets (e.g., Google Sheets). |
| Data Visualization | Uses tools to visualize data with charts and graphs. | Built-in charts and graphs to visualize data. |
| Portability | Accessible remotely in certain systems. | Easy to save and share, especially in cloud formats. |
| Data Integrity | Ensures consistency with relational data models. | Maintains integrity with built-in checks (e.g., data validation). |
Here is a comparison of databases and spreadsheets based on various features:
| Feature | Database | Spreadsheet |
| Purpose | Designed for storing, managing, and retrieving large amounts of structured data. | Used for organizing and calculating smaller datasets, often for individual or team use. |
| Data Structure | Relational or non-relational structure with tables, rows, and columns. | Grid-based structure with cells organized in rows and columns. |
| Data Volume | Handles large-scale datasets efficiently. | Best suited for smaller datasets; performance slows with larger volumes. |
| Complexity | Supports complex queries, indexing, and transactions. | Limited to basic formulas and calculations, with fewer advanced functions. |
| Data Integrity | Enforces constraints, validations, and relationships to maintain data consistency. | Limited data validation and lack of built-in mechanisms for enforcing integrity. |
| Data Storage | Stores data in a centralized and scalable manner, often on a server. | Stores data locally in files or cloud-based file storage systems. |
| Concurrency | Allows multiple users to access and modify data simultaneously. | Limited concurrent access; changes can cause conflicts or require merging. |
| Data Relationships | Supports relationships between tables using keys (e.g., primary and foreign). | Lacks inherent support for relationships; relies on manual linking or references. |
| Data Analysis | Advanced analytics, reporting, and querying tools like SQL. | Basic analytics are done through formulas and charts; analysis has limited scalability. |
| Cost | Involve costs for software, licenses, and maintenance. | Affordable or free for basic use (e.g., Excel or Google Sheets). |
| Automation and Security | Offers robust automation (e.g., triggers, stored procedures) and strong security features. | Offers limited automation with macros and basic security options like passwords. |
| Visualization | Requires integration with external tools for advanced visualization. | Built-in basic visualization tools (e.g., charts, graphs). |
Are you stuck between a database and a spreadsheet? Let’s break it down to help you decide.
What is a database vs. spreadsheet? Both are powerful tools for managing data, but they serve different purposes. Spreadsheets like Excel shine for simple tasks, while databases manage complex data. Yet, when it comes to data visualization, Google Sheets has limitations. Creating advanced visuals feels clunky and time-consuming.
That’s where ChartExpo steps in. This intuitive tool transforms raw data into stunning visuals with ease, including a Scatter plot in Google Sheets. It bridges the gap, turning Google Sheets into a data analysis and storytelling powerhouse while inspiring creative graph design ideas.

Let’s learn how to install ChartExpo in Google Sheets.
ChartExpo charts are available both in Google Sheets and Microsoft Excel. Please use the following CTAs to install the tool of your choice and create beautiful visualizations in a few clicks in your favorite tool.
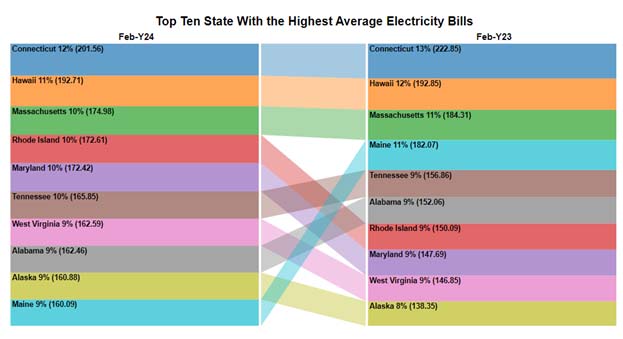
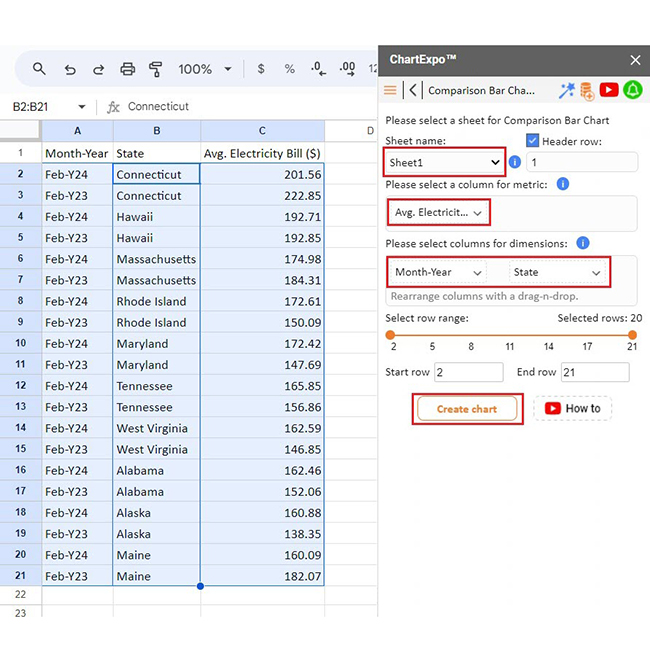
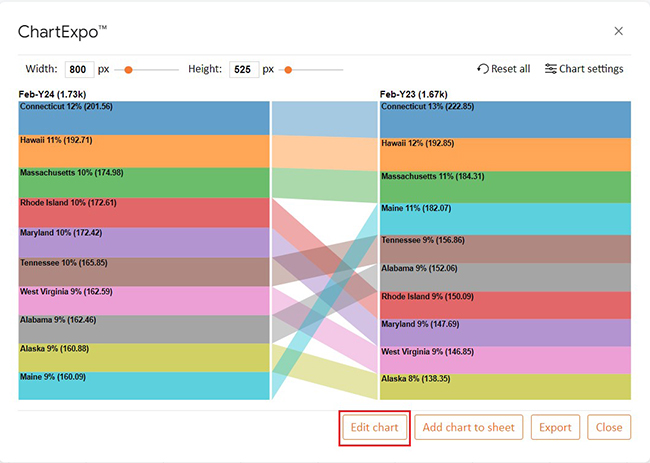
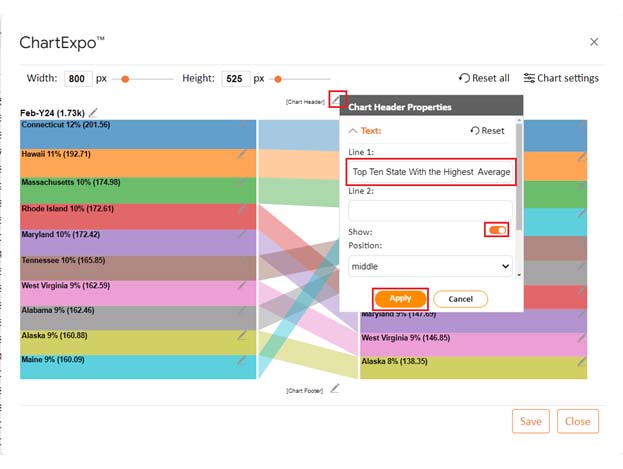
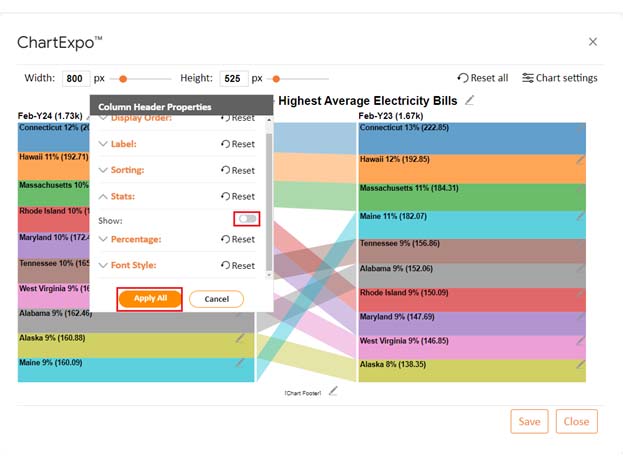
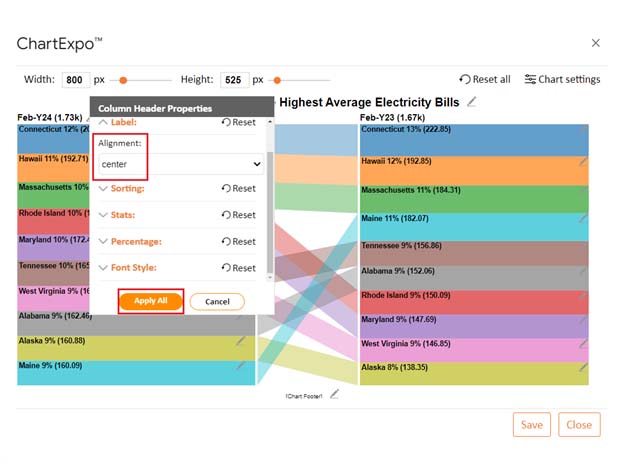
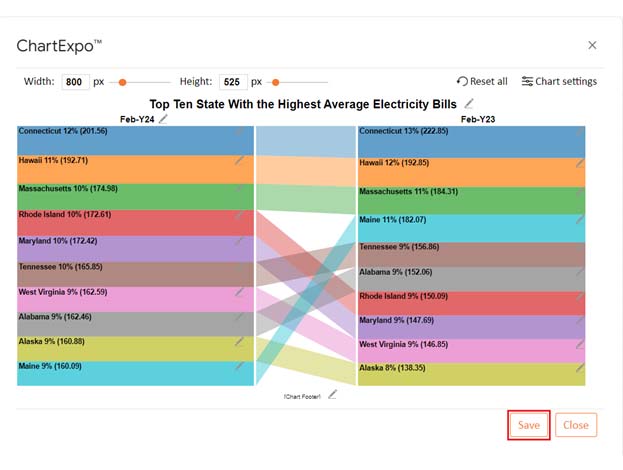
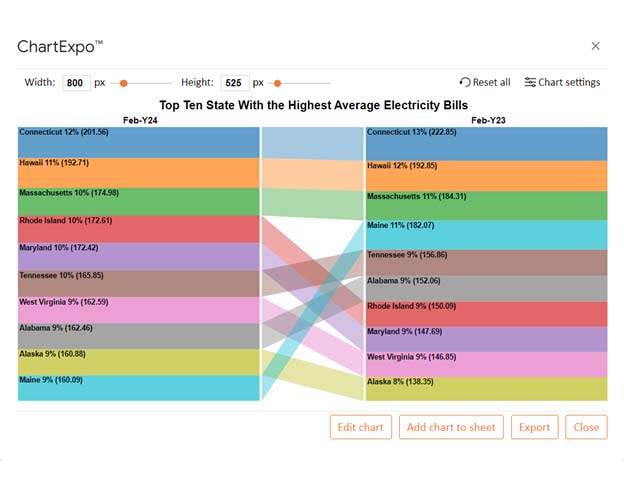
Let’s create a chart from the data below and glean valuable insights using ChartExpo.
| Month-Year | State | Avg. Electricity Bill ($) |
| Feb-Y24 | Connecticut | 201.56 |
| Feb-Y23 | Connecticut | 222.85 |
| Feb-Y24 | Hawaii | 192.71 |
| Feb-Y23 | Hawaii | 192.85 |
| Feb-Y24 | Massachusetts | 174.98 |
| Feb-Y23 | Massachusetts | 184.31 |
| Feb-Y24 | Rhode Island | 172.61 |
| Feb-Y23 | Rhode Island | 150.09 |
| Feb-Y24 | Maryland | 172.42 |
| Feb-Y23 | Maryland | 147.69 |
| Feb-Y24 | Tennessee | 165.85 |
| Feb-Y23 | Tennessee | 156.86 |
| Feb-Y24 | West Virginia | 162.59 |
| Feb-Y23 | West Virginia | 146.85 |
| Feb-Y24 | Alabama | 162.46 |
| Feb-Y23 | Alabama | 152.06 |
| Feb-Y24 | Alaska | 160.88 |
| Feb-Y23 | Alaska | 138.35 |
| Feb-Y24 | Maine | 160.09 |
| Feb-Y23 | Maine | 182.07 |


Databases are the superheroes of data management. They’re built to handle big jobs, stay consistent, and keep everyone on the same page. Here’s why they’re so powerful:
Databases are incredible tools, but they’re not perfect. Let’s talk about a few drawbacks.
Spreadsheets are the everyday heroes of data management. They’re simple, versatile, and ready to tackle various tasks. Let’s see why they’re a favorite for many:
Spreadsheets are handy, but they have their limits. Let’s explore where they fall short.
Spreadsheets are the go-to tool when you need something quick, easy, and effective. They bring a lot to the table without the complexity of databases. Here’s why they shine:
Use a database when handling big data, complex relationships, or needing strong security. It’s best for real-time access, many users, and when accuracy is key. Databases work well for long-term storage and advanced data analysis.
A spreadsheet is not a database but can mimic some functions. It stores data in grids and handles simple tasks. However, it lacks the structure, scalability, and advanced features of true databases for managing complex datasets.
A spreadsheet works best for a budget. It’s simple, easy to use, and great for tracking expenses or income. Use a database only if the budget is huge, involves many users, or requires detailed reporting and security.
Databases and spreadsheets are essential tools in data management. Both serve unique purposes, yet they often overlap in functionality. Understanding their differences helps you choose the right tool for your needs.
Spreadsheets are perfect for small-scale tasks. They are user-friendly, portable, and ideal for quick calculations. They offer basic data visualization with built-in formulas and types of charts and graphs. However, they struggle with handling large datasets efficiently.
Databases excel in managing complex and vast data. They support multi-user access, ensure data integrity, and provide advanced query options. Unlike spreadsheets, they are designed for scalability and structured data.
AI for data analytics is revolutionizing how we manage and interpret data. Integrating artificial intelligence, databases, and spreadsheets can automate processes, uncover patterns, and provide deeper insights.
Choosing between a database and a spreadsheet depends on the task. Spreadsheets suit individual projects, while databases cater to organizational needs. When deciding, consider data size, collaboration, and required analysis.
Visual analytics plays a crucial role in data interpretation. While Excel and Google Sheets offer basic tools, they fall short of advanced visual needs. Tools like ChartExpo enhance visual analytics, making spreadsheets more effective.
In today’s data-driven environment, using the right tool is vital. Combining spreadsheets’ simplicity with databases’ power can optimize efficiency. Leverage their strengths to organize, analyze, and visualize data effectively.
How much did you enjoy this article?


SUMPRODUCT in Google Sheets handles multi-condition calculations without extra columns. Master its syntax, uses, and errors. Read on!

An annual budget template in Google Sheets organizes your yearly finances, tracks every dollar, and reveals spending patterns. Read on!

Learn the best graph to show profit and loss with practical examples and use cases. Discover how to visualize your business data, track trends, and make smarter financial decisions.


