• Home
  • Tools dropdown img
    • Spreadsheet Charts

      • ChartExpo for Google Sheets
      • ChartExpo for Microsoft Excel
    • Power BI Charts

      • Power BI Custom Visuals by ChartExpo
    • Word Cloud

  • Charts dropdown img
    • Chart Category

      • Bar Charts
      • Circle Graphs
      • Column Charts
      • Combo Charts
      • Comparison Charts
      • Line Graphs
      • PPC Charts
      • Sentiment Analysis Charts
      • Survey Charts
    • Chart Type

      • Box and Whisker Plot
      • Clustered Bar Chart
      • Clustered Column Chart
      • Comparison Bar Chart
      • Control Chart
      • CSAT Survey Bar Chart
      • CSAT Survey Chart
      • Dot Plot Chart
      • Double Bar Graph
      • Funnel Chart
      • Gauge Chart
      • Likert Scale Chart
      • Matrix Chart
      • Multi Axis Line Chart
      • Overlapping Bar Chart
      • Pareto Chart
      • Radar Chart
      • Radial Bar Chart
      • Sankey Diagram
      • Scatter Plot Chart
      • Slope Chart
      • Sunburst Chart
      • Tornado Chart
      • Waterfall Chart
      • Word Cloud
    • Google Sheets
      Microsoft Excel
  • Services
  • Pricing
  • Contact us
  • Blog
  • Support dropdown img
      • Gallery
      • Videos
      • Contact us
      • FAQs
      • Resources
    • Please feel free to contact us

      atsupport@chartexpo.com

Categories
All Data Visualizations Data Analytics Surveys
Add-ons/
  • Google Sheets
  • Microsoft Excel
  • Power BI
All Data Visualizations Data Analytics Surveys
Add-ons
  • Google Sheets
  • Microsoft Excel
  • Power BI

We use cookies

This website uses cookies to provide better user experience and user's session management.
By continuing visiting this website you consent the use of these cookies.

Ok

ChartExpo Survey


Home > Blog > Data Analytics

Cost Performance Index Examples for Unraveling Efficiency

In the high-stakes world of project management, keeping a tight grip on the purse strings is essential. After all, no one wants to sweat explaining to the bigwigs why a project exceeded budget.

Cost Performance Index Example

This is where the Cost Performance Index (CPI) takes center stage. It is like a trusty financial sidekick, helping you analyze project financials and keep those costs in check.

Let’s put this Cost Performance Index Example concept into perspective.

Imagine you’re managing a construction project, and your CPI is 0.8.

Sounds impressive, right?

But hold your hat because it means you’re over budget. The earned value (the value of work performed) is 80% of the cost incurred. Thus, the project is spending more resources than initially budgeted. On the flip side, a CPI of 1.2 would mean you’re under budget, making every dollar count.

Don’t worry if you don’t understand these figures. This blog will take you through a cost performance index example, explaining every nitty gritty of this concept.

Table of Content:

  1. What is the Cost Performance Index (CPI)?
  2. What Does the CPI Mean?
  3. Why is CPI Important?
  4. What is the Purpose of a Cost Performance Index (CPI)?
  5. What Does a CPI of 1, Less than 1, and Greater than 1 Mean?
  6. How To Calculate Cost Performance Index?
  7. Formula For Cost Performance Index (CPI)
  8. What Does the Cost Performance Index Measure?
  9. Cost Performance Index Example
    1. Over Budget Project
    2. On Budget Project
    3. Under Budget Project
  10. How to Analyze the Cost Performance Index?
  11. Which Factors Impact the CPI of a Project?
  12. Advantages of Using Cost Performance Index (CPI)
  13. Disadvantages of Using Cost Performance Index (CPI):
  14. How to Use CPI to Improve Project Performance?
  15. Cost Performance Index – FAQs
  16. Wrap Up

First!

What is the Cost Performance Index (CPI)?

Definition: The Cost Performance Index (CPI) is a financial metric used in project management to assess cost efficiency. It is determined by dividing the earned value (EV) by the actual cost (AC).

A CPI greater than 1 indicates cost efficiency, while a value less than 1 suggests cost overrun. CPI provides insights into the project’s financial health and adherence to budgetary constraints. Thus, it aids project managers in budget management and decision-making.

What Does the CPI Mean?

The Cost Performance Index (CPI) measures a project’s cost efficiency by comparing earned value (EV) to actual costs (AC). A CPI of 1 means the project is on budget, a CPI above 1 indicates cost efficiency (under budget), and a CPI below 1 signals overspending. It helps project managers assess financial performance and make data-driven decisions to control costs.

Let’s take a closer look at why the CPI is so important and how it impacts our daily lives.

  • Efficiency measurement: CPI is critical for evaluating project cost management efficiency. It provides insights into how well a project utilizes resources about the budget.
  • Budget forecasting: Analyzing CPI can help you accurately forecast future project costs. This aids in budget planning and ensures effective allocation of financial resources throughout the project’s lifecycle.
  • Decision making: CPI plays a pivotal role in decision-making processes. It helps project managers identify areas where corrective actions may be needed and offers insights into the cost of living comparison by city. Thus, allowing for informed decision-making to keep the project on track.
  • Communication: CPI serves as a communication tool, providing stakeholders with a clear understanding of the project’s cost performance. This transparency fosters effective communication between project teams, sponsors, and other relevant parties.
  • Performance benchmarking: Comparing the CPI of different projects or phases allows for benchmarking performance. This comparative analysis helps identify trends, best practices, and areas for improvement across projects.
  • Early problem detection: A declining CPI may indicate potential issues in cost management. Early detection through CPI analysis enables you to address problems promptly, preventing cost overruns and ensuring project success.

What is the Purpose of a Cost Performance Index (CPI)?

The Cost Performance Index (CPI) is a key project management metric used to measure a project’s cost efficiency. It helps determine how effectively a project is using its budget by comparing the value of work completed to the actual costs incurred.

Purpose of CPI:

  1. Assess Cost Efficiency – Indicates whether the project is under or over budget.
  2. Forecast Budget Performance – Helps predict future cost trends and necessary adjustments.
  3. Support Decision-Making – Aids project managers in making informed financial decisions.
  4. Optimize Resource Allocation – Ensures efficient use of funds and resources.
  5. Enhance Project Control – Provides insights to keep the project financially on track.

What Does a CPI of 1, Less than 1, and Greater than 1 Mean?

So, in the above Cost Performance Index example, we have calculated CPI and don’t understand the result. Let’s make things clear for you:

  • CPI of 1 (CPI = 1): A CPI of 1 indicates that the project is exactly on budget. The earned value (the value of work performed) equals the actual cost incurred. This signifies that resources are being utilized as planned.
  • CPI less than 1 (CPI < 1): A CPI less than 1 signifies a cost overrun. The earned value is lower than the actual cost. Thus, the project is spending more resources than initially budgeted. This situation calls for careful analysis and corrective actions to bring the project back on track.
  • CPI greater than 1 (CPI > 1): A CPI greater than 1 indicates cost efficiency. The earned value surpasses the actual cost, suggesting the project performs better than expected. This scenario is generally favorable, demonstrating effective resource utilization.

How To Calculate Cost Performance Index?

The Total Cost Performance Index (TCPI) is a projection of the CPI needed to achieve specific financial goals. Or complete a project within the budget. It is calculated using the following formula:

TCPI = (BAC-AC)/(BAC-EV)

Where:

  • BAC (Budget at Completion) is the total budget allocated for the project.
  • EV (Earned Value) is the value of the work performed.
  • AC (Actual Cost) is the total cost incurred for the work performed.

The TCPI represents the cost performance required for the remaining work to stay within the budget. A TCPI of less than 1 indicates that the project needs to perform more efficiently to meet its budget. A TCPI greater than 1 suggests that the project can afford to be less efficient and stay within budget.

Formula For Cost Performance Index (CPI)

The formula for the Cost Performance Index (CPI) is:

                                                                                             CPI = EV/AC

Where:

  • EV (Earned Value) = The value of work performed
  • AC (Actual Cost) = The actual cost incurred for the work performed

What Does the Cost Performance Index Measure?

The Cost Performance Index (CPI) measures a project’s cost efficiency by comparing the value of work completed to the actual costs incurred. It indicates whether the project is staying within budget, overspending, or saving costs. A CPI greater than 1.0 means the project is under budget, 1.0 indicates it is on budget, and less than 1.0 signals overspending.

Cost Performance Index Examples

Example 1: Over Budget Project

  • Earned Value (EV): $80,000
  • Actual Cost (AC): $100,000
  • CPI Calculation:  

CPI = EV​/AC = 80,000/100000 = 0.8

  • Interpretation: CPI less than 1.0 → The project is over budget (spending more than planned).

Example 2: On Budget Project

  • Earned Value (EV): $50,000
  • Actual Cost (AC): $50,000
  • CPI Calculation:

CPI = EV/AC = 50,000/50,000 = 1.0

  • Interpretation: CPI equal to 1.0 → The project is on budget, and spending aligns with planned costs.

Example 3: Under Budget Project

  • Earned Value (EV): $120,000
  • Actual Cost (AC): $100,000
  • CPI Calculation:

CPI = EV/AC = 120,000/100000 = 1.2

  • Interpretation: CPI greater than 1.0 → The project is under budget (spending less than planned while achieving work targets).

How to Analyze the Cost Performance Index?

Let’s take a hypothetical scenario for the Cost Performance Index example.

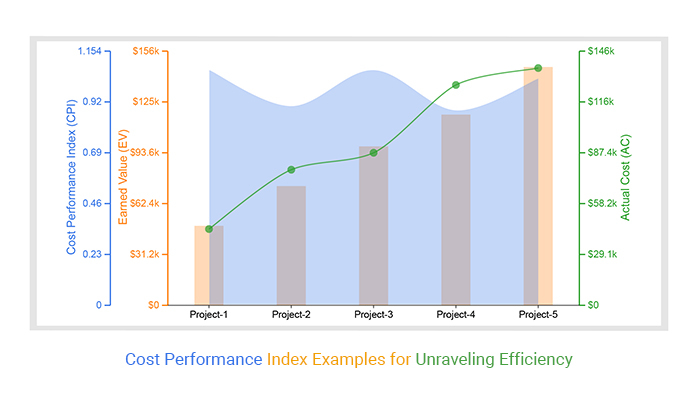
Imagine you’re overseeing the construction of a building with the cost data table below.

Project Earned Value (EV) Actual Cost (AC) Cost Performance Index (CPI)
Project-1 50,000 45,000 1.11
Project-2 75,000 80,000 0.94
Project-3 100000 90,000 1.11
Project-4 120,000 130,000 0.92
Project-5 150,000 140,000 1.07

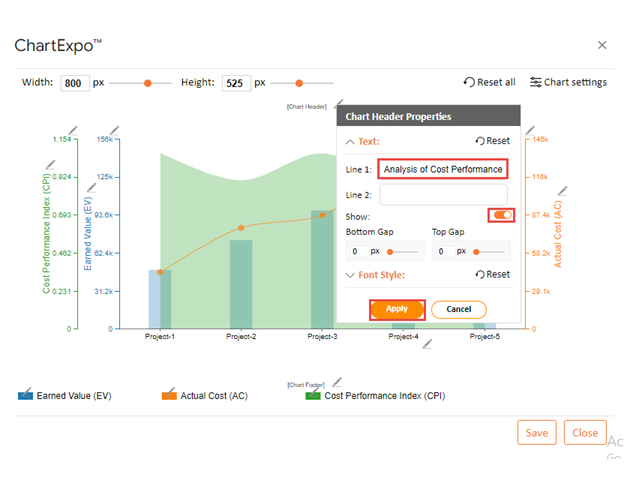
However, with data visualization, gleaning insights from this data becomes a breeze. While Google Sheets is a widely used visualization tool, its abilities might leave you longing for more.

Fear not; ChartExpo is here to save you from the clutches of Google Sheet’s data visualizations charts and graphs. With ChartExpo’s prowess, you’ll not just analyze numbers but craft a visual narrative.

Let’s learn how to install ChartExpo in Google Sheets

  1. To start using ChartExpo, you can download it directly from the Google Sheets program. To do this, select Extensions from the top toolbar.
  2. A menu will appear. Click the Get add-ons option.
  3. Search for ChartExpo, and click on Charts, Graphs & Visualizations by ChartExpo when it appears in the results.
  4. Click the Install button. You will have to confirm your Google account and accept some permissions.

ChartExpo charts are available both in Google Sheets and Microsoft Excel. Please use the following CTA’s to install the tool of your choice and create beautiful visualizations in a few clicks in your favorite tool.

  • To get started with ChartExpo, install ChartExpo in Google Sheets.
  • Go to Extensions > Charts, Graphs & Visualizations by ChartExpo > Open.
open chartexpo in google sheets
  • To access the charts library, click the Add new chart button.
add new chart in google sheets
  • Once ChartExpo is loaded. Click on “Multi-Axis Line Chart”.
Salect Multi-Axis Line Chart ce478
  • Put the data table in the sheet first. Then, choose the Sheet name from the drop-down in the ChartExpo section.
  • Select the metric column; metric is the numeric column in your data sheet (in this example, it is the Earned Value, Actual Cost, and Cost Performance Index).
  • Select the dimensions columns; the dimension is the categorical column in your datasheet that contains text information (in this case, it is the project).
  • Click the Create chart button to complete the process.
Create Chart From Selection ce478
  • Your tabular data will turn into a Multi-Axis Line Chart. Then change the data representation by clicking on Chart Settings:
Data Representation ce478
  • Click the Edit chart button to make custom changes.
Cost Performance Index Example Design Template
  • To change the title of the chart, click on the pencil icon that is available next to the Chart Header.
  • It will open the properties dialog. Under the Text section, you can add a heading in Line 1 and enable the Show option. Give the appropriate title of your chart and click on the Apply button.
Apply Tittle on Chart ce478
  • To add a dollar sign to the Actual Cost values, select the “Prefix” property. Then click “Apply All” to see the change.
Add Prefix Value To Actual Cost ce478
  • To add a dollar sign to the Estimates values, select the “Prefix” property. Then click “Apply All” to see the change.
Add Prefix Value To Estimates Cost ce478
  • Change the legend shape of the Earned value into a column:
Change Legend Shape of Earned Value ce478
  • Change the legend shape of the Cost Performance Index into Line and Circle:
Change Legend Shape of Cost Performance ce478
  • Click the “Save” button to keep all the changes.
Save All Changes ce478
  • The final Chart will look like below.
Final Cost Performance Index Example

Insights

From the Cost Performance Index example above,

Projects 1, 3, and 5 boast a CPI greater than 1, indicating that costs are under budget. Conversely, Projects 2 and 4 showcase a CPI less than 1, signaling cost overruns.

Which Factors Impact the CPI of a Project?

Several factors impact the Cost Performance Index (CPI) of a project, including:

  1. Cost Estimation Accuracy – Poor cost forecasting can lead to budget overruns.
  2. Resource Allocation – Inefficient use of labor, materials, or equipment affects costs.
  3. Scope Changes – Frequent modifications can increase expenses and lower CPI.
  4. Project Delays – Time overruns often lead to higher costs, reducing CPI.
  5. Procurement Costs – Price fluctuations in materials or services impact budget efficiency.
  6. Risk Management – Unmanaged risks can cause unexpected expenses.
  7. Team Productivity – Low productivity increases costs, negatively affecting CPI.

Advantages of Using Cost Performance Index (CPI)

  • Efficiency Measurement

The CPI provides a quantitative measure of cost efficiency in project management, often used alongside tools like a price comparison template. It allows you to assess how effectively resources are being utilized within the budget. A CPI greater than 1 indicates efficiency, while a CPI less than 1 signals potential cost overruns.

  • Early Problem Detection

Regular CPI monitoring helps to detect issues in cost management early on. A declining CPI may indicate the project is not meeting cost expectations, prompting timely corrective actions.

  • Decision Making

You can use CPI data, along with visual tools like a Chord diagram, to make informed decisions about resource allocation, budget adjustments, or project scope changes. These tools provide a quantitative basis for assessing the financial health of the project.

  • Resource Allocation

Understanding the cost performance through the CPI helps in optimizing resource allocation. You can identify areas where resources are efficiently utilized and areas requiring adjustments. This aids in ensuring efficient resource allocation to meet project objectives.

  • Communication

The CPI serves as a communication tool between project teams and stakeholders. It provides a clear and standardized measure of cost performance that you can easily communicate to all parties. This transparency fosters better understanding and collaboration among team members and stakeholders.

Disadvantages of Using Cost Performance Index (CPI):

While the Cost Performance Index is a valuable metric for assessing cost efficiency, it has some limitations.

  • Sensitivity to Data Accuracy

Cost Performance Index (CPI) accuracy highly depends on the data used in its calculation. Inaccurate or unreliable data can lead to misleading CPI values, affecting the reliability of cost performance assessments.

  • Focus on Past Performance

CPI primarily reflects past cost performance and does not inherently account for future changes or unforeseen events. Relying solely on CPI may lead to a lack of proactive planning for future challenges. Consequently, this could massively impact project costs.

  • Limited Scope

While CPI provides insights into cost efficiency, it is a single-dimensional metric. It does not capture the full spectrum of project performance, such as schedule adherence, quality, or stakeholder satisfaction. A comprehensive project assessment may require the consideration of multiple metrics.

  • Complexity

The CPI formula involves multiple variables and may be complex for individuals unfamiliar with project management metrics. This complexity can make it challenging for some stakeholders to interpret and use CPI effectively.

  • Not a Standalone Metric

Relying solely on CPI without considering other factors may lead to incomplete assessments. For a comprehensive evaluation, it is essential to integrate CPI with metrics like the Schedule Performance Index (SPI).

How to Use CPI to Improve Project Performance?

1. Monitor Cost Efficiency

Regularly track CPI to determine whether the project is under or over budget. A CPI greater than 1.0 indicates cost savings, while less than 1.0 signals overspending.

2. Identify Cost Issues Early

Analyze CPI trends to detect budget overruns before they escalate. Investigate cost variances and take corrective action if CPI falls below 1.0.

3. Adjust Budget and Resources

Use CPI insights to optimize resource allocation, reduce waste, and improve spending efficiency. Redirect funds to high-priority tasks if needed.

4. Improve Forecasting and Planning

A stable CPI helps refine cost estimates for future phases. Use historical CPI data to set realistic budgets and enhance financial forecasting.

5. Implement Cost Control Measures

If CPI is low, implement cost-saving strategies such as renegotiating contracts, improving productivity, or reducing unnecessary expenditures.

Cost Performance Index – FAQs

What is Schedule Performance Index?

The Schedule Performance Index (SPI) measures a project’s time efficiency by comparing the earned value (EV) to the planned value (PV). It indicates whether a project is ahead, on, or behind schedule.

Formul: SPI= EV/PV​

  • SPI > 1.0 → Ahead of schedule
  • SPI = 1.0 → On schedule
  • SPI < 1.0 → Behind schedule

How do I calculate the cost performance index (CPI)?

To calculate the Cost Performance Index (CPI), divide the Earned Value (EV) by the Actual Cost (AC). The formula is CPI = EV / AC. A CPI above 1 indicates cost efficiency and below 1 signals cost overruns.

What does a cost performance index CPI of 1.25 mean?

A Cost Performance Index (CPI) of 1.25 indicates that the project is performing with cost efficiency. The project has earned 1.25 units of value for every unit of cost spent. This suggests effective budget management and resource utilization.

What is a good cost performance index?

A Cost Performance Index (CPI) greater than 1 is considered good, indicating cost efficiency. A CPI of 1 means the project is on budget, while a CPI below 1 suggests cost overruns. The higher the CPI, the better the project is managing costs.

Wrap Up

The Cost Performance Index (CPI) emerges as a financial compass guiding project success. This index unlocks a window into a project’s fiscal health, ensuring it stays on course and within budget.

Projects with a CPI greater than 1 stand as exemplars of efficiency, deftly managing costs and delivering value. Conversely, those with a Cost Performance Index Example below 1 signal a need for strategic interventions to rein in cost overruns, showcasing the practical application of this metric in real-world project scenarios.

The beauty of CPI lies in its simplicity. It’s not just a number. It’s a conversation starter, prompting discussions on resource allocation, budget adjustments, and overall project efficiency.

In project management, where numbers often feel like a dense forest, ChartExpo emerges as the guide. It transforms data into a visual expedition.

The union of CPI analysis and ChartExpo’s visual magic unveils a holistic understanding of project financial health. Intricately woven with ChartExpo’s visual finesse, CPI data invites decision-makers to explore the financial landscape effortlessly.

Embrace this synergy and shape the fate of your projects.

How much did you enjoy this article?

GSAd1
Start Free Trial!
131517

Related articles

next previous
Data Analytics12 min read

Business Intelligence in Healthcare Industry: A Visual Approach

Business Intelligence in the healthcare industry improves patient care and streamlines operations. Learn how BI works and benefits healthcare providers.

Data Analytics10 min read

Analytics in Telecom Industry for Better Insights

Analytics in the telecom industry optimizes networks, enhances customer experience, and detect fraud. Learn its key benefits, challenges, and use cases.

Data Analytics7 min read

Financial Forecasting for Startups: A Complete Guide

This guide dives deep into financial forecasting for startups. You'll also discover elements of a financial projection for a startup, and tips for creating one.

Data Analytics32 min read

Data Reporting: Making Your Reports Irresistible

Data reporting turns numbers into insights that guide decisions. Learn how to simplify complex data and make confident choices. Read on for key strategies!

Data Analytics10 min read

Employee Performance KPIs: Insights That Drive Action

Employee performance KPIs track productivity and success. Learn the key metrics, measurement methods, and analysis techniques to boost performance.

ChartExpo logo

Turn Data into Visual
Stories

CHARTEXPO

  • Home
  • Gallery
  • Videos
  • Services
  • Pricing
  • Contact us
  • FAQs
  • Privacy policy
  • Terms of Service
  • Sitemap

TOOLS

  • ChartExpo for Google Sheets
  • ChartExpo for Microsoft Excel
  • Power BI Custom Visuals by ChartExpo
  • Word Cloud

CATEGORIES

  • Bar Charts
  • Circle Graphs
  • Column Charts
  • Combo Charts
  • Comparison Charts
  • Line Graphs
  • PPC Charts
  • Sentiment Analysis Charts
  • Survey Charts

TOP CHARTS

  • Sankey Diagram
  • Likert Scale Chart
  • Comparison Bar Chart
  • Pareto Chart
  • Funnel Chart
  • Gauge Chart
  • Radar Chart
  • Radial Bar Chart
  • Sunburst Chart
  • see more
  • Scatter Plot Chart
  • CSAT Survey Bar Chart
  • CSAT Survey Chart
  • Dot Plot Chart
  • Double Bar Graph
  • Matrix Chart
  • Multi Axis Line Chart
  • Overlapping Bar Chart
  • Control Chart
  • Slope Chart
  • Clustered Bar Chart
  • Clustered Column Chart
  • Box and Whisker Plot
  • Tornado Chart
  • Waterfall Chart
  • Word Cloud
  • see less

RESOURCES

  • Blog
  • Resources
  • YouTube
SIGN UP FOR UPDATES

We wouldn't dream of spamming you or selling your info.

© 2025 ChartExpo, all rights reserved.