Categories
Compound interest in Excel—how does it work?
I’m sure you’ve encountered compound interest if you’ve ever invested or taken out a loan. But do you know how to calculate it efficiently in Excel? Excel’s powerful tools make the process simple. With a few formulas, you can quickly calculate compound interest in Excel for savings or loan tracking.


Compound interest can make a big difference to your financial growth. Using Excel for compound interest helps you track earnings or costs while saving time. Moreover, it lets you track everything from savings to investments, showing how your money grows or what you’ll owe.
To understand the impact, compare interest rate vs. yield and how they affect your calculations. Understanding the difference can help you make better financial decisions, whether assessing an investment or optimizing your savings. Moreover, you can visualize your financial growth using advanced Excel charts and model insightful financial graphs and charts in Excel.
Ready to dive into how compound interest in Excel can change how you manage your finances? Let’s explore.
Definition: Compound interest refers to calculating interest on the initial principal and the accumulated interest from previous periods. This can be done in Excel using formulas like FV (Future Value) or PMT (Payment).
You can track an investment’s growth by inputting the principal amount, interest rate, and period. This is especially useful for creating financial models in Excel. It also helps calculate the Compound Annual Growth Rate (CAGR) and track investment performance over time.
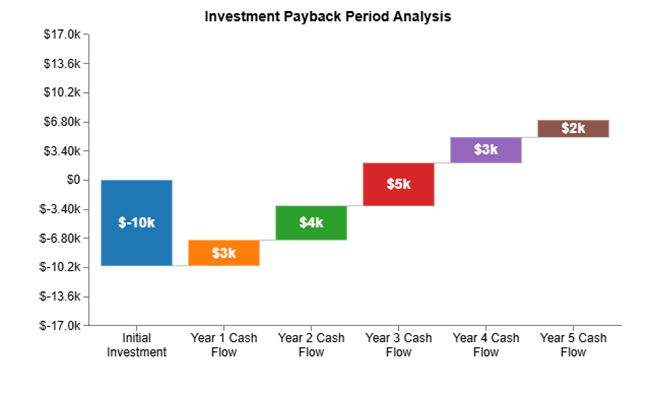
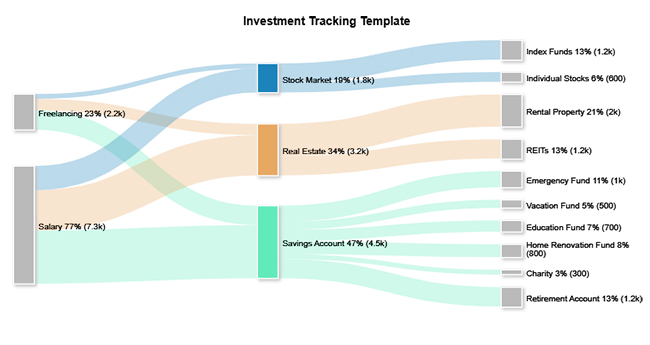
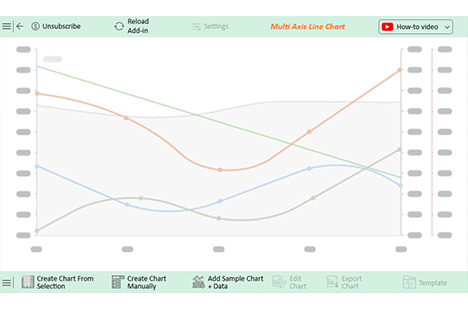
Check out these top five charts you can use to analyze compound interest. These charts were created using ChartExpo. ChartExpo is a tool that makes it easier to visualize your data and make informed financial decisions.
Knowing the different compounding methods is essential when working with compound interest in Excel. Each one affects how often the interest is added to the principal. You can calculate these variations using formulas and create visualizations with financial graphs and charts in Excel:
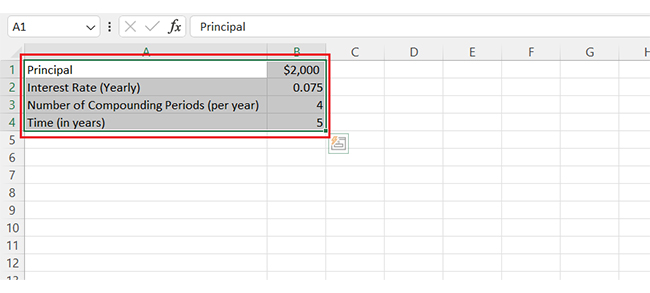
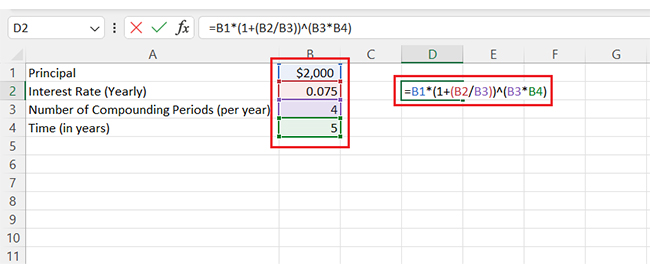
Calculating compound interest in Excel is a quick and efficient way to track the growth of your investments or loans. How do you do it? Follow these steps:
It doesn’t end here. You can use this data to create a monthly cash flow template in Excel to visualize your money flow over time.
Excel makes this process quick and easy. How? You get accurate results with just a few formulas.
Here’s how you can do it:
Compound interest in Excel is not merely theoretical but a practical tool for organizing your financial affairs. Excel simplifies tasks while minimizing errors. It helps ensure accuracy and efficiency in your financial planning. Here’s how:
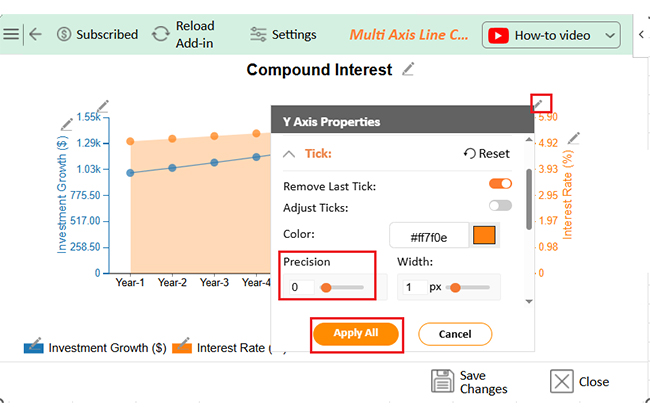
Have you ever tried calculating compound interest in Excel and wished the results were easier to visualize? While Excel is great for crunching numbers, it can be clunky regarding data visualization. Enter ChartExpo—the tool that turns Excel’s static charts into dynamic visualizations.
With ChartExpo, you can bring your compound interest data to life with insightful, easy-to-read graphs. Let’s explore how this can make your financial calculations and data analysis in Excel accurate and visually engaging.
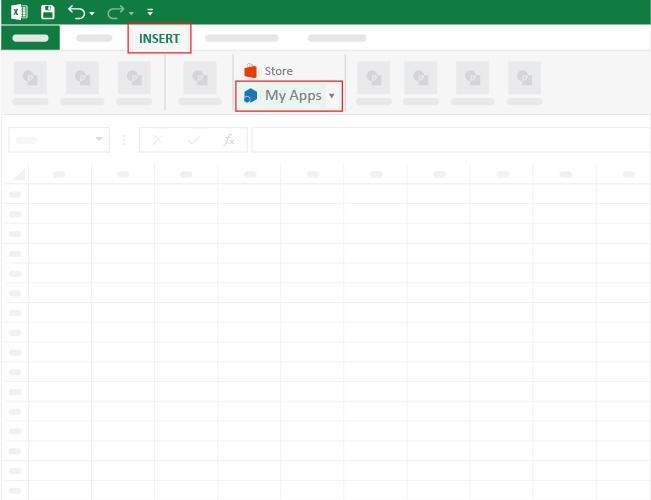
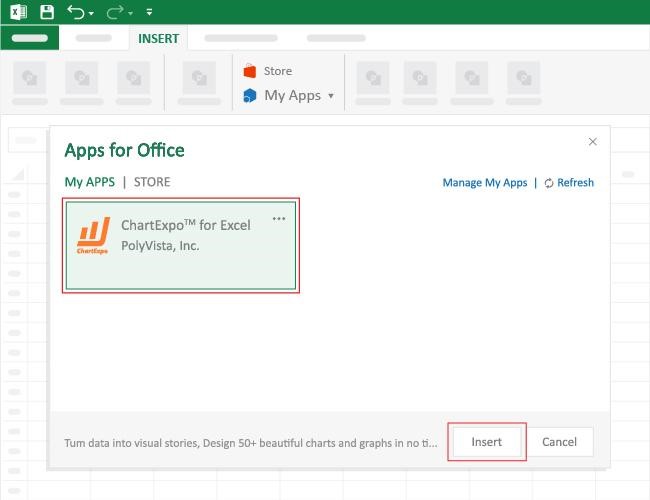
How to Install ChartExpo in Excel?
ChartExpo charts are available both in Google Sheets and Microsoft Excel. Please use the following CTAs to install the tool of your choice and create beautiful visualizations with a few clicks in your favorite tool.
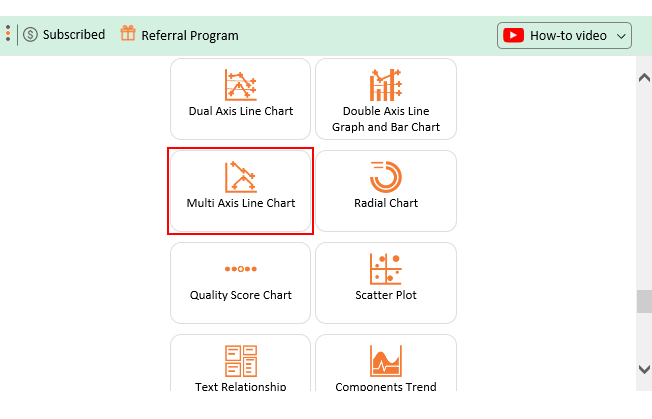
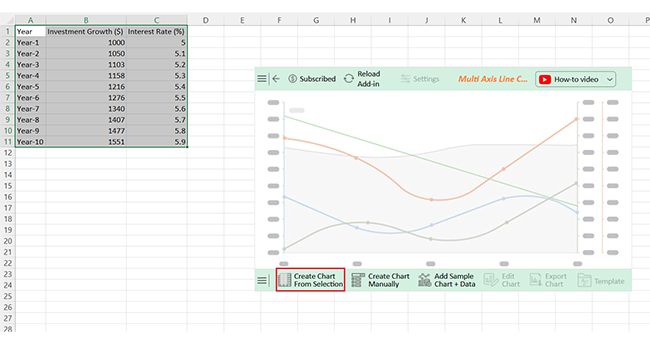
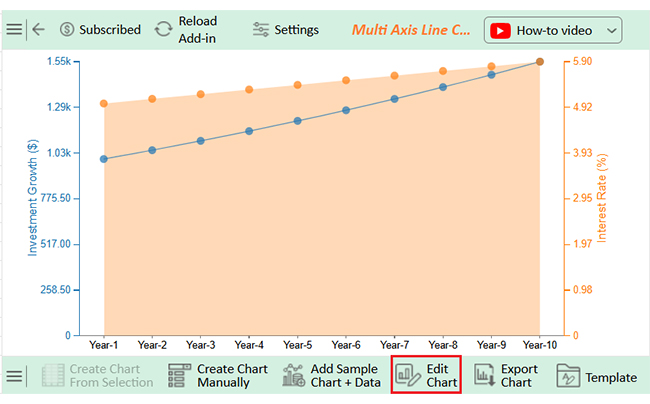
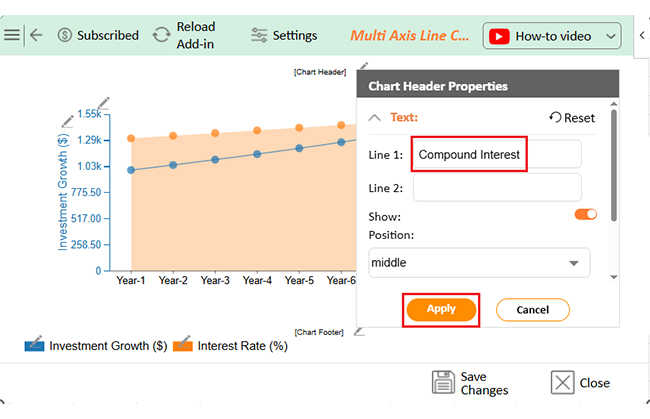
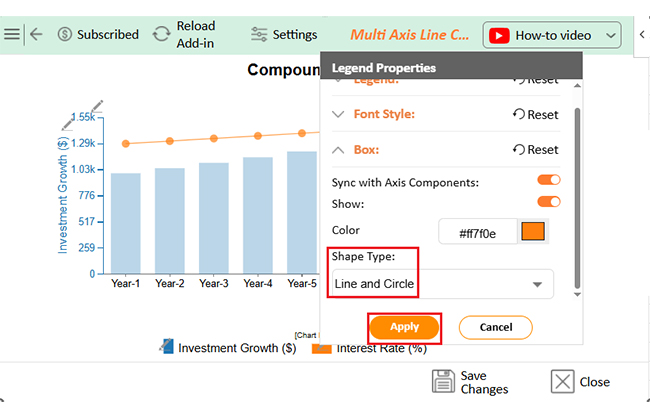
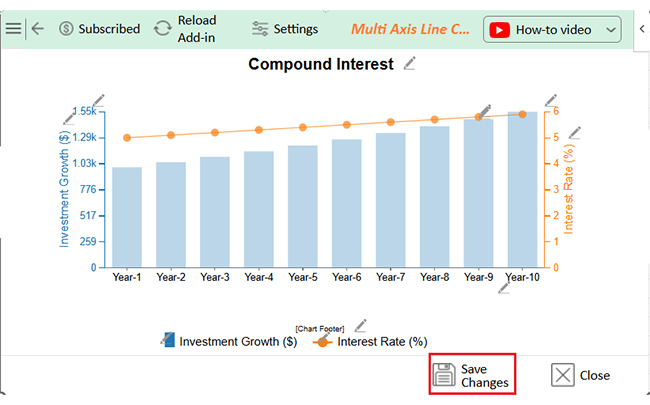
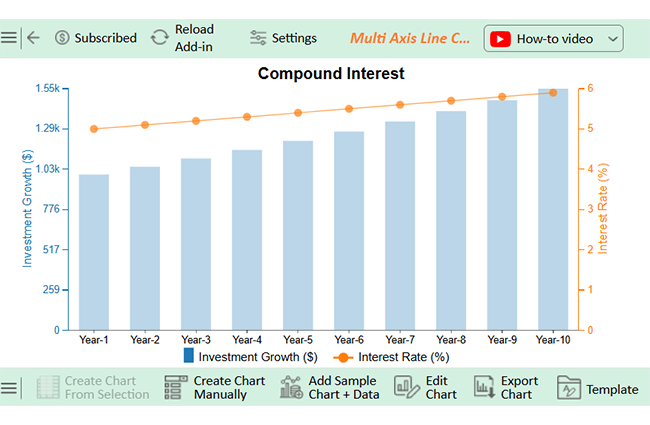
Let’s learn how to create a monthly budget in Excel using ChartExpo and glean insights from the visualization:
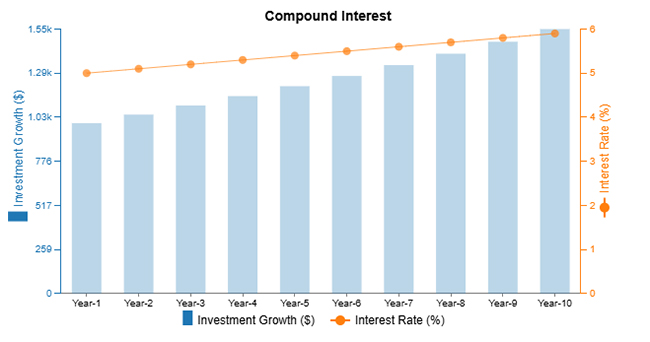
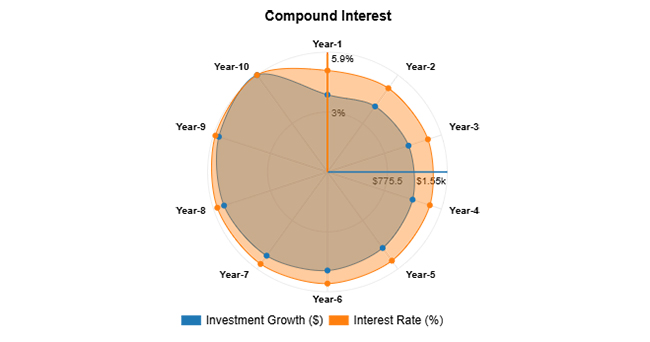
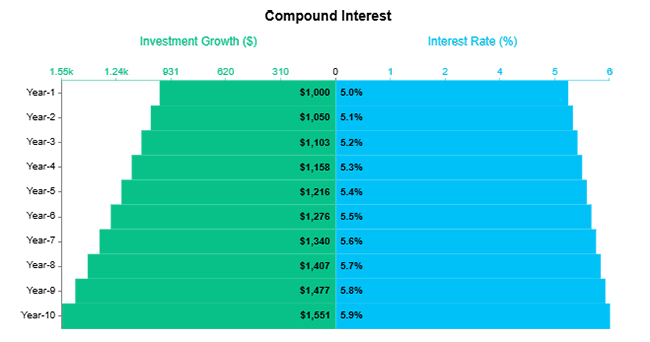
| Year | Investment Growth ($) | Interest Rate (%) |
| Year-1 | 1000 | 5 |
| Year-2 | 1050 | 5.1 |
| Year-3 | 1103 | 5.2 |
| Year-4 | 1158 | 5.3 |
| Year-5 | 1216 | 5.4 |
| Year-6 | 1276 | 5.5 |
| Year-7 | 1340 | 5.6 |
| Year-8 | 1407 | 5.7 |
| Year-9 | 1477 | 5.8 |
| Year-10 | 1551 | 5.9 |
Calculating compound interest in Excel is not just about using the right formulas. With a few tips and tricks, you can streamline your calculations and improve your data analysis in Excel. Let’s dive into some easy ways to calculate compound interest in Excel:
Use the formula =FV(rate/12, nper*12, 0, -pv):
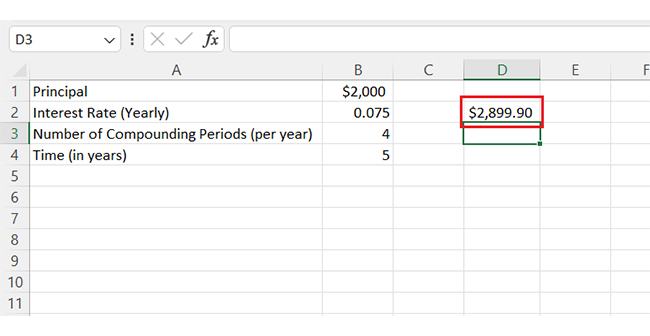
Use the formula =PV*EXP(rate*time). Replace Principal with the initial amount, Rate with the annual interest rate, and Time with years. The EXP function applies Euler’s number (e ≈ 2.718) for continuous growth.
Excel’s compound interest calculator is a powerful tool for calculating investment growth over time. To see how compound interest affects your savings or investments, Excel’s built-in functions, like FV, can help. They provide quick and accurate results over time.
Learn how mortgage interest deductions work so you can lower your taxable income. You can easily calculate these deductions using Excel and maximize your potential tax savings. Excel is powerful for computing cumulatively compounded interest and financial operations.
When managing finances, it’s crucial to analyze your data effectively. Profit and loss templates in Excel help track revenues and expenses, giving you a clear picture of your financial health. These templates ensure you stay on top of your finances.
If you’re analyzing potential investments, you need to know how to calculate the internal rate of return in Excel. This allows you to calculate how profitable an investment is over time.
Conclusively, Excel is excellent for compound interest, investments, and financial data calculations. It streamlines complex calculations, making it easier to make informed decisions. For better results, start using ChartExpo to visualize your data easily.
How much did you enjoy this article?


Learn how to use sparklines in Excel to quickly visualize trends inside cells. Discover types, creation steps, customization, use cases, benefits, and best practices.

Learn what a confidence interval graph is, how to create it in Excel, and how to interpret results to make more reliable, data-driven decisions.

A correlation matrix in Excel helps identify relationships between variables. Learn how to create, read, and use it for effective data analysis.


