Categories
Compare two columns in Google Sheets—Is it easier said than done? Many users struggle to identify differences, find matches, or eliminate duplicate entries. But with the right tools, the process becomes faster, more reliable, and less prone to human error.


Over 2 billion people use Google Workspace, and Google Sheets functionality is a key reason why. Whether tracking inventory or matching sales data, knowing how to compare two columns in Google Sheets can save you hours.
Google Sheets’ artificial intelligence is also stepping up to help. Sheets are getting smarter with features like bright fill and suggestions. But knowing the right functions still matters. Many explore what-if analysis in Google Sheets to predict how changes will affect totals or outputs. But it all starts with solid, clean data. Comparing columns is step one. From there, analysis becomes meaningful.
So, how do you spot the differences? How do you highlight matches, eliminate duplicates, or make your spreadsheet more straightforward to read?
Let’s turn confusion into clarity—one cell at a time.
First…
Definition: Comparing two columns in Google Sheets involves examining how the data in one column relates to the data in another. You can look for matches, differences, or duplicates. This helps clean up data and avoid errors. It’s often used to track changes or verify lists.
Tools like VLOOKUP for Google Sheets make it simple. You can also use Google Sheets Slicers to filter data visually. Comparing columns ensures that your information is accurate and organized for analysis or reporting.
Have you ever wasted an hour scanning two lists line by line? Probably you were managing inventory, comparing user data, or double-checking survey results. Listen to this: knowing how to compare columns in Google Sheets can save you serious time and headaches.
Here’s why it’s so helpful:
Have you ever stared at two long columns and thought, “There has to be an easier way to compare these”? You’re not alone. Comparing two columns in Google Sheets is a daily task for many teams. But doing it manually? That’s a recipe for missed errors and wasted time.
Let’s break down the most effective ways to do it:
This is How to Do It:
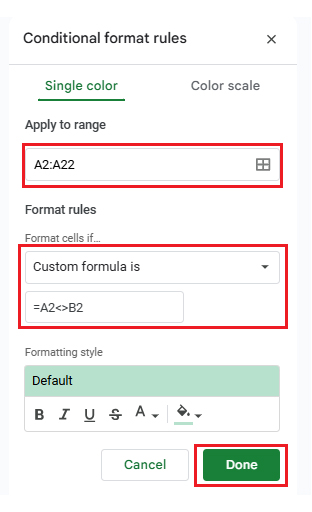
Follow these steps to apply conditional formatting:
Have you ever felt overwhelmed trying to compare two columns full of names, IDs, or values? You’re not alone. Doing it by eye is slow and risky. Fortunately, Google Sheets provides formulas that enable fast, accurate, and stress-free comparisons.
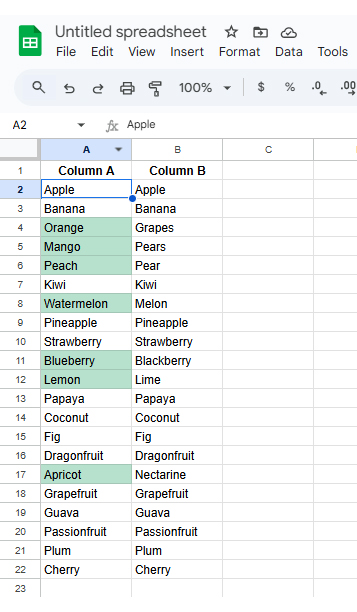
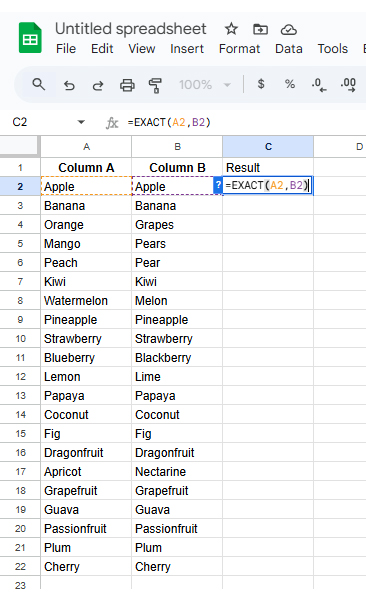
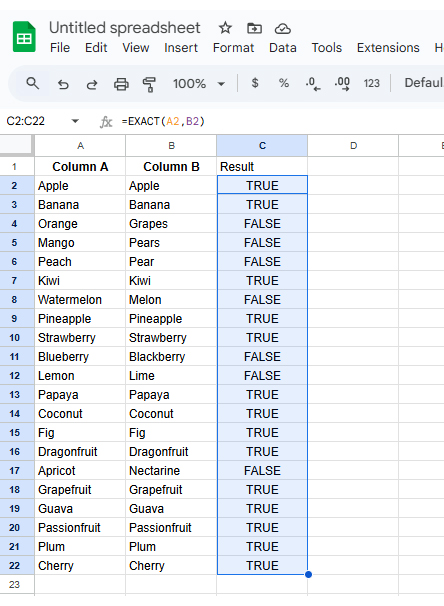
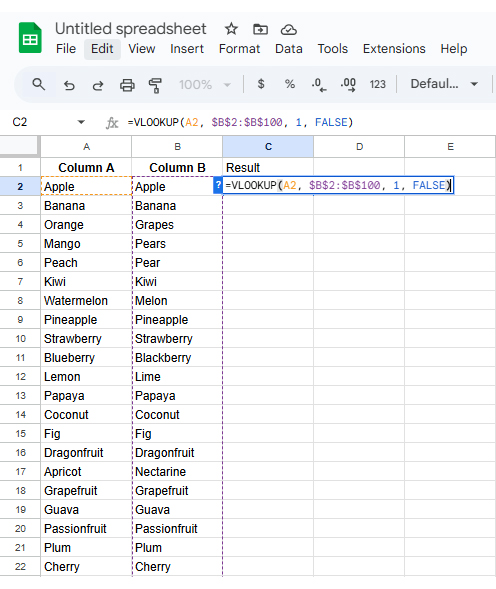
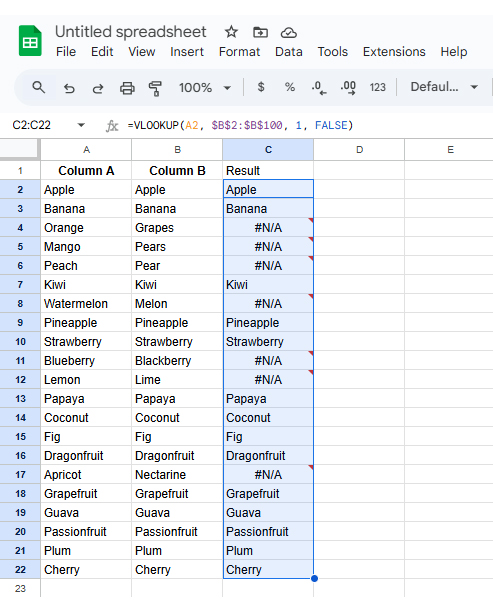
Here are three powerful formulas to help you compare two columns in Google Sheets like a pro:
Are you tired of squinting at rows trying to spot differences? Welcome to the spreadsheet struggle. Comparing two columns in Google Sheets should be quick, but it often feels like digital detective work—especially without clear Google Sheets charts to highlight the differences.”
Sure, Google Sheets gets the job done, but when it comes to data visualization, it hits a wall. Charts are basic, options are limited, and even a Waterfall chart in Google Sheets and other charts can make a difference for clear, actionable insights.
That’s where ChartExpo steps in. It brings powerful, easy-to-use visuals right into Google Sheets, making it simple to create a progress bar in Google Sheets and other insightful charts without complex setup.
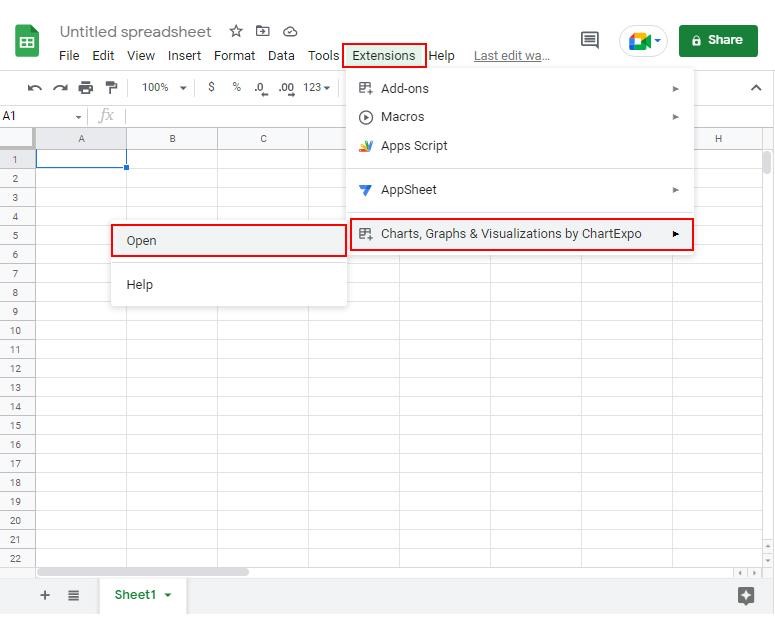
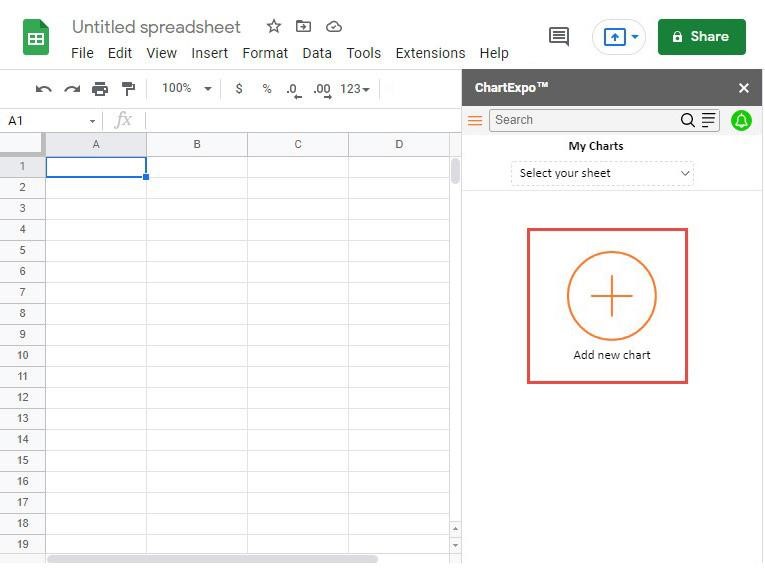
How to Install ChartExpo in Google Sheets?
ChartExpo charts are available in Google Sheets, including the Scatter plot in Google Sheets. Use the following CTAs to install your favorite tool and create beautiful visualizations in just a few clicks.
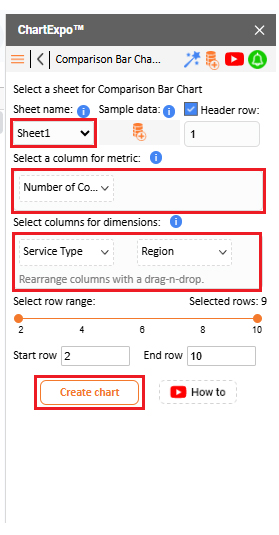
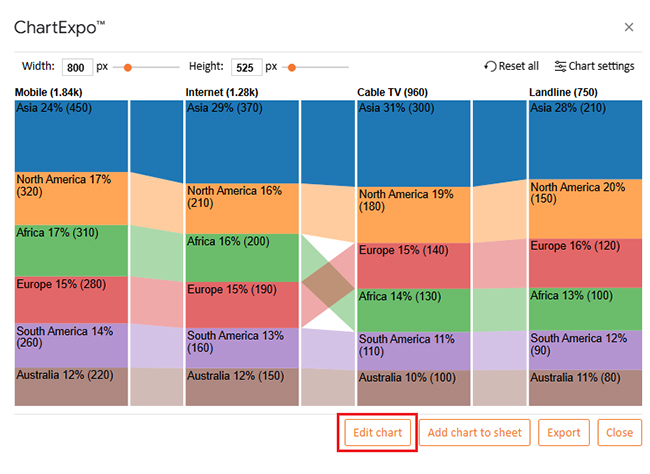
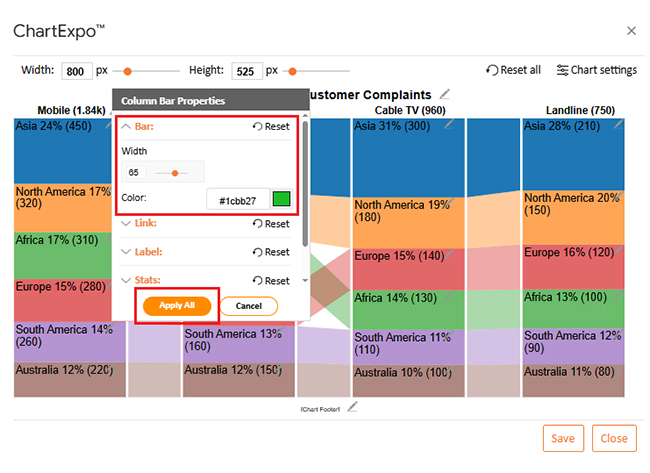
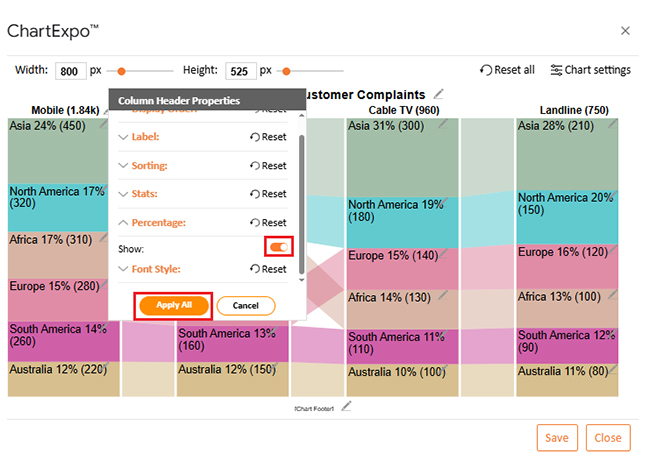
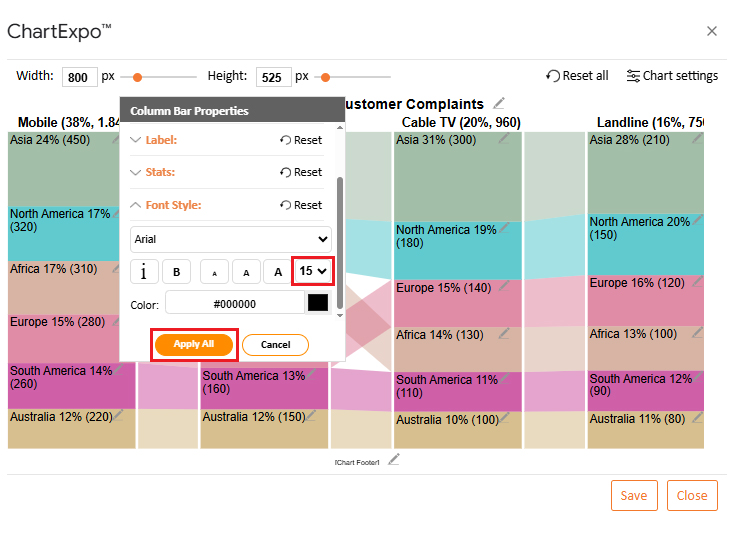
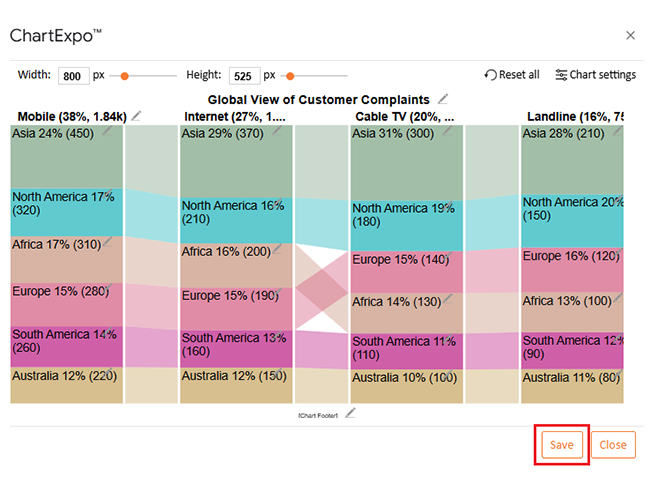
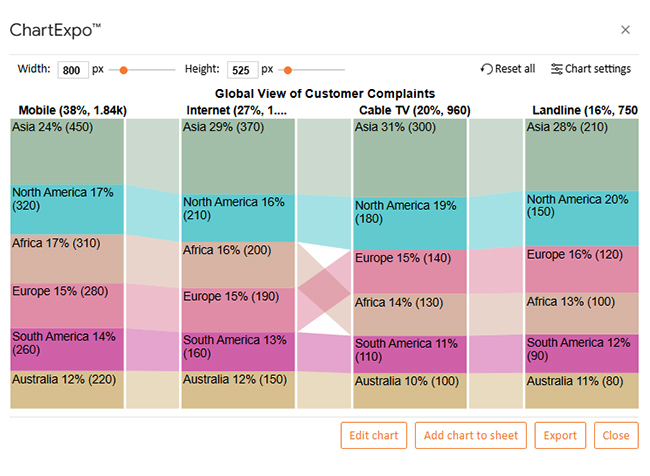
Let’s analyze this sample data in Google Sheets using ChartExpo.
| Service Type | Region | Number of Complaints |
| Mobile | North America | 320 |
| Mobile | Europe | 280 |
| Mobile | Asia | 450 |
| Internet | North America | 210 |
| Internet | Europe | 190 |
| Internet | Asia | 370 |
| Cable TV | North America | 180 |
| Cable TV | Europe | 140 |
| Cable TV | Asia | 300 |
Have you ever stared at a messy spreadsheet and thought, “Something’s off—but I can’t tell what”? That’s where comparing columns comes in. It’s fast, clear, and keeps your data honest.
Here’s why this simple action brings serious value:
Have you ever felt like you’ve mastered the basics, but your spreadsheet still isn’t telling the whole story? That’s your cue to level up. Comparing two columns doesn’t stop at IF formulas—it can get brighter, sharper, and more automated.
Here are some advanced tips to take your Google Sheets functionality further:
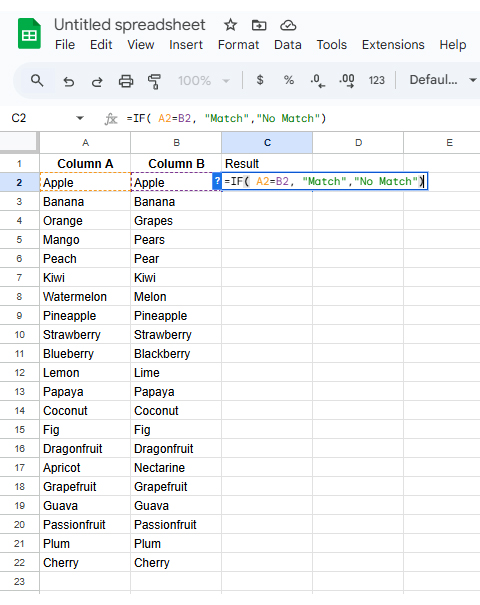
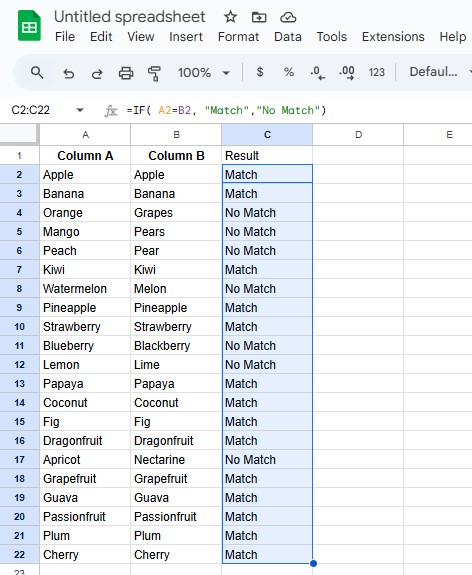
Yes, you can. Use formulas like =IF(A2=B2, “Match”, “No Match”). It highlights where values differ. Conditional formatting can also help. It makes differences easy to spot visually.
Comparing two columns in Google Sheets doesn’t have to be complicated. With the right tools, it becomes fast and accurate. You don’t need to be a spreadsheet expert. A few formulas go a long way.
Start with simple functions. Use IF for row-by-row checks. Also, try using VLOOKUP in Google Sheets when searching for a value in one list within another. These give clear answers in seconds.
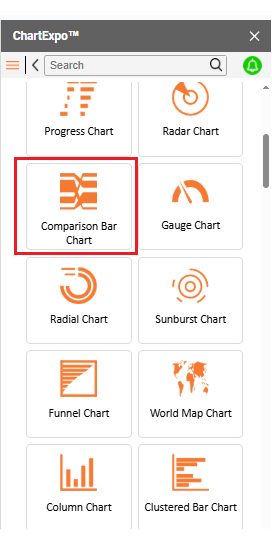
Want something more visual? Learn how to make a Comparison Chart in Google Sheets. Charts make differences more straightforward to spot. They also help when sharing your data with others.
Cleaning data matters too. Use the ‘Remove Duplicates in Google Sheets before you start comparing. This step saves time and avoids false mismatches. Clean data is always better data.
Conditional formatting adds color to your checks. It highlights problems fast. You can scan and act without having to dig through rows of information.
Finally, comparing columns is more than a technical task. It improves accuracy, boosts confidence, and saves hours. Utilize the functions and tips we’ve discussed to transform messy data into clear, informed decisions.
And don’t stop there. Install ChartExpo to create visuals quickly and highlight insights.
How much did you enjoy this article?


SUMPRODUCT in Google Sheets handles multi-condition calculations without extra columns. Master its syntax, uses, and errors. Read on!

An annual budget template in Google Sheets organizes your yearly finances, tracks every dollar, and reveals spending patterns. Read on!

Learn the best graph to show profit and loss with practical examples and use cases. Discover how to visualize your business data, track trends, and make smarter financial decisions.


