• Home
  • Tools dropdown img
    • Spreadsheet Charts

      • ChartExpo for Google Sheets
      • ChartExpo for Microsoft Excel
    • Power BI Charts

      • Power BI Custom Visuals by ChartExpo
    • Word Cloud

  • Charts dropdown img
    • Chart Category

      • Bar Charts
      • Circle Graphs
      • Column Charts
      • Combo Charts
      • Comparison Charts
      • Line Graphs
      • PPC Charts
      • Sentiment Analysis Charts
      • Survey Charts
    • Chart Type

      • Box and Whisker Plot
      • Clustered Bar Chart
      • Clustered Column Chart
      • Comparison Bar Chart
      • Control Chart
      • CSAT Survey Bar Chart
      • CSAT Survey Chart
      • Dot Plot Chart
      • Double Bar Graph
      • Funnel Chart
      • Gauge Chart
      • Likert Scale Chart
      • Matrix Chart
      • Multi Axis Line Chart
      • Overlapping Bar Chart
      • Pareto Chart
      • Radar Chart
      • Radial Bar Chart
      • Sankey Diagram
      • Scatter Plot Chart
      • Slope Chart
      • Sunburst Chart
      • Tornado Chart
      • Waterfall Chart
      • Word Cloud
    • Google Sheets
      Microsoft Excel
  • Services
  • Pricing
  • Contact us
  • Blog
  • Support dropdown img
      • Gallery
      • Videos
      • Contact us
      • FAQs
      • Resources
    • Please feel free to contact us

      atsupport@chartexpo.com

Categories
All Data Visualizations Data Analytics Surveys
Add-ons/
  • Google Sheets
  • Microsoft Excel
  • Power BI
All Data Visualizations Data Analytics Surveys
Add-ons
  • Google Sheets
  • Microsoft Excel
  • Power BI

We use cookies

This website uses cookies to provide better user experience and user's session management.
By continuing visiting this website you consent the use of these cookies.

Ok

ChartExpo Survey


Home > Blog > Google Sheets

Top 7 Alternative of Excel for Chart Creation

Are you tired of the limitations of Excel? Maybe you have encountered a barrier with its ability to analyze data.

You are not alone. There is currently a tremendous need for more powerful and easier-to-use data visualization tools. More and more data analysts, business professionals, and enthusiasts are looking for an alternative to Excel.

Alternative of Excel

But what options are out there, and how do they compare to Excel?

Enter the world of modern data analytics tools, each offering a unique approach to handling data. Google Sheets, Zoho Sheets, Smartsheet, R, and business intelligence solutions are all vying to be the go-to alternative to Excel. They provide better options for creating dynamic dashboards and visualizations.

What distinguishes them, and which one suits your needs best?

This blog post evaluates various data analytics tools, analyzing their characteristics, benefits, and appropriateness for specific situations. We will investigate the reasons behind the increasing popularity of these options in data analysis.

Are you ready to enhance your data analysis skills? Join us let’s explore the landscape of Excel alternatives.

Table of Contents:

  1. What is the Alternative to Excel?
  2. Why Do We Substitute for Excel?
  3. How to Choose Alternatives to Excel?
  4. How to Use the Alternative of Excel?
  5. What are the Benefits of Excel Replacements?
  6. Wrap Up

First…

What is the Alternative to Excel?

Excel has long been the go-to tool for managing data, creating budgets, or performing complex calculations. However, several fantastic alternatives offer unique features and capabilities, catering to various needs.

Let’s explore some of these alternatives and see how they stack up.

  1. Google Sheets: This cloud-based spreadsheet tool allows real-time collaboration and easy sharing. With powerful features and seamless integration with other Google Workspace apps, it’s an excellent choice for teams working remotely. Or anyone needing flexibility and accessibility.
  2. LibreOffice Calc: An open-source option, Calc offers a robust set of tools similar to Excel. It’s free to use and can handle complex data analysis. This makes it an excellent choice for those looking for a cost-effective alternative.
  3. Apple Numbers: Ideal for Mac users, Numbers provides a visually appealing and user-friendly interface that enhances data storytelling. With its beautiful templates and intuitive features, Numbers is perfect for creating polished and professional-looking spreadsheets. It transforms raw data into compelling narratives, making it easier to communicate insights and tell your data’s story in an engaging and visually stunning way.
  4. Zoho Sheet: This online spreadsheet tool is part of the Zoho Office Suite. It includes advanced data processing capabilities and collaborative features, making it a strong contender for businesses and teams.
  5. WPS Office Spreadsheets: Offering a familiar interface and powerful tools, WPS Office Spreadsheets is a versatile option that supports various file formats. It’s a solid choice for those looking for an affordable yet comprehensive spreadsheet solution.
  6. Airtable: Combining the functionality of spreadsheets and databases, Airtable offers a unique approach to data management. Its customizable and flexible nature makes it perfect for project management, content planning, and more.
  7. Smartsheet: Designed for project and work management, Smartsheet provides a robust platform for tracking and automating workflows. It’s particularly useful for teams needing advanced project planning and collaboration tools.

Why Do We Substitute for Excel?

Switching from Excel to another spreadsheet tool is more than finding an alternative. It’s about discovering solutions that might fit your needs even better. Here are reasons why people might opt for different spreadsheet software and how these alternatives can address various needs.

  • Cost: Excel can be pricey, especially for businesses needing multiple licenses. Many alternatives offer free or more affordable options without sacrificing essential features. This cost-effectiveness can be a game-changer for individuals and organizations.
  • Collaboration: In today’s interconnected world, real-time collaboration is crucial. Tools like Google Sheets excel in this area. They allow multiple users to work simultaneously on a document, making teamwork smoother and more efficient.
  • Compatibility: Not all devices or systems work well with Excel. Alternatives such as LibreOffice Calc and Apple Numbers offer greater compatibility with various operating systems. You can work seamlessly across different platforms.
  • Cloud-based solutions: With the shift towards remote work, cloud-based tools like Google Sheets and Zoho Sheets have become essential. They offer easy access from anywhere, automatic saving, and simple sharing options, making remote collaboration a breeze.
  • Customization and flexibility: Some alternatives provide unique features and customization options that Excel lacks. For example, Airtable combines database functionalities with traditional spreadsheets, offering unparalleled flexibility for diverse projects.
  • Open source: For those who value open-source software, LibreOffice Calc is an excellent choice. It’s free, customizable, and continuously updated by a dedicated community, ensuring it meets various needs.
  • Specialized needs: Different projects require different tools. Smartsheet, for instance, is tailored for project and work management, offering advanced features that cater to those needs. Choosing an alternative can mean getting a tool designed for your specific needs.
  • User preference: Sometimes, it’s simply about personal comfort and familiarity. Some users might prefer the interface or workflow of tools like WPS Office Spreadsheets or Apple Numbers over Excel. Finding a tool that feels right can significantly enhance productivity and satisfaction.

How to Choose Alternatives to Excel?

Choosing the right alternative to Excel can seem daunting, but it doesn’t have to be. Here’s a simple guide to help you find the perfect fit for your needs.

  1. Define your requirements: Identify what you need from a spreadsheet tool. Do you require advanced data analysis types, real-time collaboration, or specific compatibility? Knowing your must-haves will narrow down your options, ensuring you select a tool that not only meets your basic needs but also enhances your ability to perform various data analysis types effectively.
  2. Research options:
    • Look into the various alternatives available.
    • Explore tools like Google Sheets, LibreOffice Calc, and Airtable.
    • Compare features and see which ones align with your requirements.
  1. Test with a free trial: Many alternatives offer free trials or versions. Use these to get a feel for the software. Test out the features and see if it meets your expectations. This hands-on experience is invaluable.
  2. Consider user feedback: Read reviews and testimonials from other users. Learn from their experiences to understand the strengths and weaknesses of each tool. User feedback can provide insights that you might not have considered.
  3. Evaluate long-term viability:
    • Think about the future.
    • Consider the tool’s longevity, support, and updates.
    • Ensure it will continue to meet your needs as they evolve.

How to Use the Alternative of Excel?

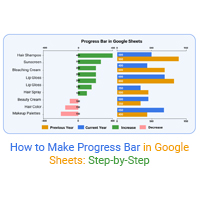
Are you tired of wrestling with Excel’s limited visualization capabilities and craving a more collaborative and dynamic tool? Enter Google Sheets, the savvy alternative to Excel, and ChartExpo, the ultimate visual storytelling sidekick.

Google Sheets and ChartExpo offer a treasure trove of advanced visualizations, including the Waterfall chart in Google Sheets, that Excel can only dream of. With Google Sheets and ChartExpo, data analysis becomes a thrilling adventure, not a tedious chore.

Bid adieu to Excel’s constraints. Embark on a visual journey with Google Sheets and ChartExpo the dynamic duo of data visualization.

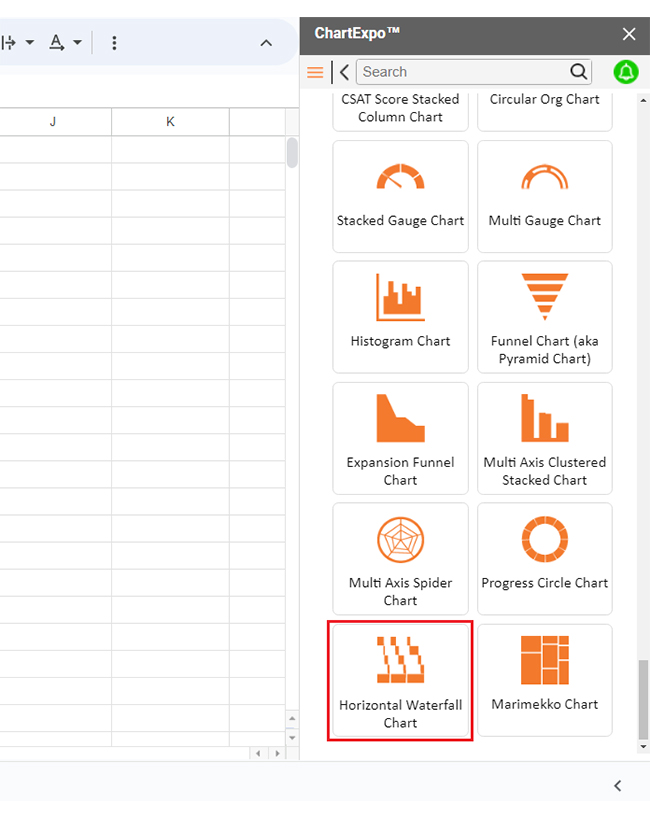
Let’s learn how to install ChartExpo in Google Sheets.

  1. To start using ChartExpo, download it directly from the Google Sheets program. To do this, select Extensions from the top toolbar.
  2. A menu will appear. Click the Get add-ons For Excel Mac option.
  3. Search for ChartExpo, and click on Charts, Graphs & Visualizations by ChartExpo when it appears in the results.
  4. Click the Install button. You will have to confirm your Google account and accept some permissions.

ChartExpo charts, which are advanced data visualization tools, are available both in Google Sheets and Microsoft Excel. Please use the following CTAs to install the tool of your choice and create beautiful visualizations in just a few clicks within your preferred platform.

Example

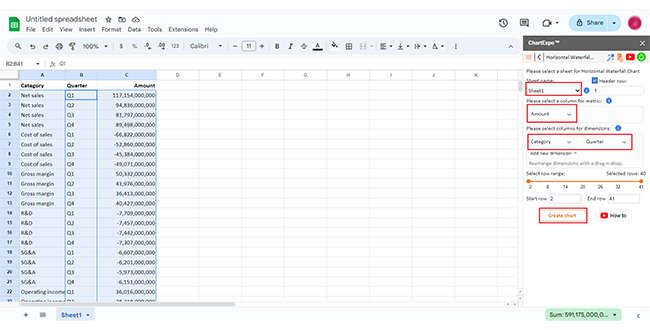
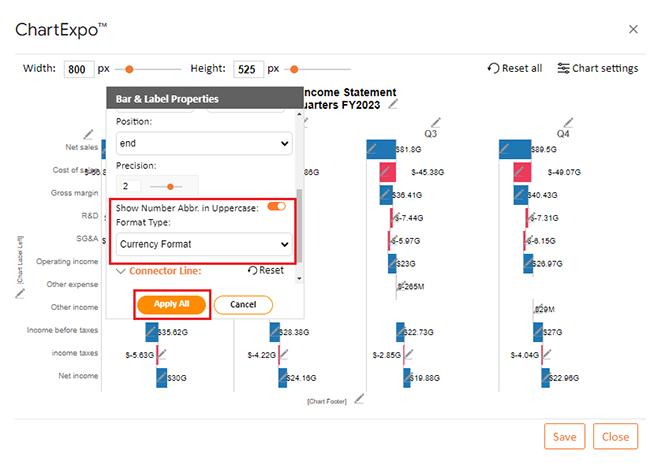
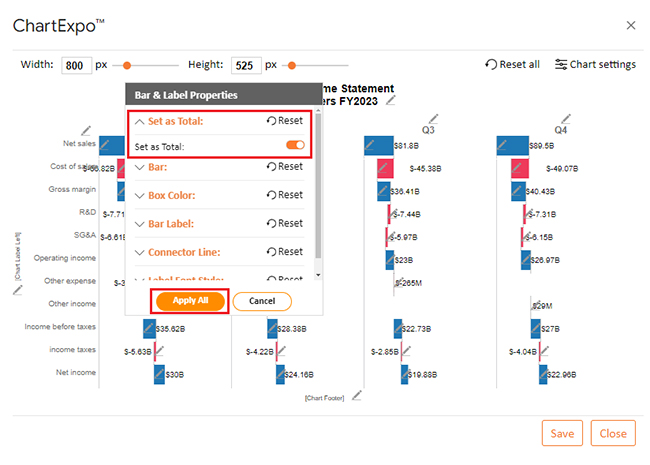
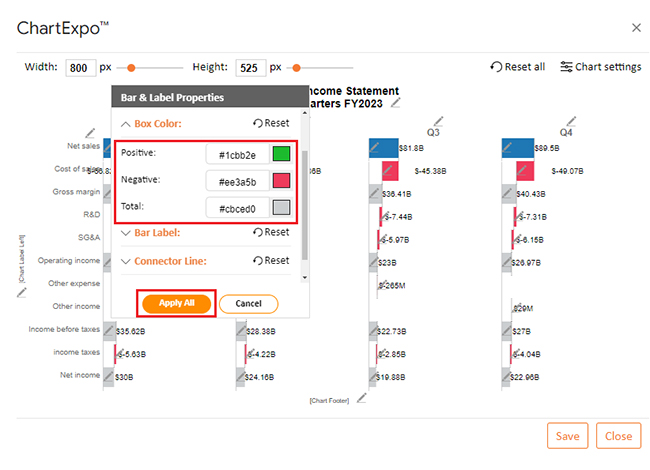
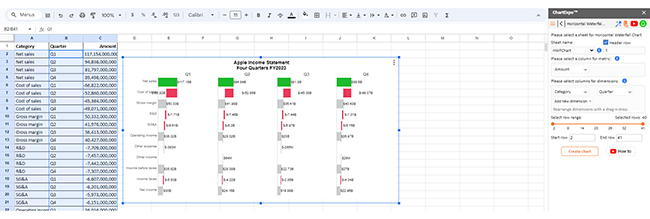
Let’s analyze the data below using ChartExpo and Google Sheets.

Category Quarter Amount
Net sales Q1 117,154,000,000
Net sales Q2 94,836,000,000
Net sales Q3 81,797,000,000
Net sales Q4 89,498,000,000
Cost of sales Q1 -66,822,000,000
Cost of sales Q2 -52,860,000,000
Cost of sales Q3 -45,384,000,000
Cost of sales Q4 -49,071,000,000
Gross margin Q1 50,332,000,000
Gross margin Q2 41,976,000,000
Gross margin Q3 36,413,000,000
Gross margin Q4 40,427,000,000
R&D Q1 -7,709,000,000
R&D Q2 -7,457,000,000
R&D Q3 -7,442,000,000
R&D Q4 -7,307,000,000
SG&A Q1 -6,607,000,000
SG&A Q2 -6,201,000,000
SG&A Q3 -5,973,000,000
SG&A Q4 -6,151,000,000
Operating income Q1 36,016,000,000
Operating income Q2 28,318,000,000
Operating income Q3 22,998,000,000
Operating income Q4 26,969,000,000
Other expense Q1 -393,000,000
Other income Q2 64,000,000
Other expense Q3 -265,000,000
Other income Q4 29,000,000
Income before taxes Q1 35,623,000,000
Income before taxes Q2 28,382,000,000
Income before taxes Q3 22,733,000,000
Income before taxes Q4 26,998,000,000
income taxes Q1 -5,625,000,000
income taxes Q2 -4,222,000,000
income taxes Q3 -2,852,000,000
income taxes Q4 -4,042,000,000
Net income Q1 29,998,000,000
Net income Q2 24,160,000,000
Net income Q3 19,881,000,000
Net income Q4 22,956,000,000
  • To get started with ChartExpo, install ChartExpo in Google Sheets.
  • Go to Extensions > Charts, Graphs & Visualizations by ChartExpo > Open.
open chartexpo in google sheets
  • To access the charts library, click the Add new chart button.
add new chart in google sheets
  • Once ChartExpo is loaded. Click on “Horizontal Waterfall chart”.
search horizontal waterfall chart in google sheets
  • First, insert the data table into the sheet. Then, select the Sheet name from the drop-down menu in the ChartExpo section.
  • Select the metric column; metric is the numeric column in your data sheet.
  • Select the dimensions column; the dimension is the categorical column in your datasheet that contains text information.
  • Click the Create chart button to complete the process.
Click Create Chart in Alternative of Excel
  • Your tabular data will turn into a Horizontal Waterfall chart, as shown below.
  • Click the Edit chart button to make custom changes.
Click Edit Chart in Alternative of Excel
  • To change the title of the chart, click the pencil icon next to the Chart Header.
  • It will open the properties dialog. Under the Text section, you can add a heading in Line 1 and enable the Show option. Give the appropriate title of your chart and click the Apply button.
Add Chart Header in Alternative of Excel
  • Add the dollar sign with both values by clicking on the pencil icon:
Add Prefix in Alternative of Excel
  • Now, you can set the format from number to currency.
Set Format to Currency in Alternative of Excel
  • You can set bars as “Set as Total”, meaning doesn’t float totals.
Set Bars as Set as Total in Alternative of Excel
  • You can set bar/box colors for positive, negative, and total (set as total) values/bars.
Change Colors of Bars in Alternative of Excel
  •  After making all changes, click the “Save” button:
Click Save in Alternative of Excel
  • The final visualization of the ” Horizontal Waterfall Chart ” is as follows:
Final Alternative of Excel
  • You can effortlessly add this chart to your Google Sheets working sheet by clicking the “Add chart to sheet” button.
Click Add Chart to Sheet in Alternative of Excel

Insights

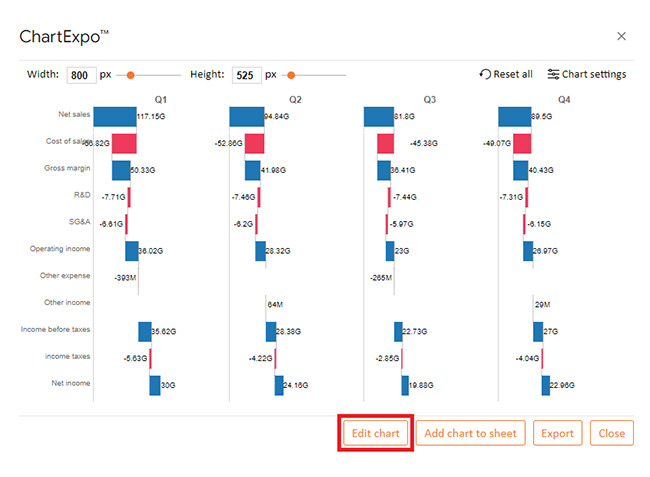
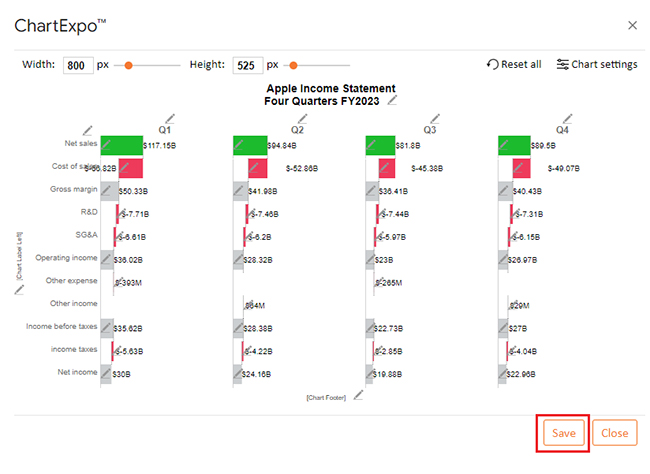
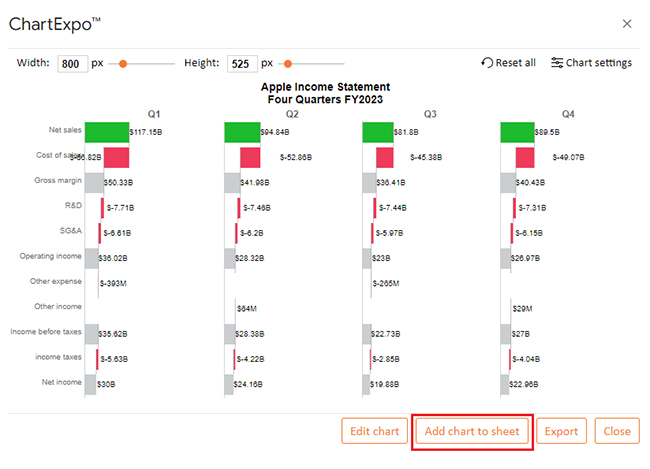
The data shows quarterly financial performance:

  • Net sales increase from Q1 to Q4.
  • Corresponding costs and margins rise.
  • Operating income follows a similar trend.
  • R&D and SG&A expenses stay stable.
  • Income before taxes fluctuates.
  • Net income peaks in Q1 and slightly declines in later quarters.

What are the Benefits of Excel Replacements?

Switching from Excel to another spreadsheet tool can open up a world of benefits. Whether you’re looking for cost savings or advanced features, these alternatives have something unique to offer. Let’s dive into the key benefits of Excel alternatives.

  • Cost savings: Many alternatives are more affordable or even free. This can significantly reduce expenses, especially for businesses needing multiple licenses.
  • Enhanced collaboration: Tools like Google Sheets allow real-time collaboration. Multiple users can work on the same document simultaneously, making teamwork seamless and efficient.
  • Better integration: Alternatives often integrate smoothly with other software. This enhances workflow by connecting your spreadsheet tool with other apps you use daily.
  • Advanced features and flexibility: Some tools offer features Excel lacks. For instance, Airtable combines database and spreadsheet functionalities, providing unparalleled flexibility for various projects.
  • User experience: Many users find alternatives more intuitive. Tools like Apple Numbers offer a visually appealing and user-friendly interface, enhancing productivity.
  • Cross-platform compatibility: Alternatives such as LibreOffice Calc work across different operating systems. This ensures you can access and edit your documents regardless of your device.
  • Open source and transparency: Open-source tools like LibreOffice Calc provide transparency and customization. A dedicated community continuously updates them, ensuring they meet various needs.
  • Security and privacy: Some alternatives prioritize data security and privacy. They offer robust encryption and data protection features, giving you peace of mind.
  • Performance: Alternatives often offer optimized performance. They handle large datasets and complex calculations efficiently, reducing lag and improving workflow.
  • Specialized functionality: Some tools cater to specific needs. For example, Smartsheet is designed for project management, offering advanced features tailored to those tasks.

FAQs

What is Excel’s biggest competitor?

Google Sheets is Excel’s biggest competitor. It’s a cloud-based spreadsheet tool that offers real-time collaboration. It’s accessible from any device with internet access and integrates seamlessly with other Google Workspace applications.

What is taking the place of Excel?

Google Sheets is increasingly replacing Excel. It offers cloud-based access and real-time collaboration. Other alternatives include Apple’s Numbers and Microsoft’s cloud-based Excel Online. These tools provide flexible, accessible, and collaborative solutions for spreadsheet tasks.

What is going to replace Excel?

Cloud-based tools like Google Sheets are poised to replace Excel. They offer real-time collaboration and easy access from any device. Other contenders include Apple’s Numbers and Microsoft’s Excel Online. These alternatives provide modern, flexible, and collaborative spreadsheet solutions.

Wrap Up

Excel has long been a powerful tool, but many excellent alternatives exist. These options provide unique features and can better suit different needs. Whether you’re looking for cost savings, better collaboration, or specialized functions, there’s an alternative for you.

Google Sheets is ideal for real-time collaboration. It’s easy to use and integrates well with other Google Workspace tools. This makes it perfect for teams working remotely.

LibreOffice Calc is a robust, open-source solution. It’s free and can handle complex data analysis. This makes it an excellent choice for budget users.

Apple Numbers stands out with its beautiful templates and user-friendly interface. It’s especially useful for Mac users. The visual appeal makes it great for creating professional-looking documents.

Zoho Sheet and WPS Office Spreadsheets offer versatile options with advanced features. They provide strong alternatives with familiar interfaces. They cater to those looking for affordability and comprehensive tools.

Airtable and Smartsheet offer specialized functionalities: Airtable combines spreadsheet and database features. Smartsheet is tailored for project management. These tools are perfect for specific project needs.

Exploring these alternatives can open new possibilities. Each tool offers unique advantages and can enhance your productivity. Consider your specific needs and try different options to find the best fit.

How much did you enjoy this article?

GSAd1
Start Free Trial!
137405

Related articles

next previous
Google Sheets11 min read

How to Create a Chart in Google Sheets in Few Steps?

Learn step-by-step how to create a chart in Google Sheets to visualize your data clearly and effectively, even if you're a beginner.

Google Sheets14 min read

How to Use Google Spreadsheet for Insightful Results

Learn how to use Google Sheets for data management. You’ll discover tips on adding data, using formulas, creating charts, and more to streamline your work.

Google Sheets11 min read

Commission Spreadsheet Template: An Easy Guide

A commission spreadsheet template ensures accuracy, saves time, and reduces errors. Learn its benefits and best practices for efficient commission tracking.

Google Sheets12 min read

How to Make Progress Bar in Google Sheets: Step-by-Step

Learn how to create a dynamic progress bar in Google Sheets to visually track goals, tasks, or project completion. Step-by-step guide with tips and examples.

Google Sheets11 min read

Travel Expenses Spreadsheet Template for Better Planning

A travel expenses spreadsheet template helps organize and manage trip costs. It simplifies budgeting, tracking, and reporting expenses in one place.

ChartExpo logo

Turn Data into Visual
Stories

CHARTEXPO

  • Home
  • Gallery
  • Videos
  • Services
  • Pricing
  • Contact us
  • FAQs
  • Privacy policy
  • Terms of Service
  • Sitemap

TOOLS

  • ChartExpo for Google Sheets
  • ChartExpo for Microsoft Excel
  • Power BI Custom Visuals by ChartExpo
  • Word Cloud

CATEGORIES

  • Bar Charts
  • Circle Graphs
  • Column Charts
  • Combo Charts
  • Comparison Charts
  • Line Graphs
  • PPC Charts
  • Sentiment Analysis Charts
  • Survey Charts

TOP CHARTS

  • Sankey Diagram
  • Likert Scale Chart
  • Comparison Bar Chart
  • Pareto Chart
  • Funnel Chart
  • Gauge Chart
  • Radar Chart
  • Radial Bar Chart
  • Sunburst Chart
  • see more
  • Scatter Plot Chart
  • CSAT Survey Bar Chart
  • CSAT Survey Chart
  • Dot Plot Chart
  • Double Bar Graph
  • Matrix Chart
  • Multi Axis Line Chart
  • Overlapping Bar Chart
  • Control Chart
  • Slope Chart
  • Clustered Bar Chart
  • Clustered Column Chart
  • Box and Whisker Plot
  • Tornado Chart
  • Waterfall Chart
  • Word Cloud
  • see less

RESOURCES

  • Blog
  • Resources
  • YouTube
SIGN UP FOR UPDATES

We wouldn't dream of spamming you or selling your info.

© 2025 ChartExpo, all rights reserved.