• Home
  • Tools dropdown img
    • Spreadsheet Charts

      • ChartExpo for Google Sheets
      • ChartExpo for Microsoft Excel
    • Power BI Charts

      • Power BI Custom Visuals by ChartExpo
    • Word Cloud

  • Charts dropdown img
    • Chart Category

      • Bar Charts
      • Circle Graphs
      • Column Charts
      • Combo Charts
      • Comparison Charts
      • Line Graphs
      • PPC Charts
      • Sentiment Analysis Charts
      • Survey Charts
    • Chart Type

      • Box and Whisker Plot
      • Clustered Bar Chart
      • Clustered Column Chart
      • Comparison Bar Chart
      • Control Chart
      • CSAT Survey Bar Chart
      • CSAT Survey Chart
      • Dot Plot Chart
      • Double Bar Graph
      • Funnel Chart
      • Gauge Chart
      • Likert Scale Chart
      • Matrix Chart
      • Multi Axis Line Chart
      • Overlapping Bar Chart
      • Pareto Chart
      • Radar Chart
      • Radial Bar Chart
      • Sankey Diagram
      • Scatter Plot Chart
      • Slope Chart
      • Sunburst Chart
      • Tornado Chart
      • Waterfall Chart
      • Word Cloud
    • Google Sheets
      Microsoft Excel
  • Services
  • Pricing
  • Contact us
  • Blog
  • Support dropdown img
      • Gallery
      • Videos
      • Contact us
      • FAQs
      • Resources
    • Please feel free to contact us

      atsupport@chartexpo.com

Categories
All Data Visualizations Data Analytics Surveys
Add-ons/
  • Google Sheets
  • Microsoft Excel
  • Power BI
All Data Visualizations Data Analytics Surveys
Add-ons
  • Google Sheets
  • Microsoft Excel
  • Power BI

We use cookies

This website uses cookies to provide better user experience and user's session management.
By continuing visiting this website you consent the use of these cookies.

Ok

ChartExpo Survey


Home > Blog > Data Analytics

What are Data Products: Everything You Need to Know

Raw data holds little value until it is structured, governed, and purposefully delivered to the people who need it most. Organizations that build reliable, reusable data solutions gain a measurable advantage in speed, quality, and strategic decision-making.

What are Data Products

Understanding what data products are is the essential starting point for any business ready to treat information as a competitive asset rather than an operational afterthought.

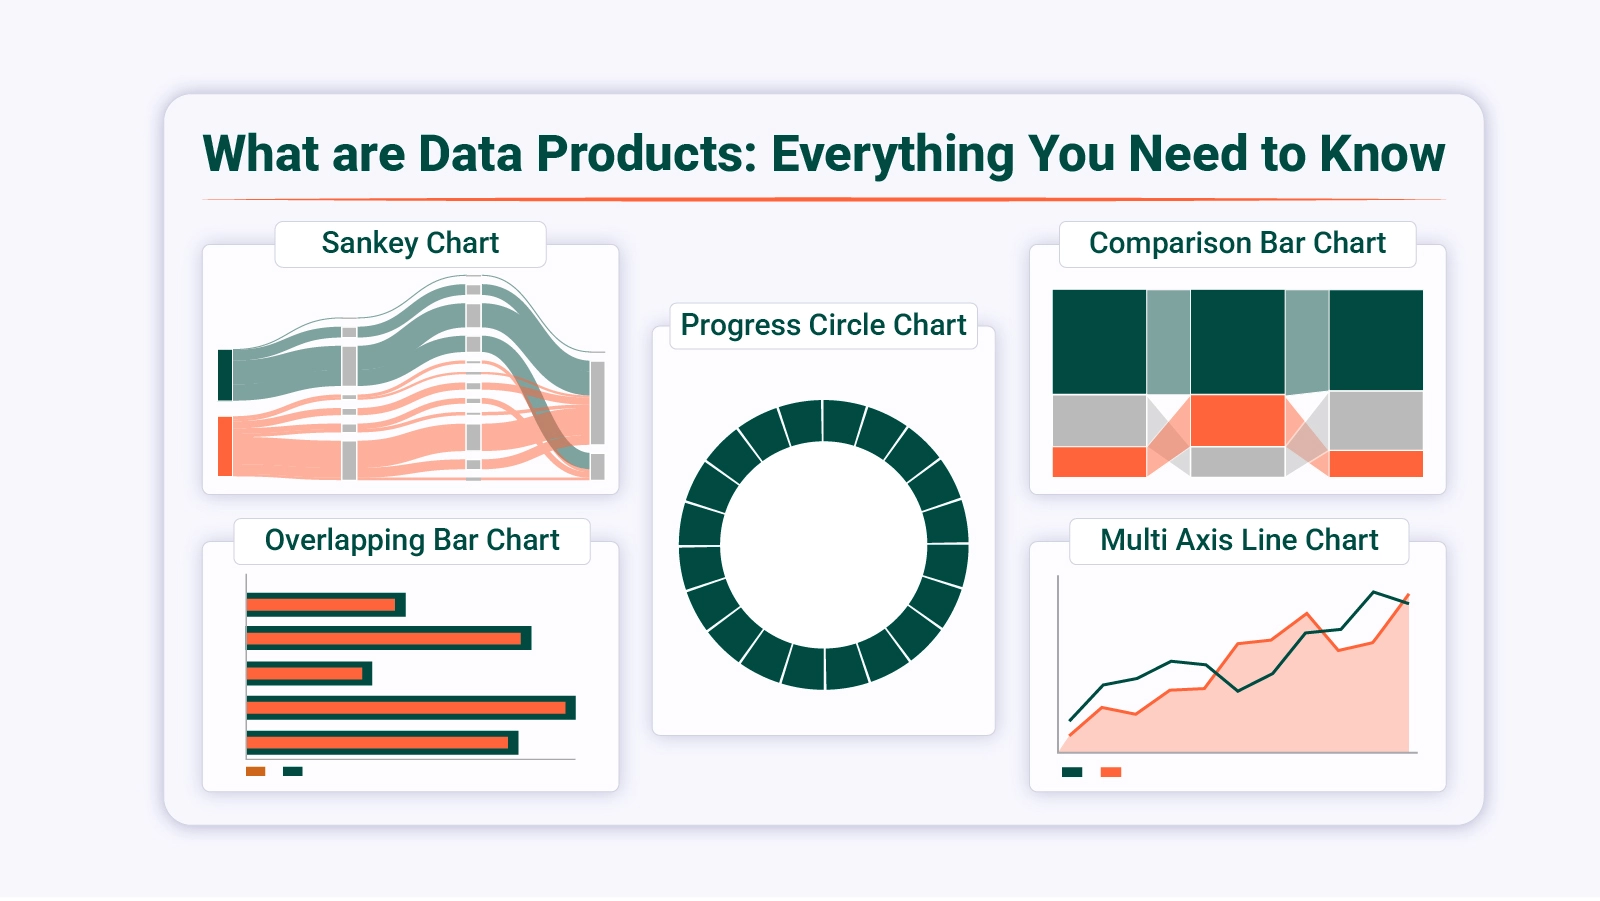
This blog covers the definition, key components, types, real-world examples, and a step-by-step design process for building effective data products. You will also learn how to analyze them in Excel and explore practical applications across diverse industries and business functions.

What are Data Products?

Definition: Data products are packaged, reusable solutions built from data to deliver value to analysts, executives, customers, or automated systems. Unlike raw datasets, they arrive structured, governed, and designed with a specific purpose built in from the start.

Their function is to convert fragmented or complex information into something immediately actionable, such as a dashboard, a predictive model, or a data API. They connect technical infrastructure to business decisions.

Familiar forms of data products include customer performance dashboards, fraud detection engines, and recommendation systems. In mature analytics environments, they serve as the conduit through which insights move from storage to the people who act on them.

Why are Data Products Important?

Building what data products into core operations turns data assets into accessible, business-ready tools. Here is why this approach has become a priority for modern enterprises:

  • Enable data-driven decision making: Deliver real-time, accurate insights to those making strategic and operational choices.
  • Improve operational efficiency: Automate repetitive reporting cycles to cut errors and free team capacity.
  • Facilitate analytics at scale: Sustain performance as data volumes and user counts grow.
  • Standardize data consumption: Keep metrics uniform across dashboards using shared, trusted definitions.
  • Support cross-functional collaboration: Align teams through common data views that reduce information silos.
  • Enhance data quality and governance: Embed validation, security, and compliance controls into delivery pipelines.
  • Unlock new business insights: Expose patterns across datasets that drive innovation and competitive growth.

Key Components of Data Products

Every reliable implementation of data products rests on interconnected components that ensure usability and stability. Key components include:

  • Data sources and pipelines: Consolidate data from multiple systems into a unified processing environment.
  • Storage and data infrastructure: Securely store large volumes on scalable, high-availability platforms.
  • APIs and access layers: Provide structured, permission-based access for users and applications.
  • Analytics and reporting capabilities: Transform raw data into dashboards and decision-ready outputs.
  • Metadata and documentation: Supply definitions and lineage so users understand what they are consuming.
  • Security and compliance measures: Protect data through encryption, access controls, and governance policies.
  • Monitoring and maintenance processes: Track performance continuously to keep outputs accurate and reliable.

Data Products vs. Data as a Product: Key Differences

Aspect

Data Products

Data as a Product

Definition End-to-end solution built to deliver insights Treating datasets themselves as sellable assets
Focus Usability and business outcomes Data ownership and monetization
Users Internal teams, customers, systems External buyers or partners
Structure Includes pipelines, analytics, and interfaces Primarily structured datasets
Goal Drive decisions and automation Commercialize data assets

Characteristics of Data Products

Recognizing what data products are also means understanding the traits that make them effective and trustworthy.

Key characteristics include:

  • Reusable and self-contained: Operate across teams and use cases without structural modification.
  • Well-documented and discoverable: Provide metadata that helps users locate and interpret relevant data.
  • Governed and secure: Follow compliance standards and enforced access policies.
  • Scalable and performant: Sustain speed and reliability under growing volumes and user demand.
  • Reliable and tested: Produce validated outputs through built-in quality checks.
  • Supports decision-making: Deliver insights suited to both strategic and operational use.

Types of Data Products

Understanding what data products are starts with recognizing the different architectures businesses deploy based on need and maturity. Among the most common examples of data products are the following types:

  • Analytical data products: Aggregate and model data into reports that support strategic planning and executive decision-making.
  • Operational data products: Deliver current or near-current data to power routine business workflows and real-time actions.
  • Machine learning models as products: Generate predictive or prescriptive outputs, such as demand forecasts and product recommendations, through automated systems.
  • APIs and data services: Offer structured, secure access to curated datasets for internal applications, partners, or third-party integrations.
  • Data dashboards and reports: Present performance metrics and business indicators visually for ongoing monitoring and evaluation.

Examples of Data Products

Seeing what data products are in practice, through real-world examples of data products, clarifies the tangible impact they create across business functions.

Below are three widely used implementations:

1. Customer 360 Dashboards

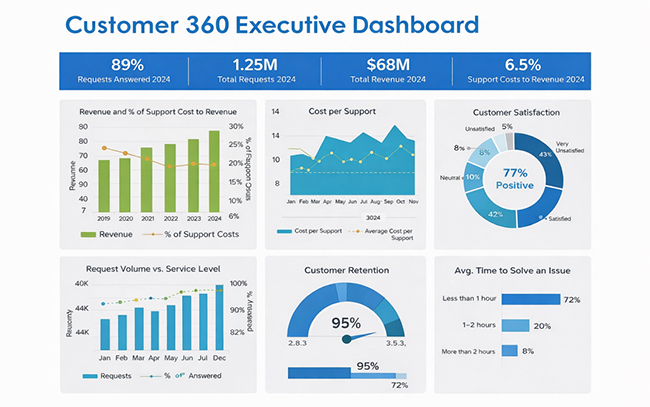
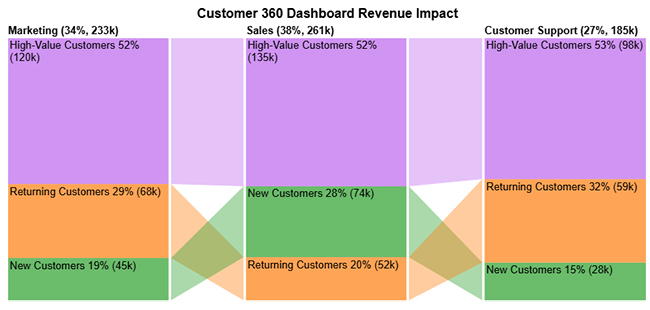
The Customer 360 executive dashboard is one of the most practical data visualization examples in Excel, bringing together revenue, retention, satisfaction, and service performance into a single executive-facing view.

What are Data Products

2. Recommendation Engines

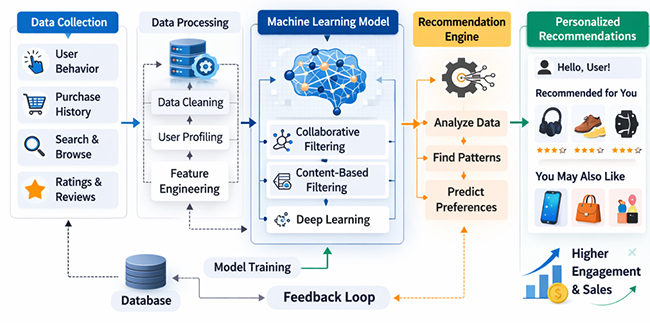
Platforms like Amazon rely on machine learning-driven recommendation engines to surface personalized product suggestions. These systems lift both user experience and revenue by applying predictive analysis to behavioral patterns.

What are Data Products

3. Financial Reporting Pipelines

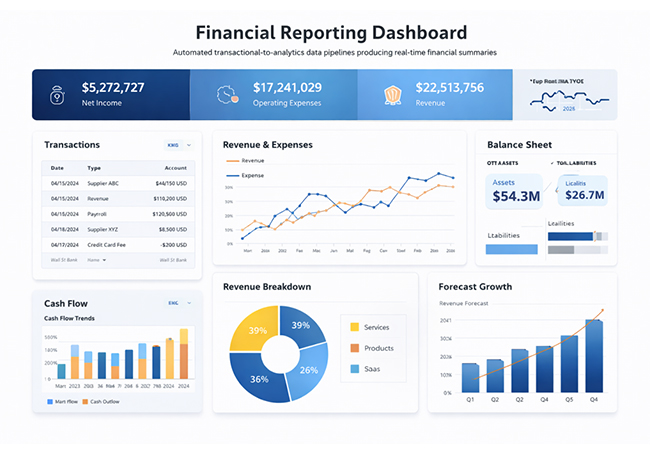
Automated financial reporting pipelines connect transactional systems with analytics platforms to generate real-time summaries that support both compliance requirements and forward-looking financial forecasts.

What are Data Products

How to Design Data Products?

Knowing data products is one thing; building them effectively requires a structured process that keeps technical execution aligned with clear business goals and measurable outcomes.

Step 1: Identify Business Requirements

Clearly define the business problem, stakeholders, expected outcomes, and measurable success criteria before development begins.

Step 2: Gather and Integrate Relevant Data

Collect information from across systems and consolidate it using structured processes such as data merging in Excel to ensure completeness and alignment with business requirements.

Step 3: Cleanse and Transform Data

Standardize and prepare datasets through techniques like data transformation in Excel to improve data consistency, reliability, and readiness for analysis.

Step 4: Define Metrics and KPIs

Establish clear performance indicators that tie analytics outputs directly to strategic business goals and provide a measurable basis for evaluating success.

Step 5: Build Analytics or ML Models

Develop dashboards, reporting frameworks, or predictive models based on validated and structured datasets.

Step 6: Deploy, Monitor, and Maintain

Continuously track system performance, refine logic, and update workflows to ensure sustainable impact.

Top 5 Data Product Use Cases

1. Customer 360 Dashboard Revenue Impact

This Customer 360 example illustrates what are data products in a revenue context: High-Value Customers dominate revenue across Marketing, Sales, and Customer Support, with Sales contributing the highest overall total.

What are Data Products

2. Cash Inflows and Outflows by Department

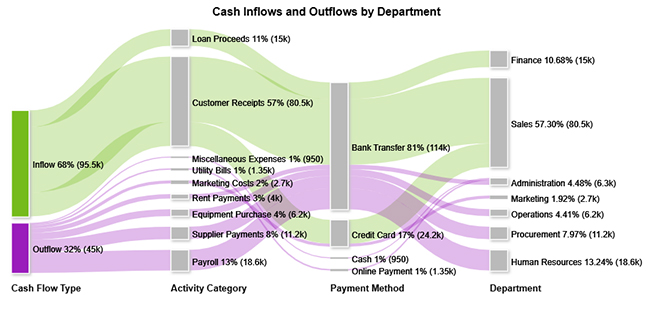
The Cash Inflows and Outflows by Department visual maps how funds move from inflow and outflow sources through payment methods to final departmental allocation.

What are Data Products

3. Impact of Sales Follow-Ups on Conversions & Pipeline

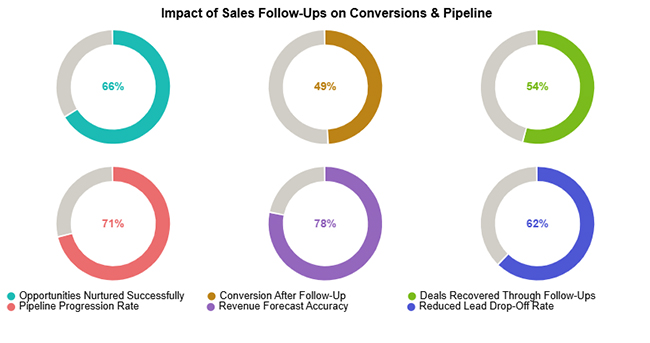
The Impact of Sales Follow-Ups on Conversions & Pipeline example shows what are data products can reveal about sales performance: follow-up activity strengthens conversions, pipeline progression, revenue accuracy, and lead retention.

What are Data Products

4. Monthly E-commerce Growth and Platform Adoption Trends

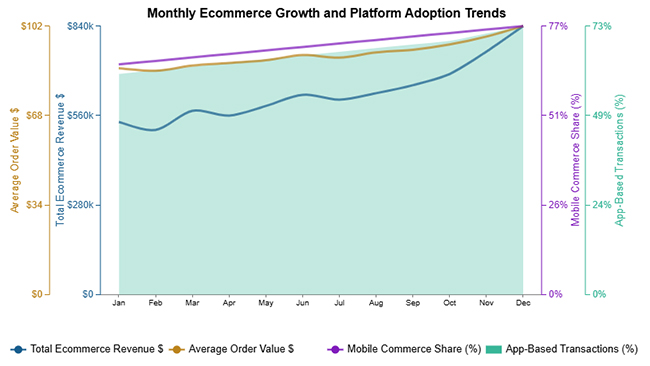
The Monthly Ecommerce Growth and Platform Adoption Trends visual tracks revenue growth, average order value, and digital adoption metrics to measure overall ecommerce performance over time.

What are Data Products

5. Budgeted vs Actual Revenue by Sales Channel

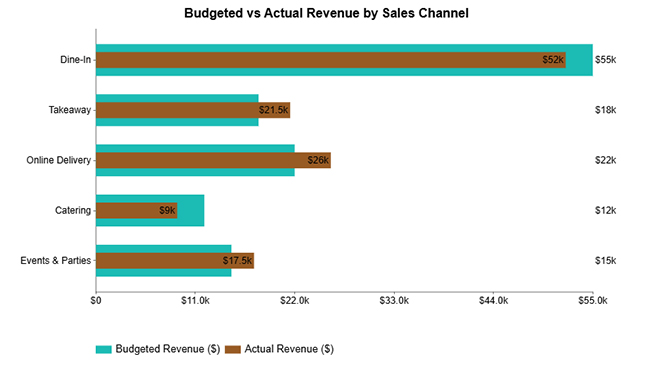
The Budgeted vs Actual Revenue by Sales Channel comparison evaluates planned and realized performance across channels to identify revenue gaps and optimization opportunities.

What are Data Products

How to Analyze a Data Product in Excel?

Analyzing a data product in Excel helps you uncover patterns, measure performance, and make data-driven decisions. Follow these steps to get meaningful insights:

Step 1: Import and Organize Your Data

Start by importing your data into Excel. Ensure it is clean and well-structured, with clear column headers and no duplicate or missing values. Proper organization makes analysis easier and more accurate.

Step 2: Understand Key Metrics

Identify the key metrics relevant to your data product, such as user engagement, conversion rates, or usage trends. Focusing on the right metrics ensures your analysis aligns with your goals.

Step 3: Apply Excel Functions

Use built-in Excel functions like SUM, AVERAGE, COUNT, and IF to summarize your data. These functions help you quickly calculate totals, averages, and conditions for better insights.

Step 4: Create Visualizations

Convert your data into charts such as bar charts, line graphs, or pie charts. For more advanced and interactive visuals, you can use ChartExpo to create insightful dashboards without complex steps.

Step 5: Identify Trends and Insights

Analyze your charts to spot patterns, trends, and anomalies. Look for changes over time or differences between categories to understand your data product’s performance.

Step 6: Adding Final Visualization View

Include a final visualization using a comparison bar chart to clearly present how your data product segments differ across categories or time periods. For example, the chart can compare segments such as High-Value Customers, New Customers, and Returning Customers, showing their proportions side by side.

What are Data Products

Key Insights

  • High-Value Customers hold the top revenue position across all three departments.
  • Sales generate the most total revenue, led by High-Value and New Customer segments.
  • Customer Support performs best with Returning Customers but records the lowest output from New Customer interactions.

Benefits of Using Data Products

Organizations that fully understand what data products are and adopt them gain measurable advantages across every team and function. Key benefits include:

  • Faster insights and decision-making: Access real-time analytics to reduce the gap between data and action.
  • Improved data consistency: Standardize metrics using data modeling in Excel to maintain a single source of truth.
  • Increased collaboration: Share dashboards to align team priorities and improve coordination.
  • Enhanced automation: Replace manual reporting with analytics workflows that require minimal intervention.
  • Better data governance: Tighten security, compliance, and validation controls across delivery pipelines.
  • Scalable analytics solutions: Handle growing data volumes and user counts without performance loss.

Use Cases of Data Products

Once teams grasp data products, they can deploy them across industries and operational contexts to drive real impact. Use cases include:

  • Marketing analytics and segmentation: Refine campaign targeting and audience profiling through structured approaches informed by data discovery.
  • Customer behavior tracking: Analyze purchase patterns and interaction history to personalize experiences at scale.
  • Operational performance monitoring: Track KPIs in real time to pinpoint inefficiencies and improve productivity.
  • Predictive maintenance in manufacturing: Anticipate equipment failures using historical sensor data to minimize unplanned downtime.
  • Financial reporting and compliance: Automate regulatory submissions to ensure accuracy, transparency, and timely delivery.
  • Product recommendation systems: Personalize and rank product offerings using techniques that help visualize ranking data for comparison analysis.

FAQs

What is the difference between a data product and an API?

An API enables systems to exchange data, while data products are complete, outcome-focused solutions that may incorporate APIs alongside analytics, governance, and reporting layers.

What is a data product vs. a data asset?

A data asset is a raw or processed dataset owned by an organization, while data products are structured solutions built on top of those assets to deliver insights or automation.

Is SAP a data product?

SAP provides enterprise resource planning and analytics tools that support the creation of data products, but the platform itself is not a standalone data product.

Wrap Up

Understanding what are data products changes how organizations approach information: not as a byproduct, but as a deliberate asset. Well-structured and governed solutions make data accessible, reliable, and decision-ready across every business function. The value lies not only in what they reveal but in how consistently they deliver it.

The real question is no longer whether to adopt them, but how quickly to act. What are data products if not the practical bridge between raw data and measurable outcomes? By combining well-designed pipelines, analytics frameworks, and powerful visualization tools, organizations can convert complexity into clarity and translate insight into sustained competitive advantage.

How much did you enjoy this article?

PBIAd1
Start Free Trial!
160404

Related articles

next previous
Data Analytics8 min read

SaaS Dashboard: A Complete Walkthrough

Dashboard for SaaS shows revenue, churn, usage, and retention in one view. See metrics, examples, and build steps in Power BI. Read on!

Data Analytics7 min read

Employee Turnover Rate: Definition, Formula & Insights

Employee Turnover Rate shows where exits rise, how to measure change, and what numbers mean in Excel. See the formula, examples, and steps. Read on!

Data Analytics11 min read

Primary vs Secondary Research: Which Method Is Better?

Primary vs secondary research shapes data quality and analytical outcomes. Learn the key differences and when to use each method. Discover now!

Data Analytics12 min read

Staff Onboarding Template: Insights for HR Decisions

Staff onboarding template: discover how to build, track, and analyze a process that gets new hires productive from day one. Read on!

Data Analytics10 min read

What are DORA Metrics: A Complete Guide

What are DORA Metrics? Discover the four KPIs every engineering team needs to track delivery speed, stability, and reliability. Read on!

ChartExpo logo

Turn Data into Visual
Stories

CHARTEXPO

  • Home
  • Gallery
  • Videos
  • Services
  • Pricing
  • Contact us
  • FAQs
  • Privacy policy
  • Terms of Service
  • Sitemap

TOOLS

  • ChartExpo for Google Sheets
  • ChartExpo for Microsoft Excel
  • Power BI Custom Visuals by ChartExpo
  • Word Cloud

CATEGORIES

  • Bar Charts
  • Circle Graphs
  • Column Charts
  • Combo Charts
  • Comparison Charts
  • Line Graphs
  • PPC Charts
  • Sentiment Analysis Charts
  • Survey Charts

TOP CHARTS

  • Sankey Diagram
  • Likert Scale Chart
  • Comparison Bar Chart
  • Pareto Chart
  • Funnel Chart
  • Gauge Chart
  • Radar Chart
  • Radial Bar Chart
  • Sunburst Chart
  • see more
  • Scatter Plot Chart
  • CSAT Survey Bar Chart
  • CSAT Survey Chart
  • Dot Plot Chart
  • Double Bar Graph
  • Matrix Chart
  • Multi Axis Line Chart
  • Overlapping Bar Chart
  • Control Chart
  • Slope Chart
  • Clustered Bar Chart
  • Clustered Column Chart
  • Box and Whisker Plot
  • Tornado Chart
  • Waterfall Chart
  • Word Cloud
  • see less

RESOURCES

  • Blog
  • Resources
  • YouTube
SIGN UP FOR UPDATES

We wouldn't dream of spamming you or selling your info.

© 2026 ChartExpo, all rights reserved.