• Home
  • Tools dropdown img
    • Spreadsheet Charts

      • ChartExpo for Google Sheets
      • ChartExpo for Microsoft Excel
    • Power BI Charts

      • Power BI Custom Visuals by ChartExpo
    • Word Cloud

  • Charts dropdown img
    • Chart Category

      • Bar Charts
      • Circle Graphs
      • Column Charts
      • Combo Charts
      • Comparison Charts
      • Line Graphs
      • PPC Charts
      • Sentiment Analysis Charts
      • Survey Charts
    • Chart Type

      • Box and Whisker Plot
      • Clustered Bar Chart
      • Clustered Column Chart
      • Comparison Bar Chart
      • Control Chart
      • CSAT Survey Bar Chart
      • CSAT Survey Chart
      • Dot Plot Chart
      • Double Bar Graph
      • Funnel Chart
      • Gauge Chart
      • Likert Scale Chart
      • Matrix Chart
      • Multi Axis Line Chart
      • Overlapping Bar Chart
      • Pareto Chart
      • Radar Chart
      • Radial Bar Chart
      • Sankey Diagram
      • Scatter Plot Chart
      • Slope Chart
      • Sunburst Chart
      • Tornado Chart
      • Waterfall Chart
      • Word Cloud
    • Google Sheets
      Microsoft Excel
  • Services
  • Pricing
  • Contact us
  • Blog
  • Support dropdown img
      • Gallery
      • Videos
      • Contact us
      • FAQs
      • Resources
    • Please feel free to contact us

      atsupport@chartexpo.com

Categories
All Data Visualizations Data Analytics Surveys
Add-ons/
  • Google Sheets
  • Microsoft Excel
  • Power BI
All Data Visualizations Data Analytics Surveys
Add-ons
  • Google Sheets
  • Microsoft Excel
  • Power BI

We use cookies

This website uses cookies to provide better user experience and user's session management.
By continuing visiting this website you consent the use of these cookies.

Ok

ChartExpo Survey


Home > Blog > Microsoft Excel

CSV vs. Excel: A Quick Comparison for Everyday

CSV vs Excel—which format works better for data management? This question comes up in boardrooms, classrooms, and home offices every day. And the answer isn’t always straightforward. Each format serves a different purpose, and choosing the wrong one can result in revenue loss.

CSV vs. Excel

CSV files are lightweight and fast. They open in seconds. No formulas. No formatting. Just raw data. That’s why many developers and data engineers prefer them. They’re great for transferring data between systems without any extra baggage.

But Excel brings more than data. It brings structure, formulas, and visuals. Professionals in finance, marketing, and education often rely on Excel’s features for deeper analysis. Need to build a dashboard? Excel handles it. Want conditional formatting or pivot tables? Excel wins again.

The difference between the two affects workflow. A business might store customer data in CSV for database import, but use Excel to analyze quarterly trends. Teachers may use CSV for attendance tracking, but rely on Excel for gradebooks and dashboard templates.

Meanwhile, new tech is making Excel even smarter. Artificial intelligence in Excel can now detect patterns, suggest functions, and even clean data automatically. CSV can’t do that.

Let’s dive deeper into this debate.

First…

Table of Contents:

  1. What is a CSV File vs Excel?
  2. Why Use CSV vs. Excel Format?
  3. Difference Between CSV vs. XLSX Files
  4. Similarities of Excel vs. CSV
  5. Excel vs CSV: A Detailed Comparison
  6. How to Analyze CSV vs. Excel Files in Excel?
  7. CSV vs. Xlsx: Benefits
  8. Best Practices for Handling CSV and Excel Files
  9. FAQs
  10. Wrap Up

What is a CSV File vs Excel?

Definition: A CSV file stands for Comma-Separated Values. It stores data in plain text, with commas separating each value. It’s simple and easy to read across platforms. Excel, on the other hand, is a spreadsheet software with features such as formulas, formatting, and charts.

Excel supports richer data manipulation. People often use custom sorting in Excel or perform What-if analysis in Excel—features not available in CSV. So, while both handle data, Excel offers more tools for in-depth analysis.

Why Use CSV vs. Excel Format?

You wouldn’t wear hiking boots to a beach party. Choosing between CSV and Excel works similarly—it depends on the task. Let’s break it down with quick, clear reasons for picking one over the other:

  • File size: CSV files are smaller because they contain no formatting, formulas, or extra features. That makes them faster to load and easier to share.
  • Compatibility: CSV files work with almost any software, from databases to programming languages. They’re ideal for cross-platform data exchange.
  • Speed: Opening a large CSV file is quicker than opening an Excel file of the same data. It’s stripped down and focused only on the values.
  • Visuals and formatting: Excel provides a range of colors, charts, and styles to enhance readability and presentation. CSV can’t store any of that—it’s just raw data.
  • Formulas and functions: Want calculations that update automatically? Excel lets you use formulas, like GETPIVOTDATA in Excel, while CSV doesn’t support any.
  • Advanced tools: Excel gives you built-in tools for custom sorting and what-if analysis. Those tools can help you model scenarios and spot trends quickly.

Difference Between CSV vs. XLSX Files

Have you ever opened a file and wondered why it ends in .csv instead of .xlsx? That tiny difference means a lot. One is raw and fast. The other is smart and full of features.

Here’s a side-by-side look that makes the choice crystal clear:

Feature CSV File XLSX (Excel) File
Data Format Plain text, comma-separated. Structured spreadsheet with cells.
Speed Opens fast. Slower with large data sets.
Sorting & Filtering Basic sorting via external tools. Built-in features like custom sorting in Excel.
Compatibility Universal (across platforms & systems). Best with Microsoft products.
Size Smaller. Larger due to added features.
Use Case Data transfer, automation, backups. Data analysis, presentations, and planning.

Similarities of Excel vs. CSV

CSV and Excel might seem like total opposites—one’s plain, the other polished. But believe it or not, they share some common ground. Think of them as two roads leading to the same data destination, just with different scenery.

  • Both store data: At their core, both formats hold structured data in rows and columns. Whether it’s sales numbers or student grades, they get the job done.
  • Spreadsheet-friendly: Both formats are compatible with spreadsheet software. You can edit, sort, and analyze data in either one.
  • Widely used in business: From finance to education, both formats are staples. They support tasks such as reporting and planning. For instance, Excel for teachers helps to manage grades and attendance.
  • Easy to share: Both CSV and Excel files can be easily emailed or uploaded. File size may vary, but both travel well.
  • Import-ready: Many platforms accept both file types for uploads. Whether you’re feeding data into software or converting text files to Excel, both formats play well with others.

Excel vs CSV: A Detailed Comparison

Choosing between Excel and CSV can feel like picking between power and precision. One brings features, the other brings speed. Both are useful, but for very different reasons. Let’s stack them side by side and see how they compare:

Feature Excel (.xlsx) CSV (.csv)
Multiple Sheets Supports multiple tabs in one file. Limited to one table per file.
Built-In Features Rich tools like formulas, pivot tables, and what-if analysis in Excel. No built-in tools—manual or external tools required.
AI Integration Smart features with artificial intelligence in Excel for predictions and suggestions. No AI or intelligent processing.
Data Sharing Better for sharing with context (charts, labels, notes). Better for backend systems, APIs, or data migrations.
Data Size Handling Handles large files but may slow down with heavy features. Loads faster, even with large datasets.
Conversion & Flexibility Great for converting text files to Excel with full formatting control. It can be created or exported from almost any tool.

Top 5 Visuals by ChartExpo in Excel While Comparing CSV vs Excel

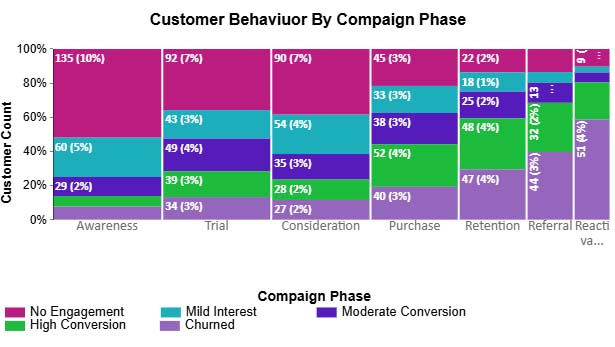
Staring at rows of data in Excel can be exhausting. Visuals make the message clear in seconds—and that’s precisely what ChartExpo’s charts do. Here are five powerful visuals that bring your spreadsheets to life, helping you make faster, smarter decisions:

  • Comparison Bar Chart: This chart compares values across categories side by side, making it easy to spot trends. It’s perfect for breaking down campaign results or department growth across dashboard templates in Excel.
CSV vs. Excel
  • Stacked Waterfall Chart: It shows how each value—positive or negative—impacts the final total. This chart is ideal for financial breakdowns. It’s beneficial when the steps in your analysis need to be crystal clear.
CSV vs. Excel
  • Gauge Chart: This chart utilizes a dial to display performance against a target, providing a quick snapshot of progress. It works seamlessly in Excel to monitor KPIs and pairs well with artificial intelligence for predictive insights.
CSV vs. Excel
  • Mosaic Chart: It displays categorical data using proportionally sized blocks, making it easy to compare groups across different stages. The Mosaic Chart is great for tracking customer behavior or campaign performance across regions using data from frequency tables in Excel.
CSV vs. Excel
  • Multi Axis Spider Chart: This radar-style chart compares multiple variables at once, revealing strengths and weaknesses through shape and symmetry. It’s perfect for showcasing team skills, product features, or even doing a visual what-if analysis in Excel.
CSV vs. Excel

How to Analyze CSV vs. Excel Files in Excel?

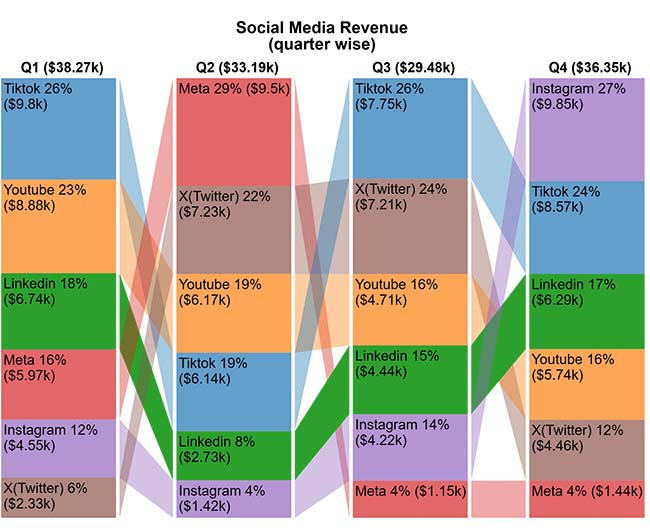
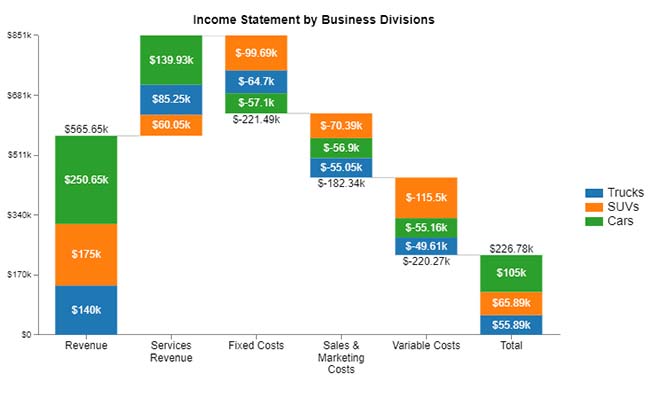
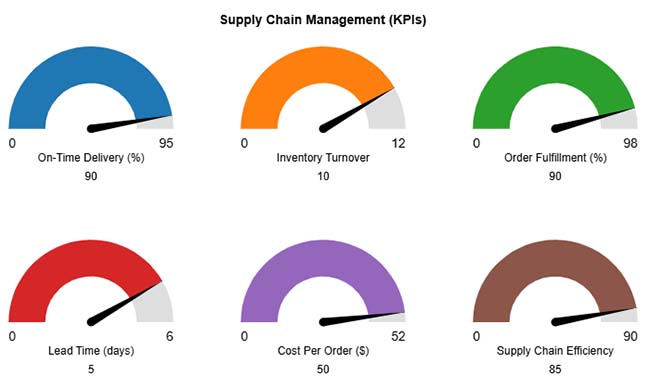
Spreadsheets are savvy—until they’re not. CSV vs. Excel might help you organize data, but analyzing it? That’s a different story. Numbers don’t speak unless you make them. That’s where data visualization changes the game. It turns rows into revelations.

But let’s be honest—Excel’s built-in charts often fall flat. They are limited, clunky, and frustrating.

You want insights, not eye strain. Enter ChartExpo—a tool that makes your data not only speak but shout clearly. Clean visuals, quick insights, no headaches.

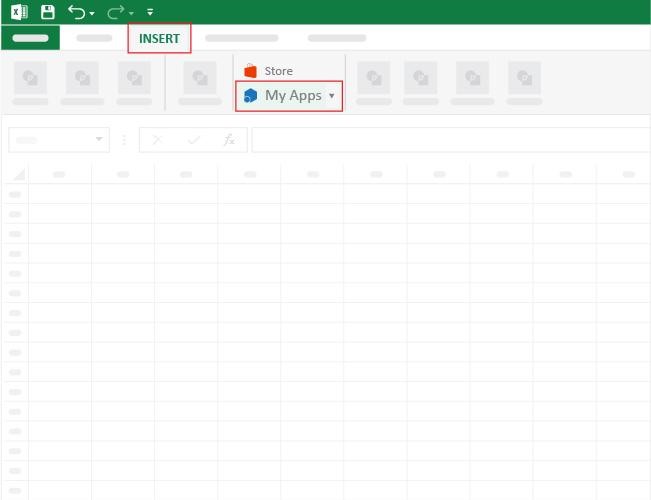
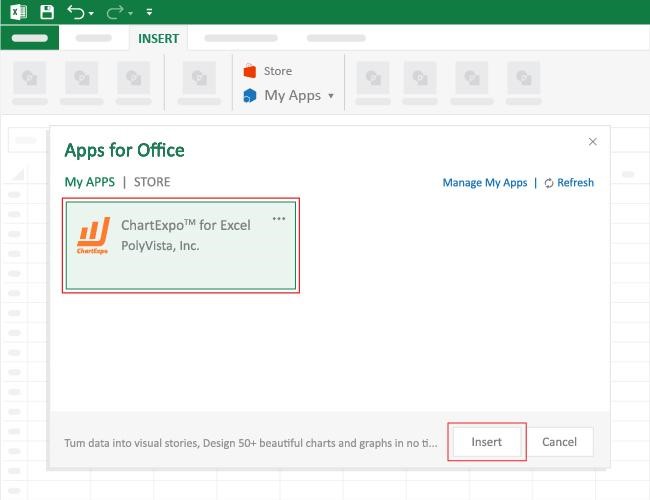
How to Install ChartExpo in Excel?

  1. Open your Excel application.
  2. Open the worksheet and click the “Insert” menu.
  3. You’ll see the “My Apps” option.
  4. In the Office Add-ins window, click “Store” and search for ChartExpo on My Apps Store.
  5. Click the “Add” button to install ChartExpo in your Excel.

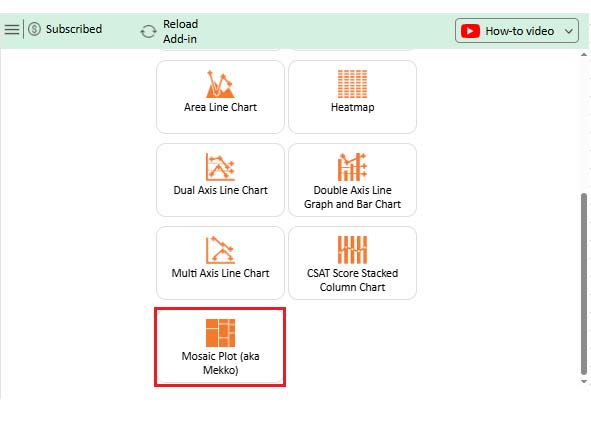
ChartExpo charts are available both in Google Sheets and Microsoft Excel. Please use the following CTAs to install the tool of your choice and create beautiful visualizations with a few clicks in your favorite tool.

Example

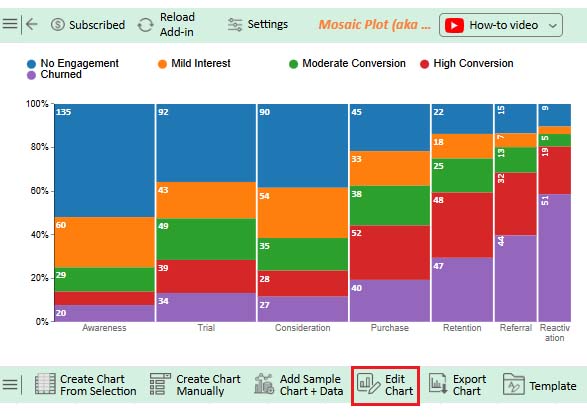
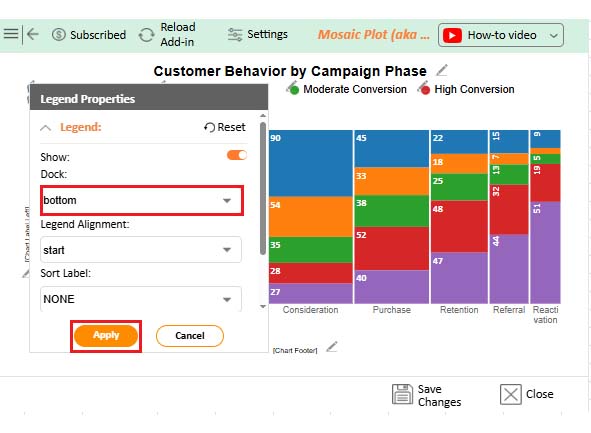
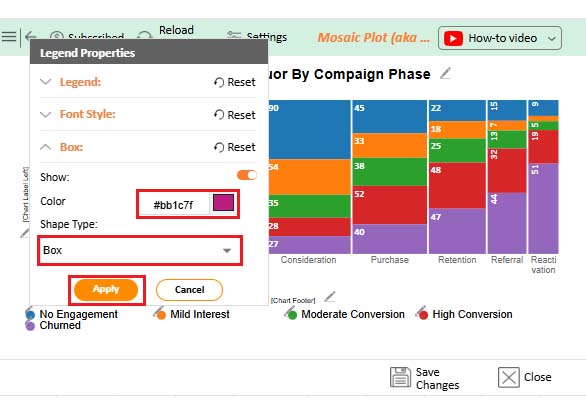
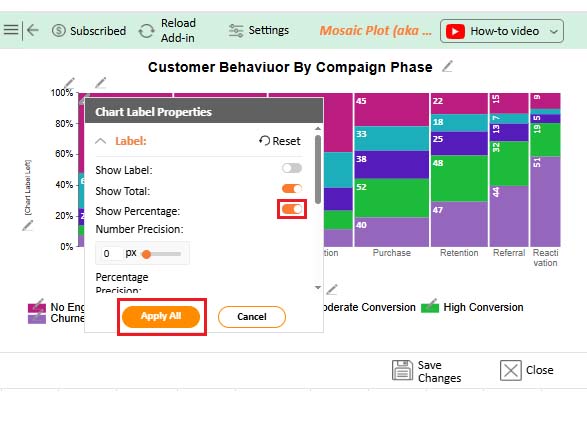
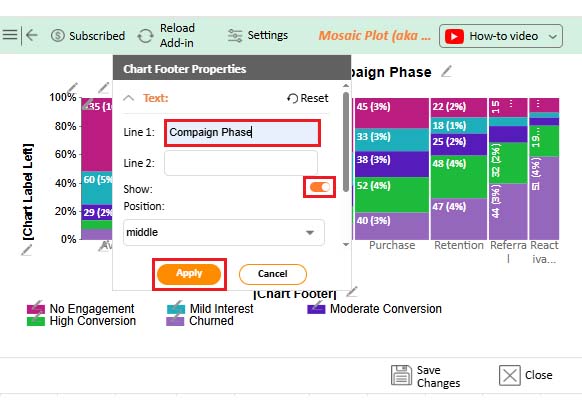
Let’s see what Excel software is used for in data analysis using ChartExpo.
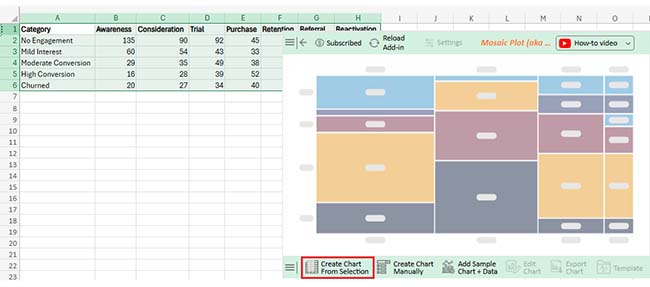
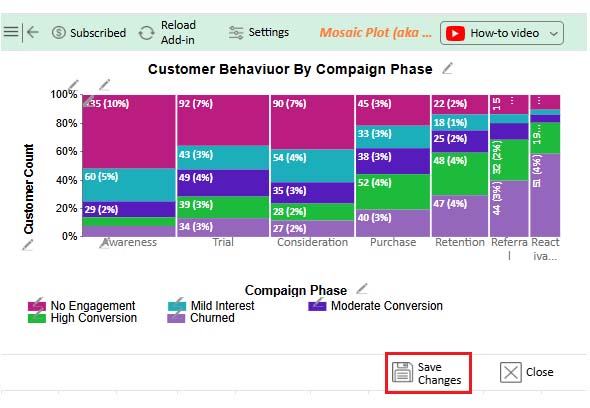
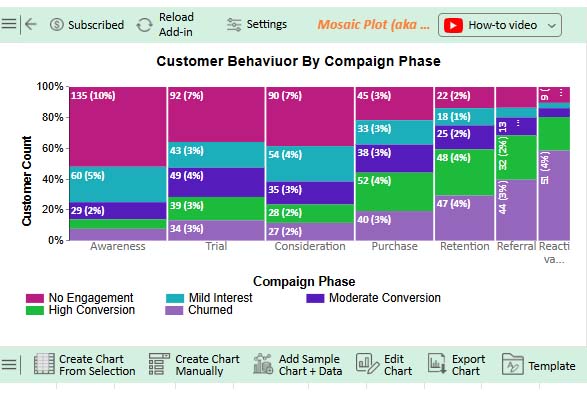
Category Awareness Consideration Trial Purchase Retention Referral Reactivation
No Engagement 135 90 92 45 22 15 9
Mild Interest 60 54 43 33 18 7 3
Moderate Conversion 29 35 49 38 25 13 5
High Conversion 16 28 39 52 48 32 19
Churned 20 27 34 40 47 44 51
  • To get started with ChartExpo, install ChartExpo in Excel.
  • Now, click on My Apps from the INSERT menu.
CSV vs. Excel
  • Choose ChartExpo from My Apps, then click Insert.
CSV vs. Excel
  • Once it loads, choose the “Mosaic (aka Mekko) Chart” from the charts list.
CSV vs. Excel
  • Click the “Create Chart From Selection” button after selecting the data from the sheet, as shown.
CSV vs. Excel
  • ChartExpo will generate the visualization below for you.
CSV vs. Excel
  • If you want to have the chart’s title, click Edit Chart, as shown in the above image.
  • Click the pencil icon next to the Chart Header to change the title.
  • It will open the properties dialog. Under the Text section, you can add a heading in Line 1 and enable Show.
  • Give the appropriate title of your chart and click the Apply button.
CSV vs. Excel
  • You can change the position of the dock as follows:
CSV vs. Excel
  • You can change the bar color and legend shape type as follows:
CSV vs. Excel

;

  • You can show a percentage on the chart from “Chart Label Properties” as follows:
CSV vs. Excel
  • You can add chart footer text as follows:
CSV vs. Excel
  • Click the “Save Changes” button to persist the changes.
CSV vs. Excel
  • Your final chart will appear as below.
CSV vs. Excel

Insights

  • The mosaic plot shows customer behavior across campaign phases:
  • Awareness: Most customers (135, 10%)
  • High No Engagement: 92 customers (7%)
  • Mid Interest: 43 customers (3%)
  • High conversion rates are seen in:
  • Purchase phase: 52 customers (4%)
  • Retention phase: 48 customers (4%)
  • This indicates efficient customer progression.
  • Referral and Reactivation phases show less activity, with noticeable churned customers.
  • A moderate conversion rate is seen in the Consideration stage:
  • 35 customers (3%)
  • This highlights the importance of this stage in decision-making.

CSV vs. Xlsx: Benefits

Have you ever wondered why some people swear by Excel while others stick to CSV? It’s not about who’s right—it’s about what your data needs. Whether you want fast and feature-packed or straightforward and flexible, both formats bring something valuable to the table. Let’s compare the benefits of CSV vs. XLSX so you can choose smartly and work faster.

Benefit Category CSV Benefits XLSX (Excel) Benefits
Speed & Size Loads quickly due to smaller file size. Handles large datasets with more structure.
Simplicity Plain text makes it easy to edit and process. Built-in tools make complex tasks easier.
Compatibility Works across most platforms and apps. Seamless with Microsoft tools and Excel-based platforms.
Data Sharing Easy to export, email, or import into other systems. Great for collaboration and sharing with teams.
User Experience Best for machines. Best for humans—clean, readable, and visual.

Best Practices for Handling CSV and Excel Files

If you work with data, then you’ve probably juggled both CSV and Excel files more times than you can count. One is fast and straightforward. The other is powerful and polished. Here are the best practices to keep your files clean, clear, and chaos-free:

  • Always back up: Before editing anything, save a copy of your work. Accidental changes can be challenging to reverse, especially in CSV versus Excel formats, where a single mistake can significantly alter the data.
  • Use clear headers: Keep column names consistent and straightforward. This helps when using tools like GETPIVOTDATA in Excel or importing into other systems.
  • Avoid special characters: In CSV files, extra commas or quotes can break your data. Stick to alphanumeric characters when possible.
  • Save in the right format: Use how to save Excel as CSV wisely—some formatting and formulas won’t carry over. Choose based on the final use case, not convenience.
  • Validate data regularly: Scan for errors, blank cells, and duplicate entries to ensure accuracy. Tools in Excel help with this, especially when combined with frequency Tables in Excel.

FAQs

Is a CSV file better than Excel?

It depends on your goal. CSV is faster and lighter. Excel is richer and more visual. For raw data transfers, CSV is the preferred format. For analysis and visuals, Excel shines. Choose based on what you need most.

How is modern CSV different from Excel?

  • CSV is plain text; Excel is structured.
  • CSV loads faster.
  • Excel supports formulas and charts.
  • CSV is easier to import into apps.
  • Excel handles what-if analysis and formatting.
  • CSV has no formatting.

Wrap Up

Choosing between CSV vs. Excel doesn’t have to be an uphill task. Both serve different purposes – the key is knowing when to use each one.

Excel is powerful. It’s used for analysis, dashboards, and planning. That’s a simple answer for those who ask, “What is Excel software used for?” It’s the go-to for teachers, marketers, analysts, and more.

CSV is simple and efficient. It’s perfect for moving data between systems. It loads faster and works well with code, APIs, and scripts.

You can easily switch between the two. Knowing how to save Excel as CSV is essential for sharing clean, raw data. It ensures compatibility with databases and apps. Sometimes, you’ll get files in a basic format. In that case, converting text Files to Excel helps bring structure back. Excel adds rows, columns, and formulas to flat files.

So, which one should you pick? If you need visuals and features, go to Excel. If speed and simplicity matter, go CSV. Use both smartly, and install ChartExpo. Your data management will get stronger.

How much did you enjoy this article?

ExcelAd2
Start Free Trial!
156406

Related articles

next previous
Microsoft Excel12 min read

Financial Graphs and Charts in Excel: Tips and Best Practices

Explore financial charts and graphs to improve data analysis, reveal trends, and make smarter business decisions with clear visual insights.

Microsoft Excel12 min read

Export Jira to Excel: Insights Made Easy

Learn how to export Jira to Excel for better data analysis and reporting. You’ll discover methods, tips, and visuals to turn your data into actionable insights.

Microsoft Excel11 min read

Hlookup in Excel: The Key to Faster Analysis

HLOOKUP in Excel enables you to find data across rows quickly. This blog will show you how to use it, avoid common errors, and enhance data visualizations.

Microsoft Excel7 min read

How to Create a Stacked Waterfall Chart in Excel?

Discover how to build and customize a stacked waterfall chart in Excel. Ideal for showing positive and negative values across categories or time.

Microsoft Excel11 min read

How to Refresh a Pivot Table in Excel?

Learn how to refresh a Pivot Table in Excel for accurate data. Enhance your analysis with advanced charts, auto-refresh features, and intuitive visual tools.

ChartExpo logo

Turn Data into Visual
Stories

CHARTEXPO

  • Home
  • Gallery
  • Videos
  • Services
  • Pricing
  • Contact us
  • FAQs
  • Privacy policy
  • Terms of Service
  • Sitemap

TOOLS

  • ChartExpo for Google Sheets
  • ChartExpo for Microsoft Excel
  • Power BI Custom Visuals by ChartExpo
  • Word Cloud

CATEGORIES

  • Bar Charts
  • Circle Graphs
  • Column Charts
  • Combo Charts
  • Comparison Charts
  • Line Graphs
  • PPC Charts
  • Sentiment Analysis Charts
  • Survey Charts

TOP CHARTS

  • Sankey Diagram
  • Likert Scale Chart
  • Comparison Bar Chart
  • Pareto Chart
  • Funnel Chart
  • Gauge Chart
  • Radar Chart
  • Radial Bar Chart
  • Sunburst Chart
  • see more
  • Scatter Plot Chart
  • CSAT Survey Bar Chart
  • CSAT Survey Chart
  • Dot Plot Chart
  • Double Bar Graph
  • Matrix Chart
  • Multi Axis Line Chart
  • Overlapping Bar Chart
  • Control Chart
  • Slope Chart
  • Clustered Bar Chart
  • Clustered Column Chart
  • Box and Whisker Plot
  • Tornado Chart
  • Waterfall Chart
  • Word Cloud
  • see less

RESOURCES

  • Blog
  • Resources
  • YouTube
SIGN UP FOR UPDATES

We wouldn't dream of spamming you or selling your info.

© 2025 ChartExpo, all rights reserved.