• Home
  • Tools dropdown img
    • Spreadsheet Charts

      • ChartExpo for Google Sheets
      • ChartExpo for Microsoft Excel
    • Power BI Charts

      • Power BI Custom Visuals by ChartExpo
    • Word Cloud

  • Charts dropdown img
    • Chart Category

      • Bar Charts
      • Circle Graphs
      • Column Charts
      • Combo Charts
      • Comparison Charts
      • Line Graphs
      • PPC Charts
      • Sentiment Analysis Charts
      • Survey Charts
    • Chart Type

      • Box and Whisker Plot
      • Clustered Bar Chart
      • Clustered Column Chart
      • Comparison Bar Chart
      • Control Chart
      • CSAT Survey Bar Chart
      • CSAT Survey Chart
      • Dot Plot Chart
      • Double Bar Graph
      • Funnel Chart
      • Gauge Chart
      • Likert Scale Chart
      • Matrix Chart
      • Multi Axis Line Chart
      • Overlapping Bar Chart
      • Pareto Chart
      • Radar Chart
      • Radial Bar Chart
      • Sankey Diagram
      • Scatter Plot Chart
      • Slope Chart
      • Sunburst Chart
      • Tornado Chart
      • Waterfall Chart
      • Word Cloud
    • Google Sheets
      Microsoft Excel
  • Services
  • Pricing
  • Contact us
  • Blog
  • Support dropdown img
      • Gallery
      • Videos
      • Contact us
      • FAQs
      • Resources
    • Please feel free to contact us

      atsupport@chartexpo.com

Categories
All Data Visualizations Data Analytics Surveys
Add-ons/
  • Google Sheets
  • Microsoft Excel
  • Power BI
All Data Visualizations Data Analytics Surveys
Add-ons
  • Google Sheets
  • Microsoft Excel
  • Power BI

We use cookies

This website uses cookies to provide better user experience and user's session management.
By continuing visiting this website you consent the use of these cookies.

Ok

ChartExpo Survey


Home > Blog > Microsoft Excel

Export Jira to Excel: Insights Made Easy

Export Jira to Excel—isn’t that what every team wants to do without the hassle? Jira tracks everything, but Excel makes it easier to view, share, and report. And in fast-paced teams, time is money.

Export Jira to Excel

Jira is a powerhouse for task and issue tracking. But raw data alone doesn’t drive decisions. Excel helps turn that data into something clear and useful.

Excel is familiar, flexible, and easy to use in meetings. Whether it’s marketing updates, sprint progress, or bug tracking summaries, teams still ask for exports. Managers love it, and oftentimes, clients expect it.

By learning how to export Jira to Excel, you gain control over how you visualize work. Want to filter issues by sprint? Done. Do you need to group by priority or assignee? Excel gives you that freedom.

Now, here’s where things get smarter. You can combine your Jira export with artificial intelligence in Excel to identify bottlenecks or patterns. It doesn’t stop there. If you know how to organize data in Excel, your reports will speak for themselves.

This guide will walk you through the process step by step. Whether you’re new to Jira or already using Excel, you’ll learn how to make both work together.

Ready to turn your data into clarity? You’ve come to the right place.

First…

Table of Contents:

  1. Why is exporting Jira to Excel Useful?
  2. How to Connect Jira to Excel?
  3. Methods to Export Data from Jira to Excel
  4. How to Analyze Jira Exported Data in Excel?
  5. Benefits of Jira Export to Excel
  6. Limitations of Exporting Jira to Excel
  7. Tips for Exporting Jira to Excel
  8. FAQs
  9. Wrap Up

Why is exporting Jira to Excel Useful?

Have you ever stared at a Jira dashboard and thought, “This is helpful—but I need more”? You’re not alone. Many teams turn to Excel for deeper insights and flexibility. Jira is great for tracking, but Excel brings it all together.

Here’s why exporting matters:

  • Custom reporting: Jira’s canned reports are not flexible and cannot be formatted. Using Excel, you can personalize the columns, filters, and summaries for whatever your audience wants to see.
  • Advanced analysis: Excel functions for data analysis help track trends, find delays, and measure performance beyond what Jira offers. Add Analysis Toolpak to Excel, and you have the tools for statistical thinking and forecasting without the complexity.
  • Data sharing: Not all stakeholders have access to Jira. Conversely, nearly everybody can view an Excel file. Easy exporting makes your data portable and ready to present in meetings, emails, or in cloud folders.
  • Back-up and auditing: Jira data updates constantly, and past versions aren’t always easy to trace. Exporting provides a time-stamped record for accountability and compliance checks.
  • Visualization: Raw Jira exports can feel overwhelming, but Excel helps simplify that. Knowing how to add a Chart in Excel, you can turn rows into visuals that communicate faster.

How to Connect Jira to Excel?

You’ve got the data in Jira. Now, how do you get it into Excel—without wasting time copying and pasting? Good news: there’s more than one way to do it.

Here’s how you can connect Jira to Excel, based on your needs and how hands-on you want to be:

  • Manual export: Jira allows you to export issues as a CSV file, which you can open directly in Excel. You can sort, filter, and perform data transformation in Excel to clean or reorganize the data.
  • Excel plugins (add-ins): Add-ins like Jira Cloud for Excel let you connect directly to your Jira projects from inside Excel. You can build live dashboards that showcase MS Excel uses in business across departments.
  • Automation tools: Using platforms like Zapier or Power Automate, you can automatically export Jira data into Excel at scheduled times. This hands-off approach gives you updated spreadsheets ready for Excel functions for data analysis without manual effort.
  • Power Query: Power Query connects Excel to Jira’s API. This allows you to pull in fresh data and shape it to fit your reporting needs. It’s ideal if you want control over how to organize data in Excel using merge, filter, and transformation options.

Methods to Export Data from Jira to Excel

Exporting data from Jira to Excel doesn’t have to be technical. It’s a smart move for anyone who wants more control over their project data.

Here’s a quick guide to help you get started:

How to Export Jira Issues to Excel:

  • Head over to the Issues section. You can also click the More button on the sidebar.
Export Jira to Excel
  • Use Jira’s filtering tools to narrow down the data—filter by status, priority, assignee, sprint, or any custom field.
  • Once your filter looks right, choose your export option:
    • Export Excel (All Fields) — This grabs everything, including custom fields.
    • Export Excel (Current Fields) — This exports only the visible columns.
Export Jira to Excel

And that’s it! Your issues are now neatly packed into Excel, ready for analysis, visualization, or sharing.

Top 5 ChartExpo Visuals to Transform Your Data Analysis

Data deserves visuals that tell a story, especially after you export Jira to Excel. Whether you’re managing sprints or tracking issue trends, using advanced visuals makes everything clearer. That’s where ChartExpo steps in. It transforms dry Jira data into visuals that people want to read.

Here are the top charts to help you get to another level of data visualization:

  • Sankey Chart: A Sankey diagram maker maps the flow of work through statuses, assignees, or resolution paths. It’s ideal for how to organize data in Excel, showing time loss and issue flow post-export clearly.
Export Jira to Excel
  • Multi Axis Line Chart: Track multiple trends—created vs. resolved vs. open issues—all on one view. You’ll spot bottlenecks, sprint delays, and growing backlogs in seconds.
Export Jira to Excel
  • Progress Circle Chart: Simple, bold, and effective. This chart shows task completion and pairs with how to add a chart for impactful reporting.
Export Jira to Excel
  • Mekko Chart: This chart blends a Stacked Column Chart with category proportion comparison. It is ideal when analyzing two variables side by side, such as issue types across multiple teams.
Export Jira to Excel
  • Multi Axis Spider Chart: Visualize strengths, gaps, or workload balance across categories. This chart is great for visualizing performance trends after applying Excel functions for data analysis to your exported data.
Export Jira to Excel

How to Analyze Jira Exported Data in Excel?

Have you ever attempted to manage a Jira backlog using Excel alone? It’s like squinting at stars through a foggy window. Sure, Excel is brilliant for sorting, calculating, and structuring data. But when it comes to data visualization, it can feel underwhelming.

You get the basics—bars, lines, and maybe a pie or two. But what if you need something more innovative? Is there something that reveals the story behind the numbers? That’s where ChartExpo steps in. It’s the visual muscle Excel forgot to pack.

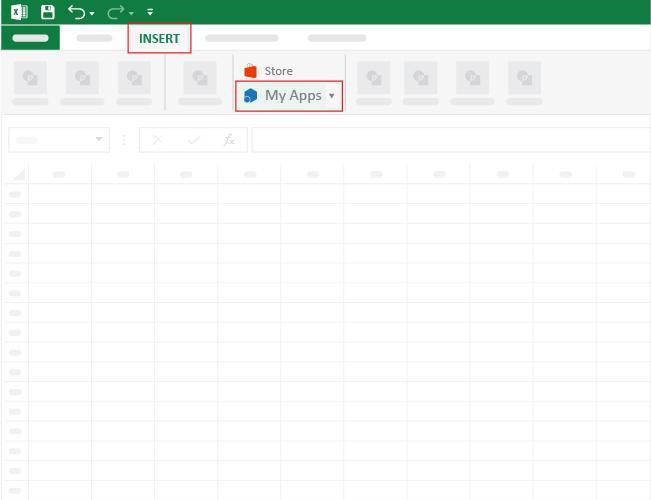
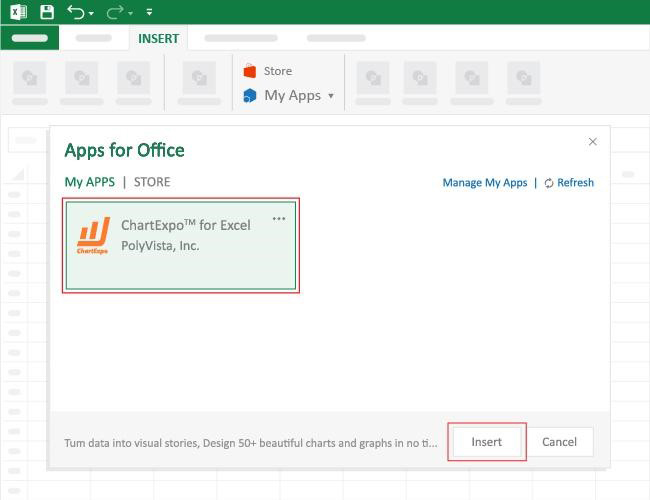
How to Install ChartExpo in Excel?

  1. Open your Excel application.
  2. Open the worksheet and click the “Insert” menu.
  3. You’ll see the “My Apps” option.
  4. In the Office Add-ins window, click “Store” and search for ChartExpo on the My Apps Store.
  5. Click the “Add” button to install ChartExpo in your Excel.

ChartExpo charts are available both in Google Sheets and Microsoft Excel. Please use the following CTAs to install the tool of your choice and create beautiful visualizations with a few clicks in your favorite tool.

Example

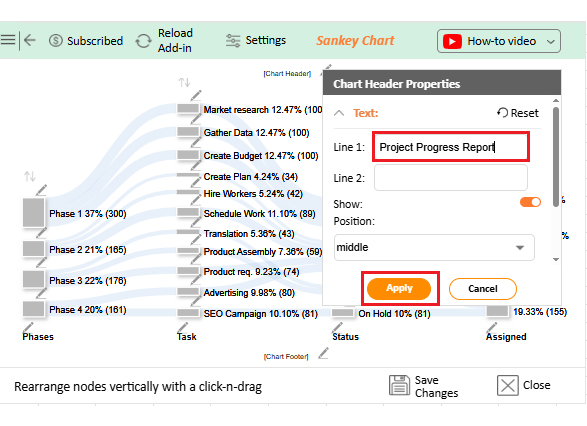
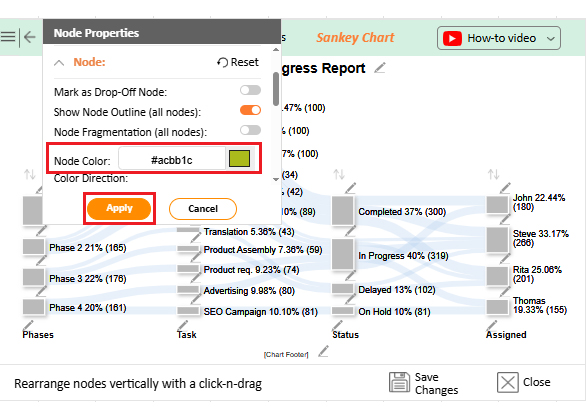
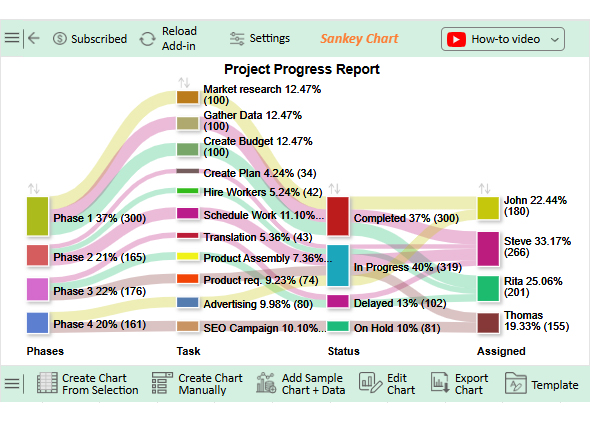
Let’s visualize and analyze this sample data in Excel using ChartExpo.

Phases Task Status Assigned Complete (%)
Phase 1 Market research Completed John 100
Phase 1 Gather Data Completed Steve 100
Phase 1 Create Budget Completed Rita 100
Phase 2 Create Plan In Progress Steve 34
Phase 2 Hire Workers In Progress Rita 42
Phase 2 Schedule Work In Progress Steve 89
Phase 3 Product req. In Progress Thomas 74
Phase 3 Product Assembly Delayed Rita 59
Phase 3 Translation Delayed Steve 43
Phase 4 Advertising In Progress John 80
Phase 4 SEO Campaign On Hold Thomas 81
  • To get started with ChartExpo, install ChartExpo in Excel.
  • Now, click on My Apps from the INSERT menu.
Export Jira to Excel
  • Choose ChartExpo from My Apps, then click Insert.
Export Jira to Excel
  • Once it loads, choose the “Sankey Chart” from the charts list.
Export Jira to Excel
  • Click the “Create Chart From Selection” button after selecting the data from the sheet, as shown.
Export Jira to Excel
  • ChartExpo will generate the visualization below for you.
Export Jira to Excel
  • If you want to have the chart’s title, click Edit Chart, as shown in the above image.
  • Click the pencil icon next to the Chart Header to change the title.
  • It will open the properties dialog. Under the Text section, you can add a heading in Line 1 and enable Show.
  • Give the appropriate title of your chart and click the Apply button.
Export Jira to Excel
  • You can add the color in Nodes and set the direction as follows:
Export Jira to Excel
  • Click the “Save Changes” button to persist the changes.
Export Jira to Excel
  • Your final chart will appear as follows.
Export Jira to Excel

Insights

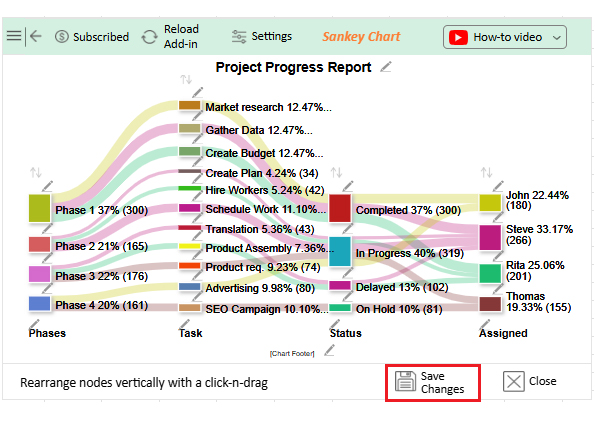
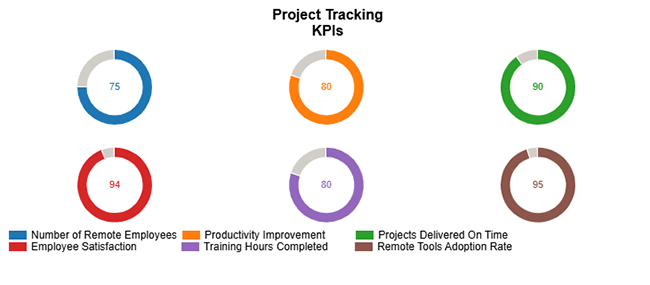
Top Tasks by Percentage:

  • Market Research: 12.47%
  • Gather Data: 12.47%
  • Create Budget:47%

Phase Distribution:

  • Phase 1: 37% (300 tasks)
  • Phase 2: 21% (165 tasks)
  • Phase 3: 22% (176 tasks)
  • Phase 4: 20% (161 tasks)

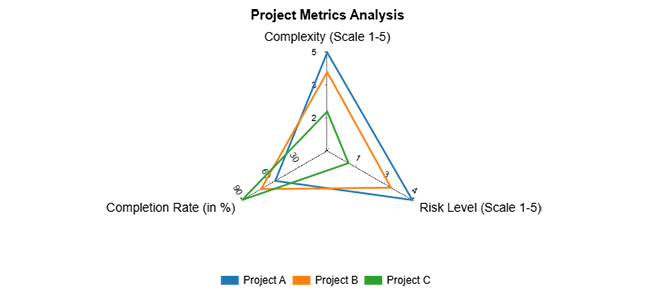
Most Critical Tasks:

  • Create Plan: 4.24%
  • Hire Workers: 5.24%
  • Schedule Work: 11.10%
  • Translation: 5.36%
  • Product Assembly: 7.36%
  • Product Registration: 9.23%
  • Advertising: 9.98%
  • SEO Campaign: 10.10%

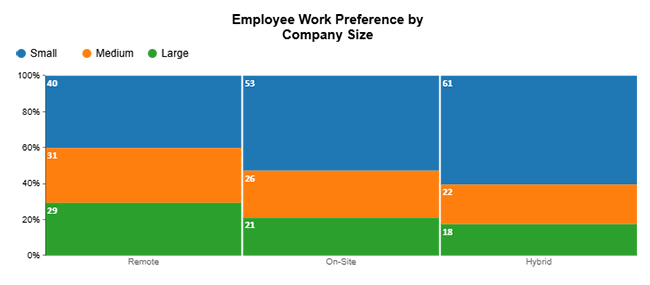
Task Distribution by Team Member:

  • Steve: 33.17% (266 tasks)
  • Rita: 25.06% (201 tasks)
  • John: 22.44% (180 tasks)
  • Thomas: 19.33% (155 tasks)

Benefits of Jira Export to Excel

Jira is powerful, no doubt. But staring at dashboards all day? Not always ideal. Sometimes, you need your data out of Jira and into something more flexible. That’s where Export Jira to Excel becomes a game-changer, and here’s why it’s worth considering:

  • Adaptable reporting: You can easily build and share your views, summaries, and visualizations. You’re not bound to a strict Jira structure.
  • Simplified data clean-up: You can simply use Excel data transformation to remove any clutter and focus on what matters most.
  • Deep analysis: You can run regression, forecasts, and more with tools like the Analysis Toolpak in Excel.
  • Cross-tool aggregation: Want to see how Jira data connects with sales or financial data? You can merge and analyze across sources easily in Excel.
  • Better visualization: You can go beyond basic charts by integrating ChartExpo or using how to add a chart in Excel skills for polished, insightful visuals.
  • Team-friendly: Not everyone’s in Jira, but everyone can read a spreadsheet. Share updates across teams without access issues.

Limitations of Exporting Jira to Excel

Exporting Jira to Excel feels great—until it doesn’t. At first, it gives you a sense of freedom. Then you hit the limits. Spreadsheets aren’t designed to handle everything, especially when your data is constantly changing.

Here are the downsides to keep in mind:

  • Static data: Your data isn’t automatically updated once it’s been exported. You have a snapshot, not a live feed.
  • Manual update required: Has anything changed in Jira? You’ll need to export again, over and over. This way, it’s easy to miss updates.
  • Poor visuals: Excel’s default charts are rudimentary. Without something like ChartExpo, your reports can appear flat and lacking essential insights.
  • Chance of error: Performing manual filtering and formatting can lead to errors. One bad formula and you have a totally wrong analysis.
  • No real-time collaboration: Jira enables teams to collaborate in real-time. Excel? Not so much—unless you’re using cloud-based tools, and even then, it’s not the same.

Tips for Exporting Jira to Excel

Exporting from Jira to Excel sounds simple—until you realize how messy it can get. Too many fields? Unclear filters? Suddenly, your “quick report” turns into chaos. The good news? A few smart moves can make your exports smooth, clean, and super helpful.

Here are some quick tips to save time and frustration:

  • Filter first, export later: Use Jira’s filtering tools to target precisely what you need. Less clutter means faster work in Excel.
  • Use “current fields” for simplicity: If you don’t need every detail, export only what’s displayed. It’s easier to analyze and keeps Excel from getting bloated.
  • Go for “all fields” if you need depth: Are you planning to explore advanced reporting? Choose the export Excel (All Fields) option to capture custom fields and hidden gems.
  • Label your data clearly: Rename columns in Excel to make sense later. You’ll thank yourself when building formulas or applying Excel functions for data analysis.
  • Clean up with Power Query: Use Power Query to quickly transform data in Excel—remove nulls, split columns, and reformat in one go.
  • Save a template: If you run regular exports, build a reusable Excel template. It speeds things up and maintains consistent formatting.
  • Visualize immediately: Don’t wait—learn how to add a chart in Excel to bring your data to life right after exporting. The sooner you visualize, the faster you’ll find insights.

FAQs

Can I export Jira to Excel?

Yes, you can export Jira issues to Excel. Use the “Export” button in the Issues section. Choose either current or all fields. The file downloads in CSV or Excel format for analysis.

Can Excel get data from Jira?

Yes, Excel can pull data from Jira. Use Power Query or add-ins like Jira Cloud for Excel. These tools connect to Jira’s API, and you can refresh data without manual exports.

How do I export users from Jira to Excel?

  • Go to Jira Admin > User Management.
  • Click the Export Users option.
  • Choose CSV as the export format.
  • Download the file to your computer.
  • Open it in Excel for sorting or analysis.

Wrap Up

Exporting Jira to Excel is a smart move. It gives you control over your project data; you can filter, sort, and reshape information as needed.

What is Excel software used for? It’s used to organize, analyze, and present data. Once you export from Jira, Excel becomes your analysis hub.

You can go beyond numbers. Learn how to create a report in Excel using charts, pivot tables, and summaries. This helps your team and stakeholders see the whole picture.

Excel also helps automate repetitive work. With artificial intelligence in Excel, you can use features like Ideas and smart data types. These tools make insights faster and easier to find.

Still, Excel has its limitations in visuals. That’s where ChartExpo adds power. It gives you clear, professional visuals for Jira exports.

Conclusively, exporting Jira to Excel isn’t the end. It’s the beginning of more intelligent reporting, cleaner data, and better decisions. Install ChartExpo to elevate your data visualization and analysis.

How much did you enjoy this article?

ExcelAd1
Start Free Trial!
156106

Related articles

next previous
Microsoft Excel11 min read

Hlookup in Excel: The Key to Faster Analysis

HLOOKUP in Excel enables you to find data across rows quickly. This blog will show you how to use it, avoid common errors, and enhance data visualizations.

Microsoft Excel7 min read

How to Create a Stacked Waterfall Chart in Excel?

Discover how to build and customize a stacked waterfall chart in Excel. Ideal for showing positive and negative values across categories or time.

Microsoft Excel11 min read

How to Refresh a Pivot Table in Excel?

Learn how to refresh a Pivot Table in Excel for accurate data. Enhance your analysis with advanced charts, auto-refresh features, and intuitive visual tools.

Microsoft Excel12 min read

How to Use Copilot in Excel for Faster Analysis

Discover how to use Copilot in Excel to boost productivity and simplify data tasks. You’ll learn key features, benefits, and how ChartExpo improves your charts.

Microsoft Excel10 min read

How to Create a Scatter Plot in Excel with 3 Variables?

Learn how to create a Scatter Plot in Excel with 3 variables? Everything you need to create, format, and interpret a multi-variable chart.

ChartExpo logo

Turn Data into Visual
Stories

CHARTEXPO

  • Home
  • Gallery
  • Videos
  • Services
  • Pricing
  • Contact us
  • FAQs
  • Privacy policy
  • Terms of Service
  • Sitemap

TOOLS

  • ChartExpo for Google Sheets
  • ChartExpo for Microsoft Excel
  • Power BI Custom Visuals by ChartExpo
  • Word Cloud

CATEGORIES

  • Bar Charts
  • Circle Graphs
  • Column Charts
  • Combo Charts
  • Comparison Charts
  • Line Graphs
  • PPC Charts
  • Sentiment Analysis Charts
  • Survey Charts

TOP CHARTS

  • Sankey Diagram
  • Likert Scale Chart
  • Comparison Bar Chart
  • Pareto Chart
  • Funnel Chart
  • Gauge Chart
  • Radar Chart
  • Radial Bar Chart
  • Sunburst Chart
  • see more
  • Scatter Plot Chart
  • CSAT Survey Bar Chart
  • CSAT Survey Chart
  • Dot Plot Chart
  • Double Bar Graph
  • Matrix Chart
  • Multi Axis Line Chart
  • Overlapping Bar Chart
  • Control Chart
  • Slope Chart
  • Clustered Bar Chart
  • Clustered Column Chart
  • Box and Whisker Plot
  • Tornado Chart
  • Waterfall Chart
  • Word Cloud
  • see less

RESOURCES

  • Blog
  • Resources
  • YouTube
SIGN UP FOR UPDATES

We wouldn't dream of spamming you or selling your info.

© 2025 ChartExpo, all rights reserved.