Categories
Bank dashboards provide real-time visual insights into customer behavior, financial performance, and operational metrics. All these help support strategic decision-making.
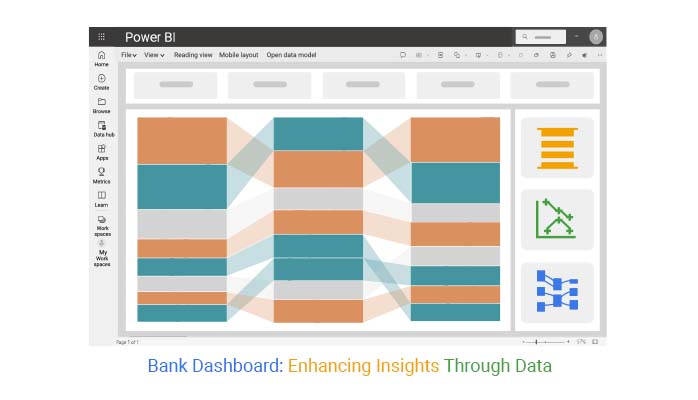


This guide shows you what a bank dashboard is, why you should use it, and the key features of an effective bank dashboard. You’ll discover how to create a dashboard in Power BI and see executive dashboard examples.
The guide dives deep into the digital dashboard, Power BI KPI dashboard, finance dashboard in Power BI, and business intelligence dashboard. You’ll also discover how the customer relationship management dashboard works, how to create a Power BI dashboard design, and the nitty-gritty that goes into a dashboard user interface design.
A bank dashboard is a visual tool that shows key financial and operational metrics in real time.
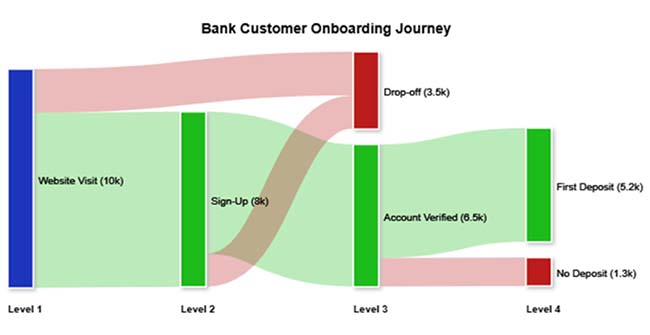
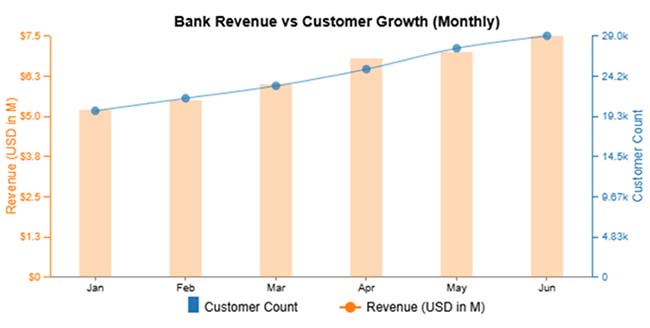
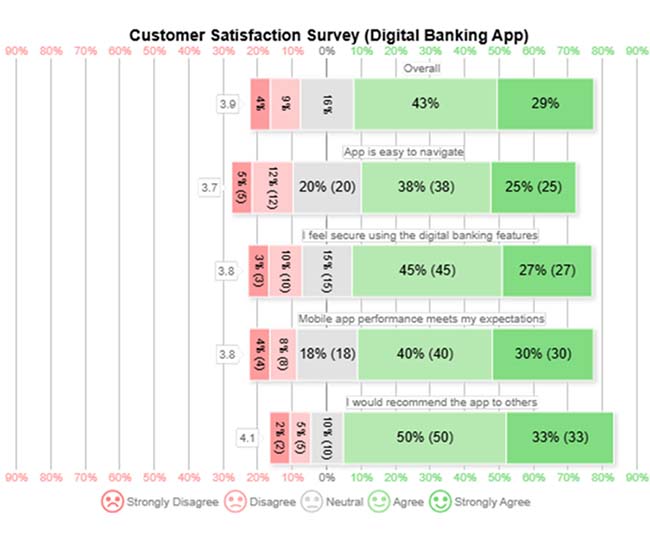
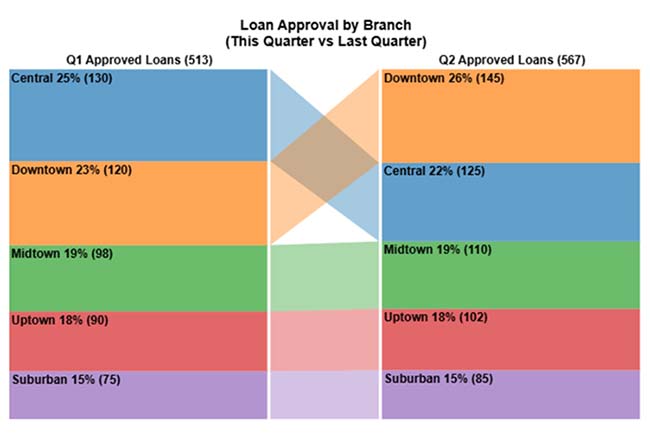
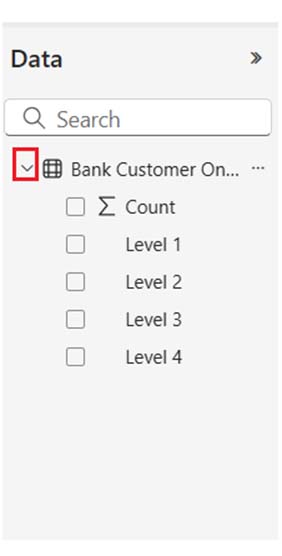
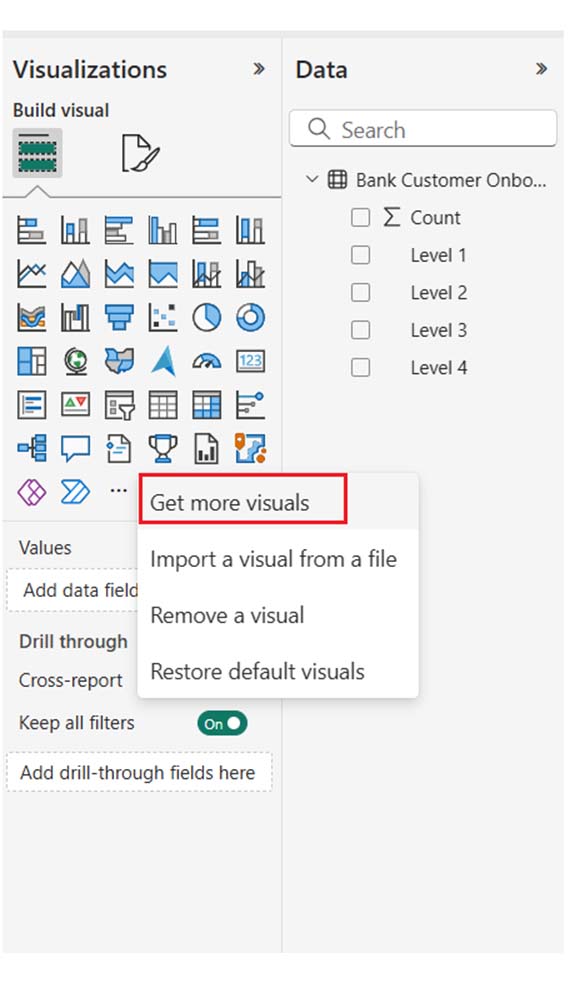
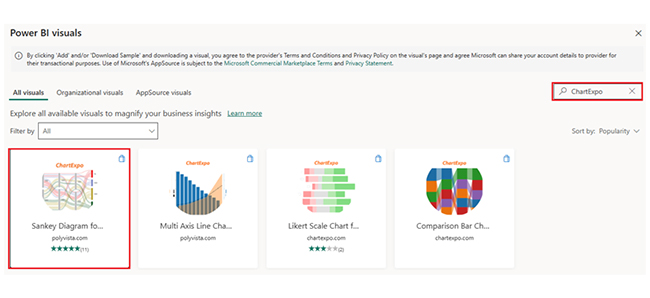
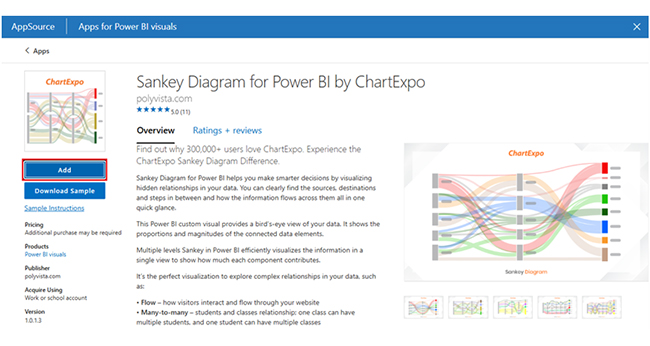
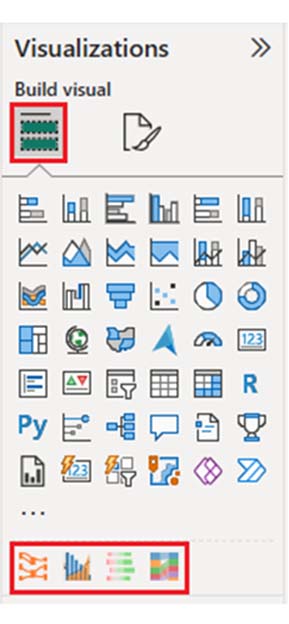
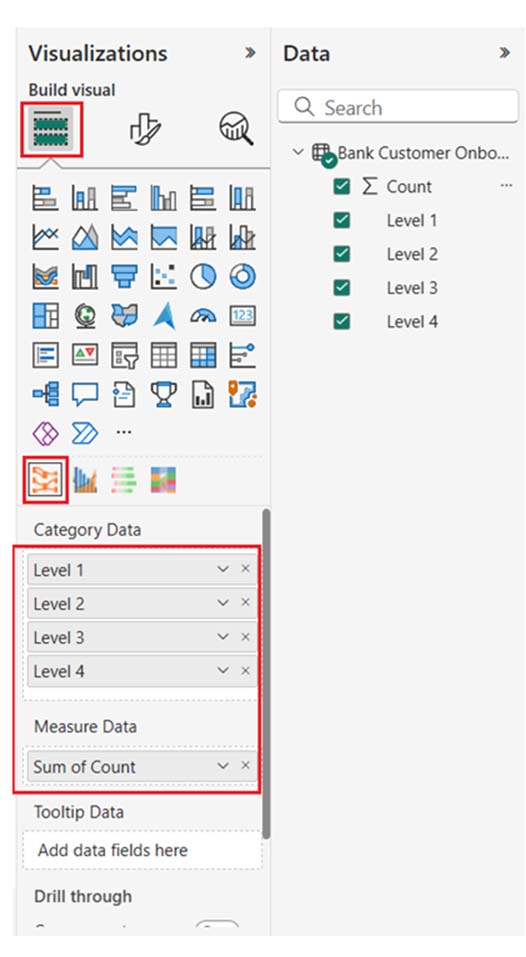
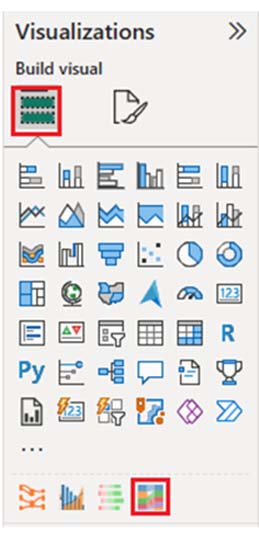
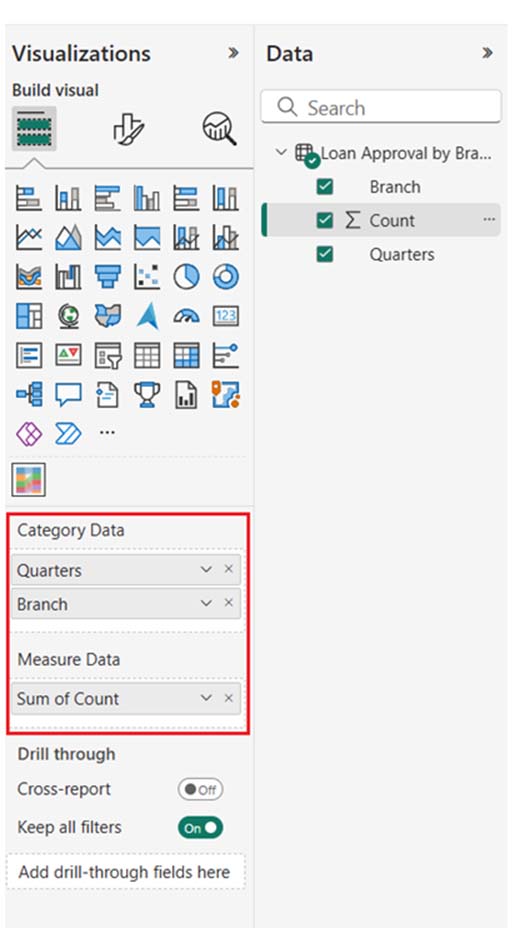
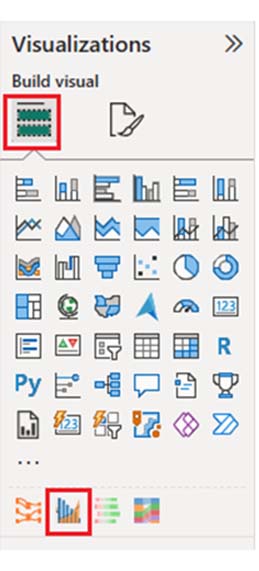
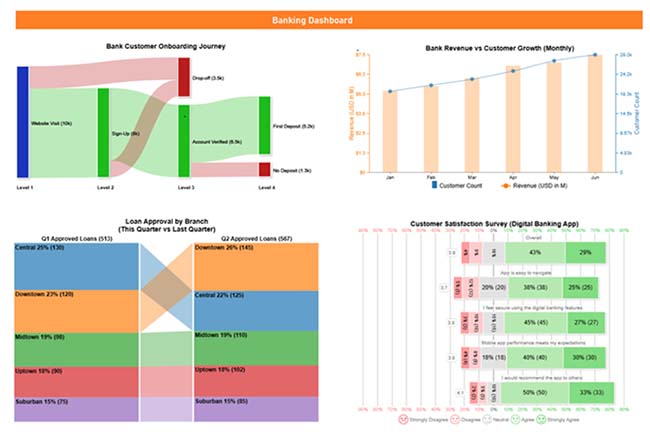
Here are some bank dashboards that can be created using ChartExpo.
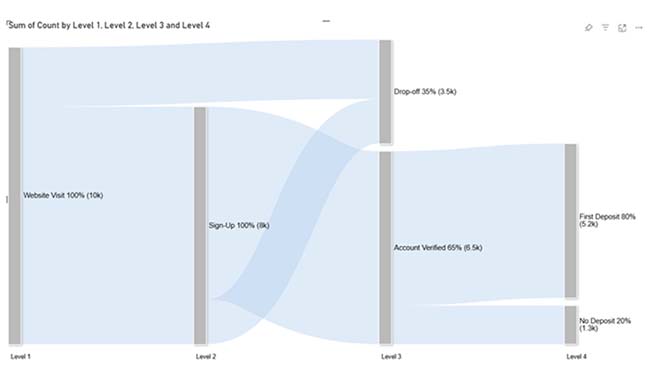
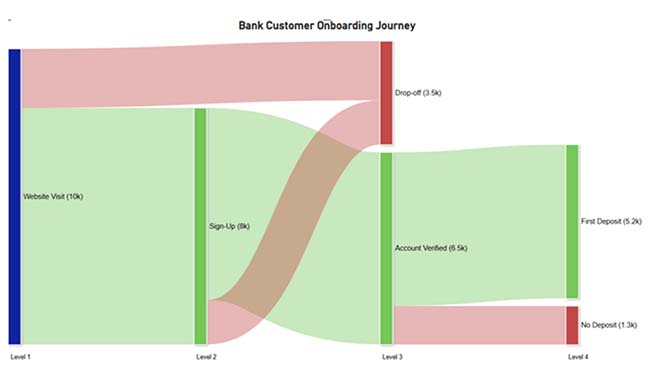
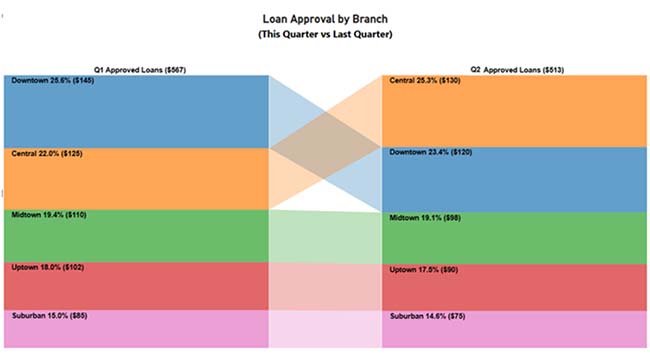
Sankey Chart:
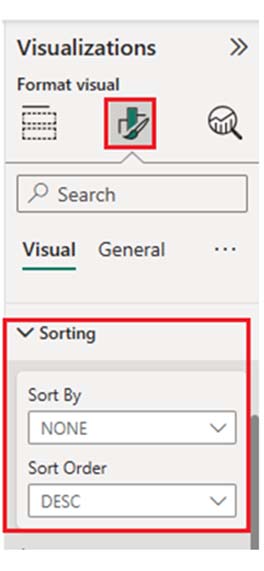
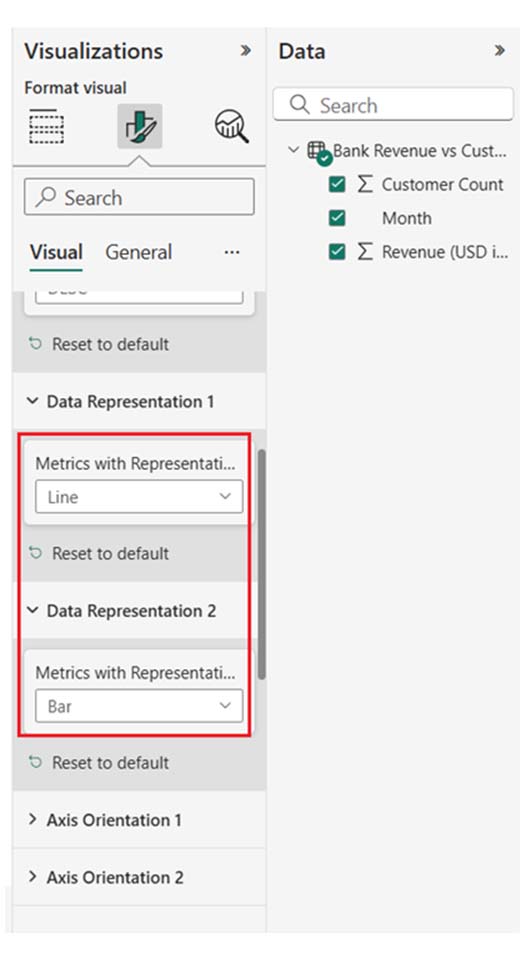
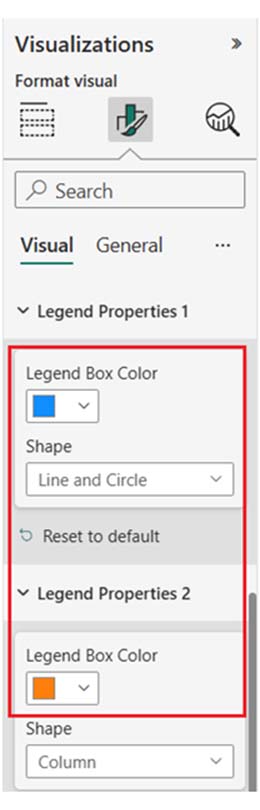
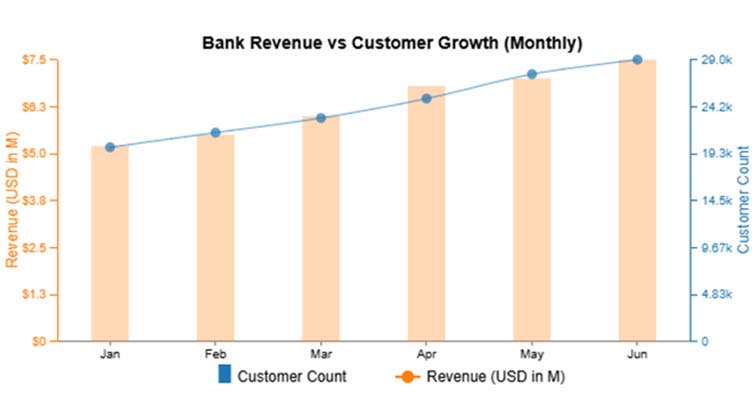
Multi-Axis Line Chart:
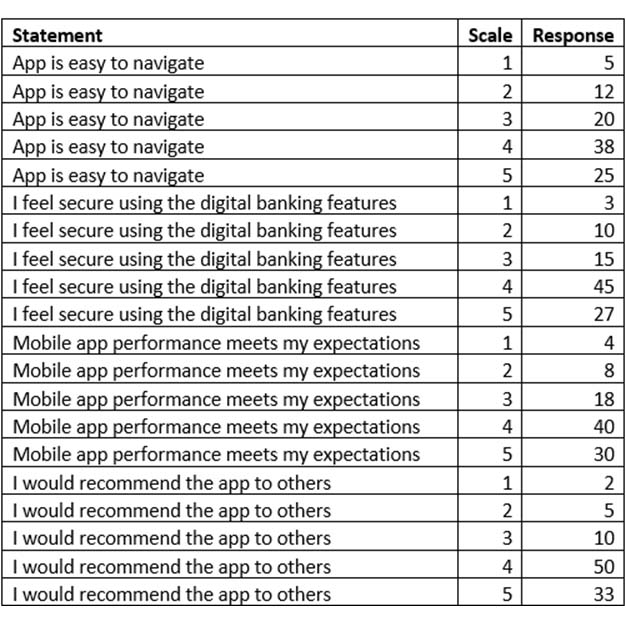
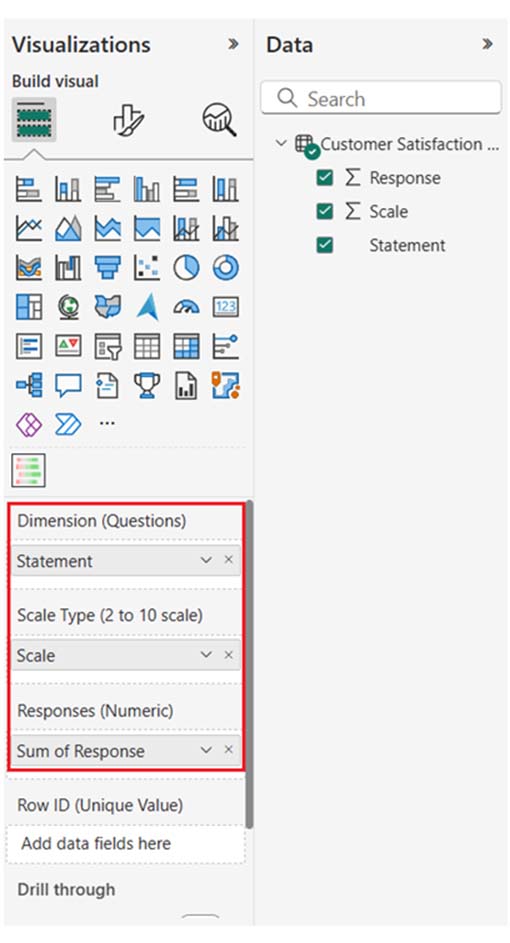
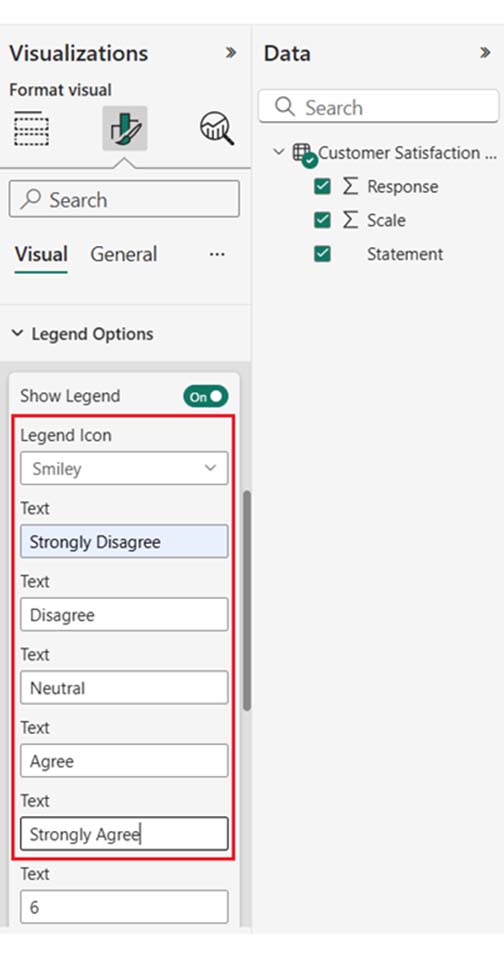
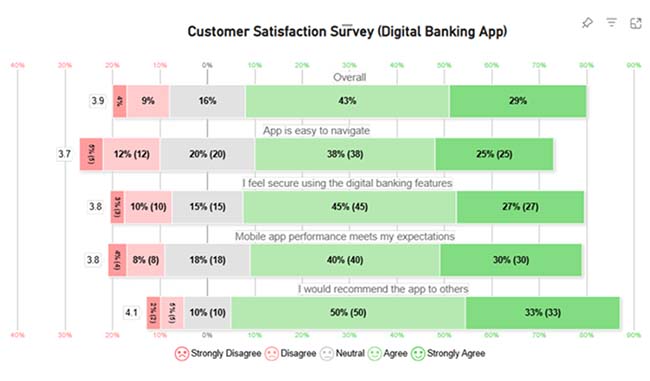
Likert Scale Chart:
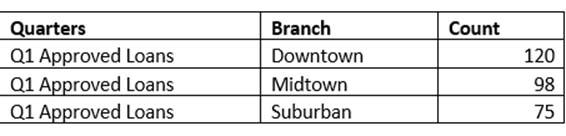
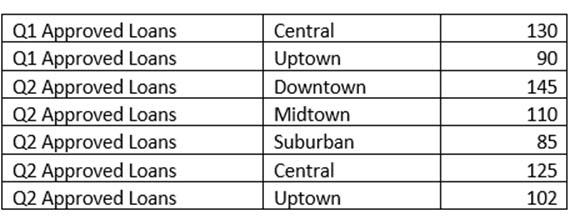
Comparison Bar Chart:
Here are four major steps to help you design a user-friendly bank dashboard.
Here are the common challenges in building bank dashboards:
Security Concerns: Protecting sensitive financial data and ensuring compliance with regulations like HIPAA and GDPR requires robust security measures.
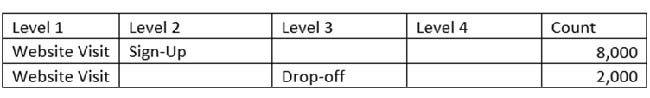
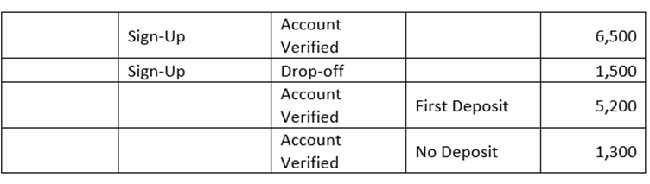
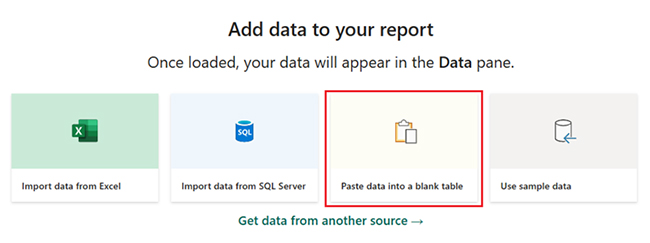
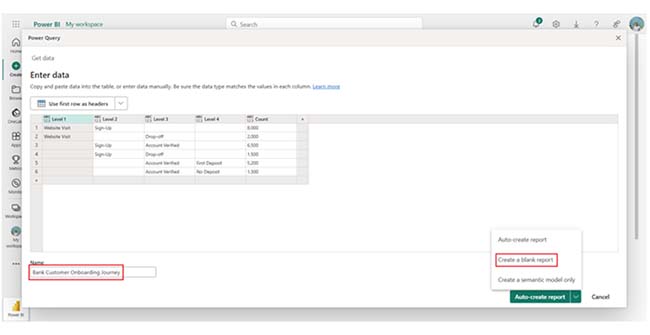
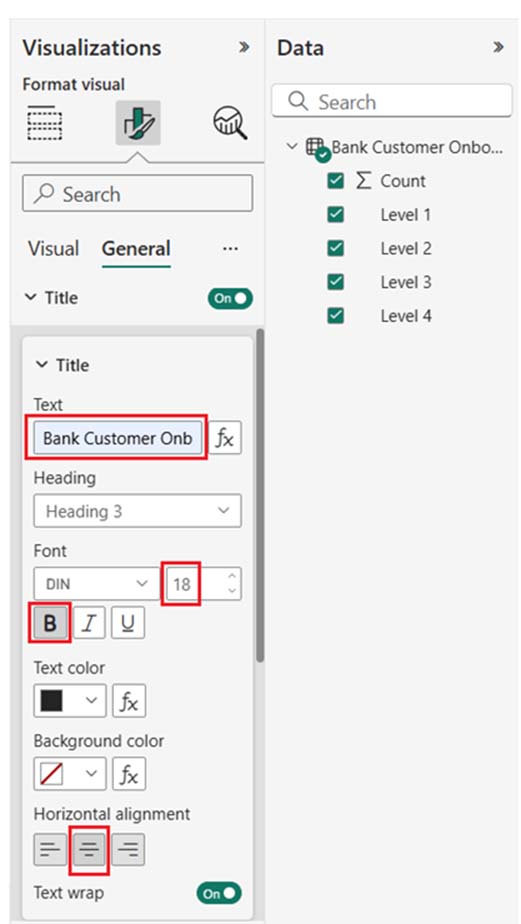
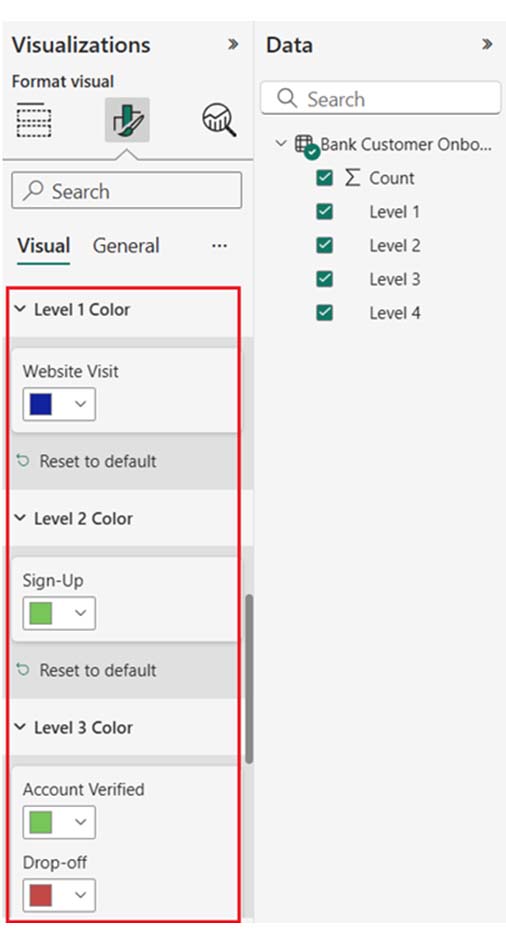
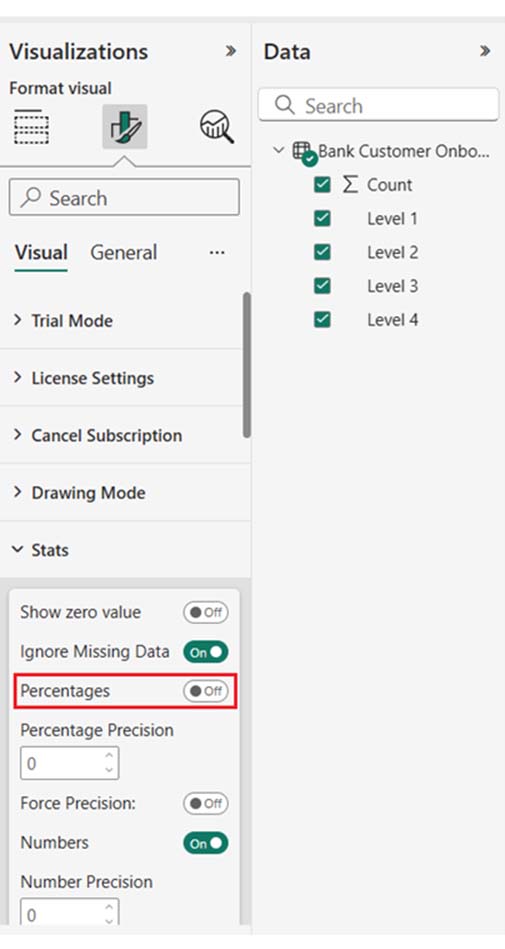
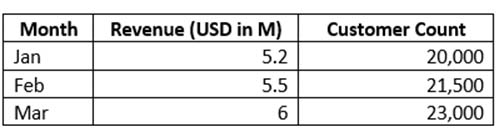
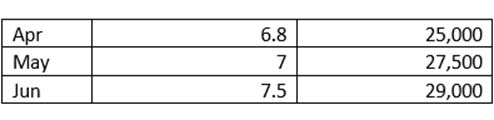
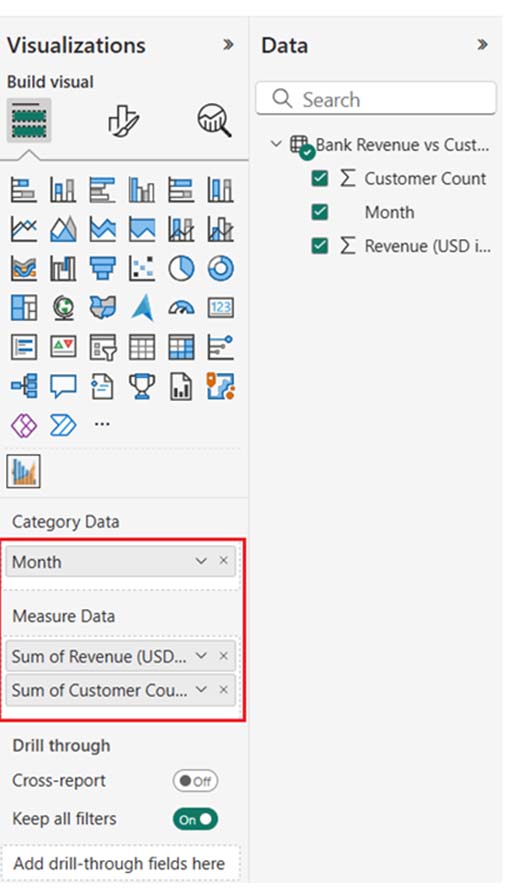
In this section, you’ll see how to create a banking dashboard to provide a comprehensive overview of key financial metrics and operational metrics within the banking sector.
The dashboard consolidates multiple data insights:
A dashboard in banking is a visual tool that displays key operational and financial metrics. This enables banks to monitor performance, analyze customer behavior, track KPIs, and make data-driven decisions in real time.
The three types of dashboards are Tactical Dashboards (for operational decision-making), Strategic Dashboards (for high-level insights), and Operational Dashboards (for real-time monitoring of daily activities and processes).
A bank dashboard offers real-time insights into customer behavior, financial metrics, and operations. Online banking dashboards help improve customer service, streamline decision-making, track KPIs, and boost operational efficiency with real-time data.
To properly implement bank dashboards, you’ll have to keep them simple, prioritize security, and customize them for users. Always use clean, intuitive designs with easy-to-understand visuals to avoid information overload.
To protect sensitive banking data, you should consider using encryption, access controls, and user authentication. You should also allow for customization based on different user preferences and roles.
Now you know how banking dashboards work, what type of banking dashboard fits your needs?
How much did you enjoy this article?


Calculate accounts receivable turnover ratio to measure credit collection speed, improve cash flow, and strengthen your financial strategy. Read on!

Change Management KPIs are the key to tracking adoption, performance, and ROI during transitions. Find out which metrics matter. Read on!

Data collection methods and techniques determine the quality of every insight you act on. Explore key approaches for gathering reliable data. Read on!


