Categories
Progress report templates—aren’t they everywhere now? From schools to construction sites to corporate boardrooms, tracking progress is non-negotiable. Yet, without a consistent format, updates can lead to confusion.


That’s where progress report templates change the game. Consider this: 57% of executives say poor communication is their biggest roadblock. That’s not a tech issue. It’s a reporting issue. Weekly or monthly updates without structure leave room for assumptions, missed deadlines, budget overruns, and confused teams.
Progress report templates eliminate the guessing. They organize tasks, show milestones, and keep teams aligned. Whether managing marketing campaigns or overseeing product launches, structure saves time.
Construction firms use templates to show inspectors work done, tasks ahead, and potential delays. Educators use them to update parents on student growth. In both cases, the goal is simple: transparency.
These templates are also central to management reporting. Weekly status updates, KPI dashboards, and executive summaries often start from the same building blocks. When leaders know what to expect, they focus on results, not formatting.
Paired with tools like a progress bar in Excel, these reports do more than inform—they visualize momentum. You see how far you’ve come and know what’s left.
Progress isn’t about speed. It’s about direction. And with the right tools, your direction becomes clear.
Definition: A progress report template is a pre-structured document that tracks and shares updates on ongoing tasks or projects. It highlights completed work, current status, and next steps. These templates are standard in BI reporting and project management. They help teams stay focused and aligned.
Using a consistent format enhances communication and streamlines the review process. Many professionals also build them using pivot reporting tools to show clear, data-driven insights. They are simple, repeatable, and effective.
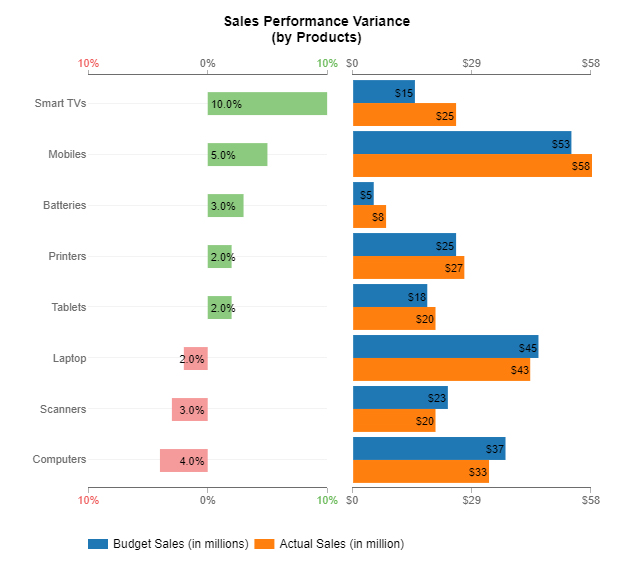
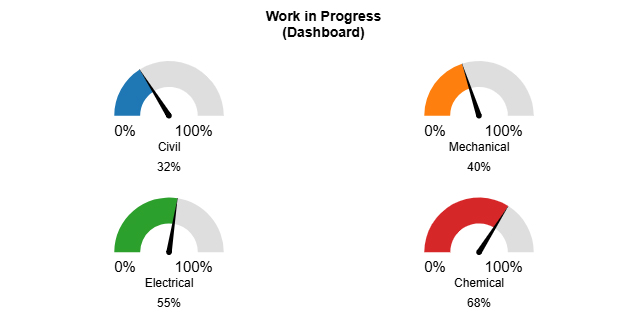
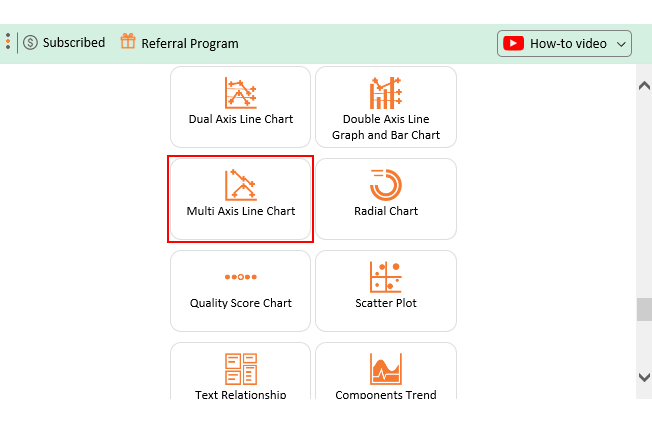
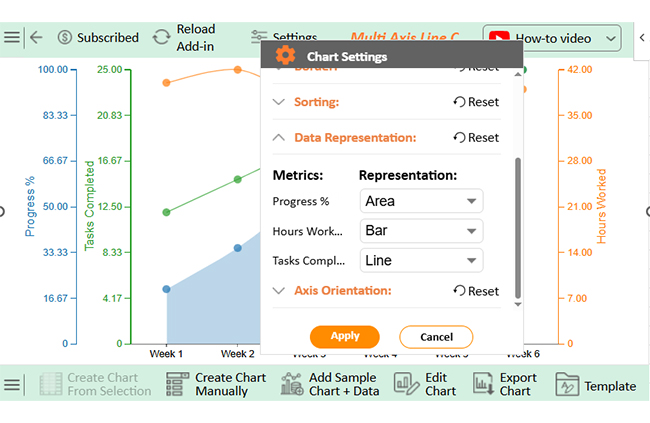
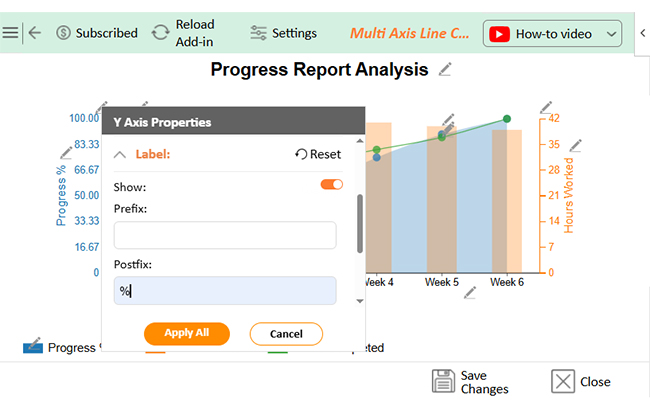
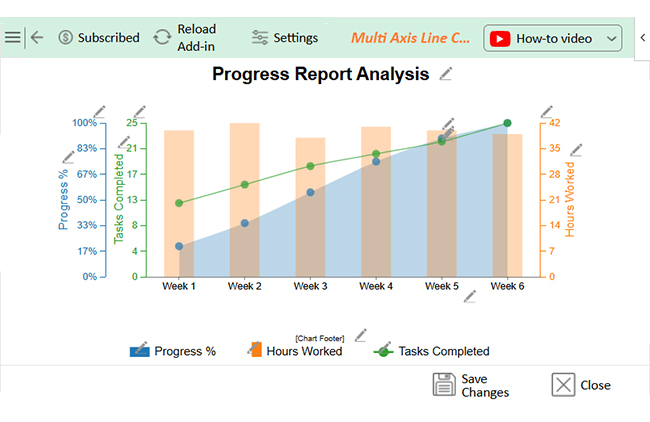
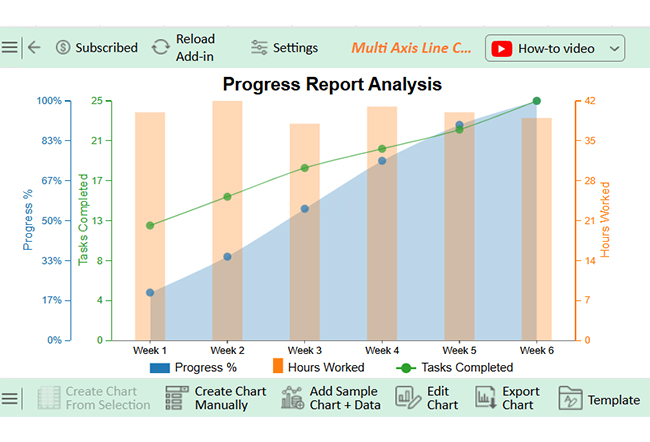
Are you craving for clearer insights from your progress reports? Check out the top five charts you can use to analyze them effectively. These charts were created using ChartExpo – a tool for powerful, easy-to-understand visualizations.
Have you ever been caught in a meeting where no one is on the same page? That’s what happens without a solid WIP report or progress format. Confusion grows, deadlines slip, and accountability fades. A monthly financial report template in Excel may show the numbers, but a progress format tells the story behind them.
Here’s why format matters:
You don’t need fancy tools to write an excellent progress report. You need structure. Clarity wins when you use monthly sales report templates or a basic document. The correct format keeps your team on track and your stakeholders informed.
Here’s how to write a progress report template that gets results.
Let’s be honest—Excel is excellent until it isn’t. Sure, it crunches numbers like a pro. But when it comes to showing those numbers in a way that makes sense? That’s where things get messy. This way, progress report templates feel more like puzzles than progress.
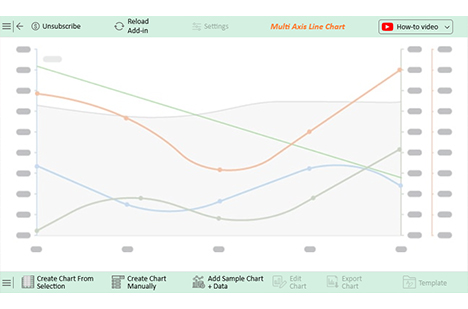
Data deserves better, especially in analysis, where visuals speak louder than rows and formulas. Enter ChartExpo. This tool turns plain Excel sheets into sharp, bright visuals, including scatter plots that can highlight sales follow-up statistics—no coding, no chaos.
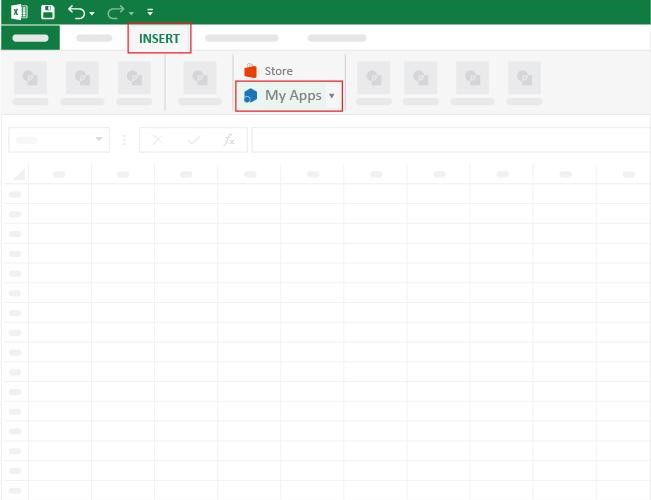
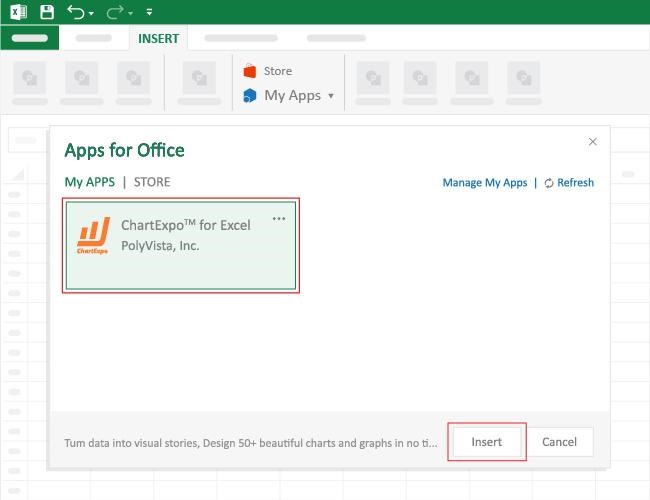
How to Install ChartExpo in Excel?
ChartExpo charts are available both in Google Sheets and Microsoft Excel. Please use the following CTAs to install the tool of your choice and create beautiful visualizations with a few clicks in your favorite tool.
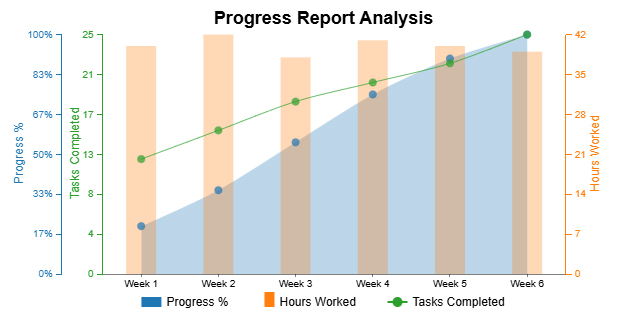
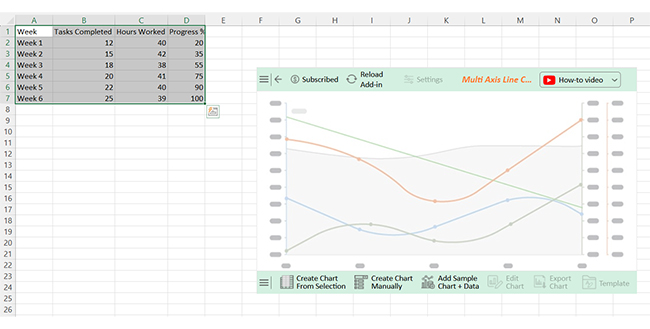
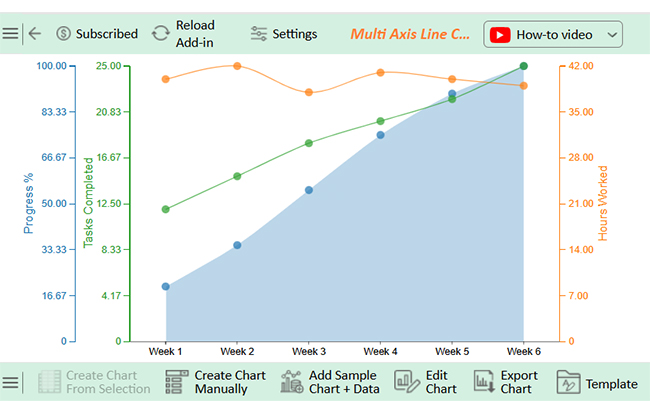
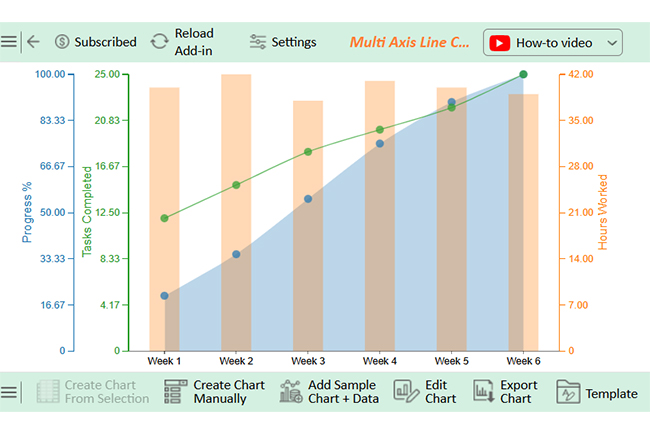
Let’s analyze this sample data in Excel using ChartExpo.
| Week | Tasks Completed | Hours Worked | Progress % |
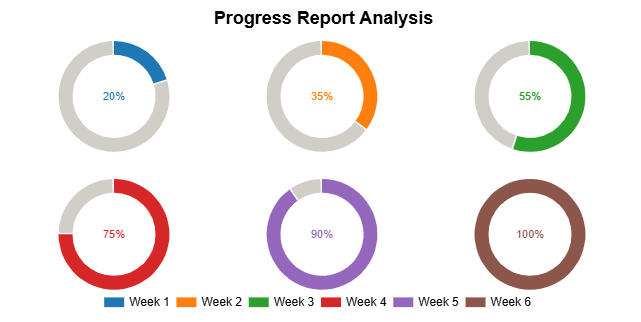
| Week 1 | 12 | 40 | 20 |
| Week 2 | 15 | 42 | 35 |
| Week 3 | 18 | 38 | 55 |
| Week 4 | 20 | 41 | 75 |
| Week 5 | 22 | 40 | 90 |
| Week 6 | 25 | 39 | 100 |
Weekly updates don’t have to feel like chores. They are powerful when done right. A strong weekly progress report template keeps your team synced and your project on track. Whether using spreadsheets or BI tools, these tips make reports clearer, faster, and more effective.
A progress report format includes objectives, completed tasks, ongoing work, challenges, next steps, and a summary. It’s structured and straightforward, and each section gives clear updates. This helps track progress and keeps everyone aligned.
The standard format has six parts: goals, completed work, current tasks, issues, upcoming steps, and conclusion. It’s used across industries, and clear headings make it easy to follow. This format supports accuracy, speed, and accountability.
A progress report template keeps work on track. It organizes updates so everyone knows what’s been done and what’s next. It helps managers lead better, and teams know where to focus, resulting in less chaotic deadlines.
This kind of reporting is part of smart Pivot reporting. You get insights, not clutter. Reports become tools, not chores.
Using tools like a monthly financial report template in Excel adds consistency. You get clear, time-based data, and progress becomes measurable. Templates also support strong management reporting. Leaders see updates fast, and decisions get made quickly.
Progress doesn’t speak for itself. A template gives it a voice. Install ChartExpo to visualize progress reports better and move forward with purpose.
How much did you enjoy this article?


Calculate accounts receivable turnover ratio to measure credit collection speed, improve cash flow, and strengthen your financial strategy. Read on!

Change Management KPIs are the key to tracking adoption, performance, and ROI during transitions. Find out which metrics matter. Read on!

Data collection methods and techniques determine the quality of every insight you act on. Explore key approaches for gathering reliable data. Read on!


