Categories
What does converting a Google Sheet to Excel mean? At first, it sounds simple. However, the reason behind it often reveals a more profound need for compatibility, control, or offline access.


So, why is converting a Google Sheet to Excel so common? Because businesses often share files between platforms. Finance teams may want the advanced charting in Excel. Or a client may ask for files in .xlsx format. It ensures everyone can open, edit, and use the data efficiently.
Another reason? Internet access. Excel works offline, whereas Google Sheets doesn’t – unless preloaded. That matters in industries where internet access is limited or restricted. Converting a Google Sheet to Excel ensures data is available anytime, even during travel or outages.
It’s also about compatibility with third-party tools. Many add-ins and software programs still favor Excel formats. Especially when using cool Excel charts and graphs or exporting insights.
Think of teams doing real-time analysis using Excel functions for data analysis. Or sales managers sharing monthly reports offline. These are practical, everyday reasons why conversions happen.
This isn’t about choosing sides. It’s about choosing tools that work for the task. By understanding the reason and the method, teams stay efficient, no matter the platform.
Definition: Converting a Google Sheet to Excel means changing a file from Google’s online format into Microsoft Excel. This lets you open and edit the file in Excel. It’s useful when working offline or using tools that support Excel only.
This process keeps your data, formulas, and layout mostly intact. It also helps when comparing Google Spreadsheets vs. Excel features. Many prefer Excel for advanced tools, especially when working with multiple Excel workbooks vs. worksheet formats.
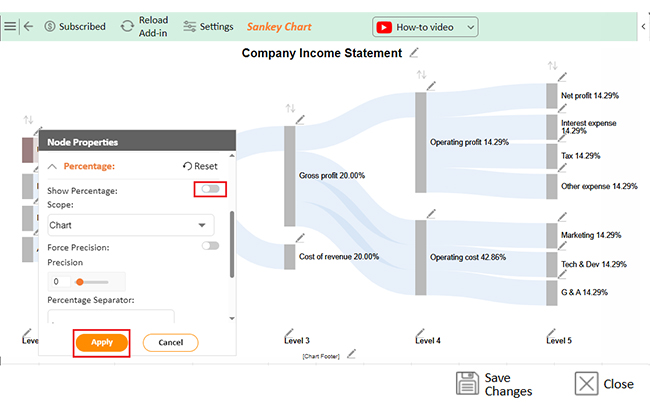
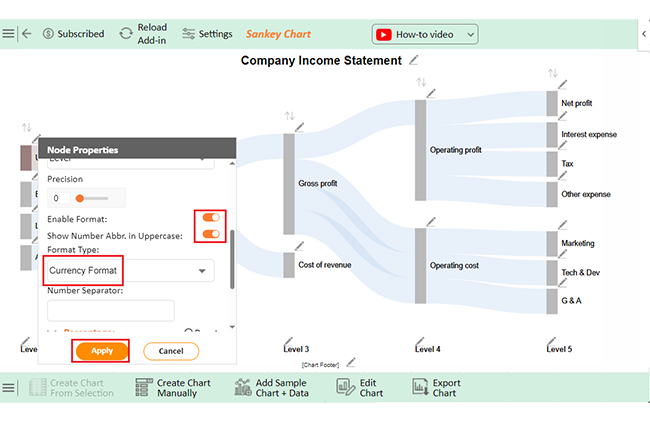
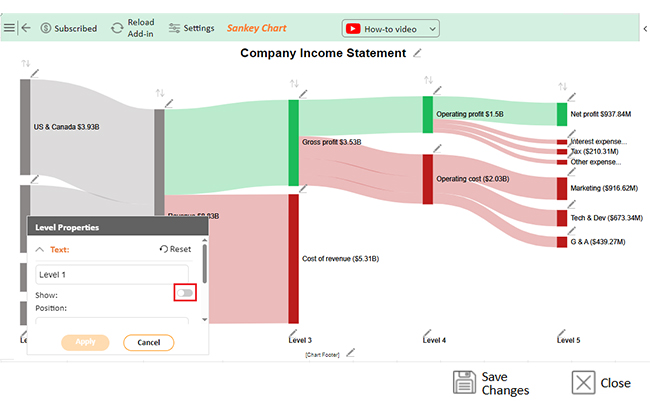
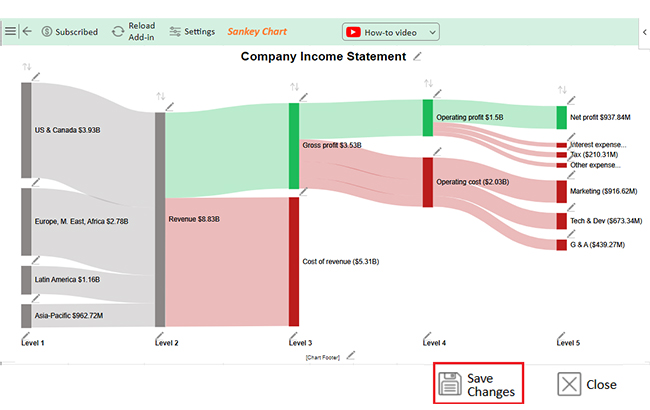
Explore the charts below when converting Google Sheets to Excel—made simple with ChartExpo.
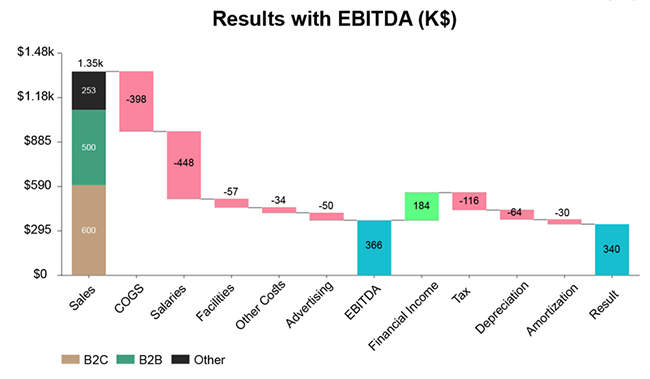
Have you ever tried opening a huge dataset only for it to freeze or lag? That’s where Excel steps in. Converting a Google Sheet to Excel isn’t about switching sides. It’s about choosing the tool that fits your task:
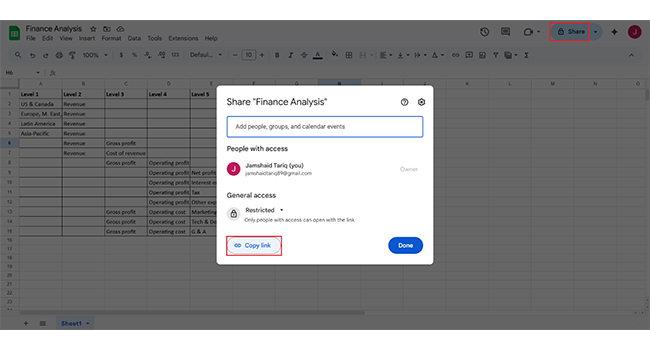
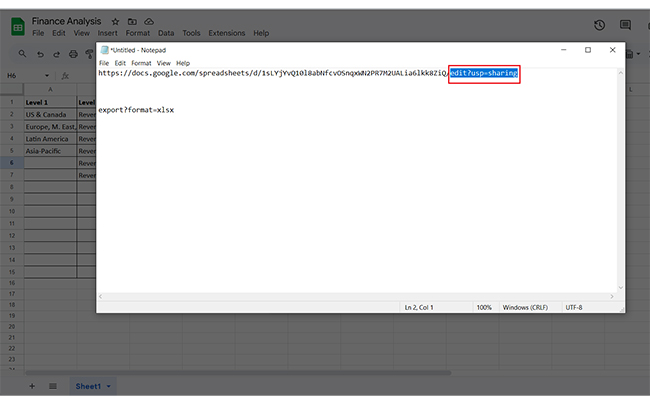
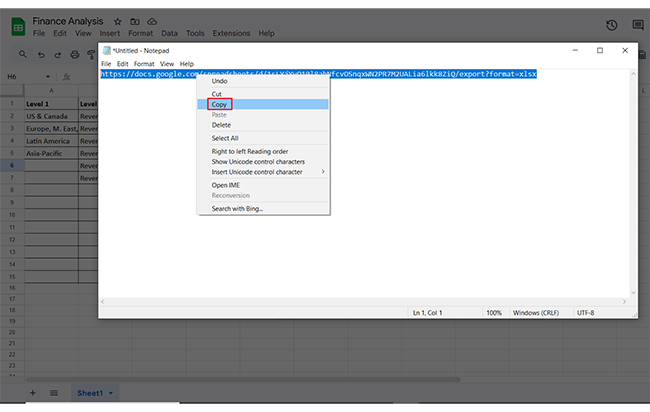
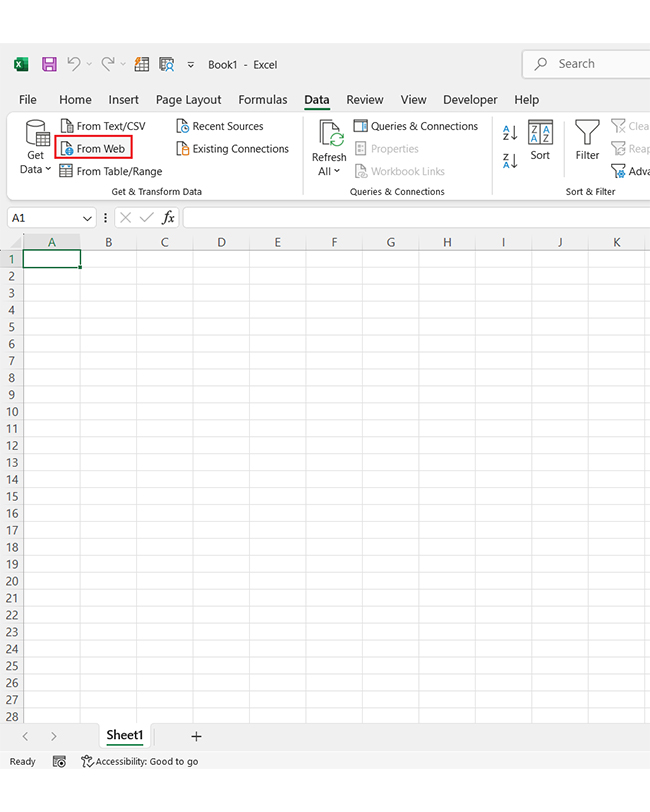
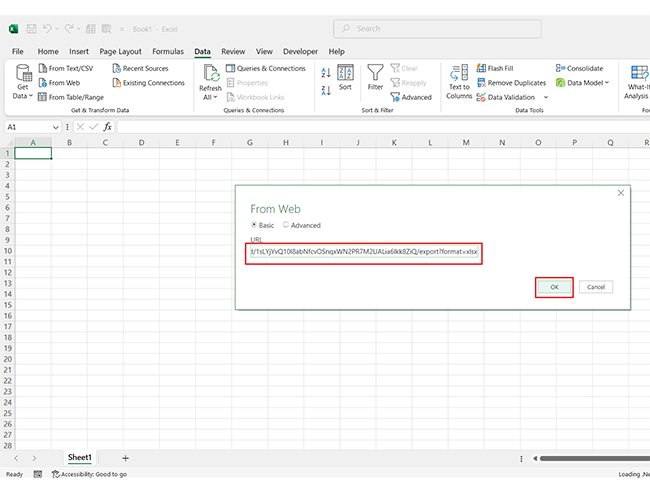
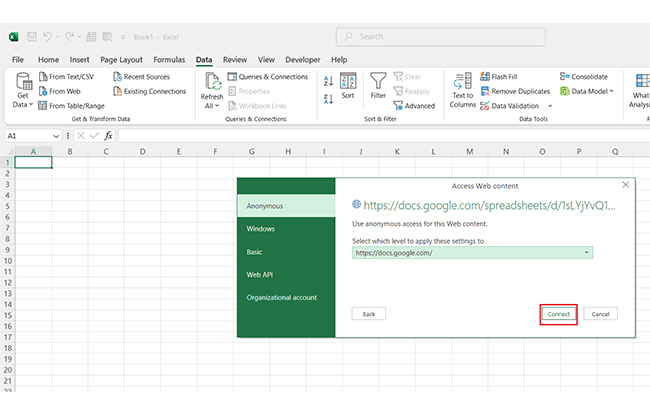
You don’t always need to leave Google Sheets—sometimes, you need it in Excel. Converting offers flexibility, whether offline or for building reports. You can download the file or create a live link. Both work—choose what fits your workflow.
Download Form:
Link Form:
What is meant by converting a Google Sheet to Excel? It’s not rocket science—it’s moving your data from the cloud to your desktop. Sometimes you need Excel’s muscle for formulas or offline access.
But here’s the catch: when it comes to data visualization, Excel doesn’t always shine. The charts can be dull, options are limited, and insights get buried in boring graphs—unless you use a Scatter chart to reveal patterns and relationships in your data clearly.
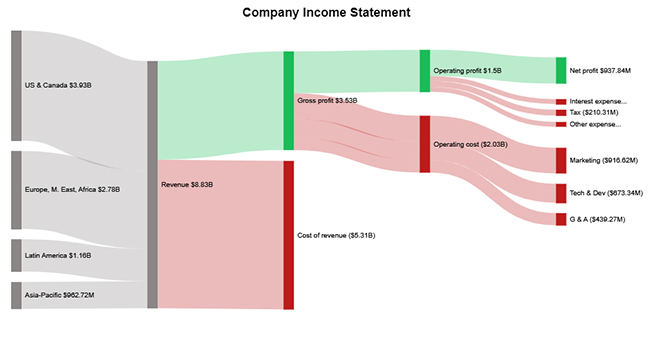
That’s where ChartExpo steps in. It turns raw numbers into stunning visuals, including a Sankey diagram that helps you understand data flow with clarity. Moreover, it’s fast, clear, and easy to use. So, if you’re switching to Excel, bring the best visuals with you. Don’t settle for default—make your data speak.
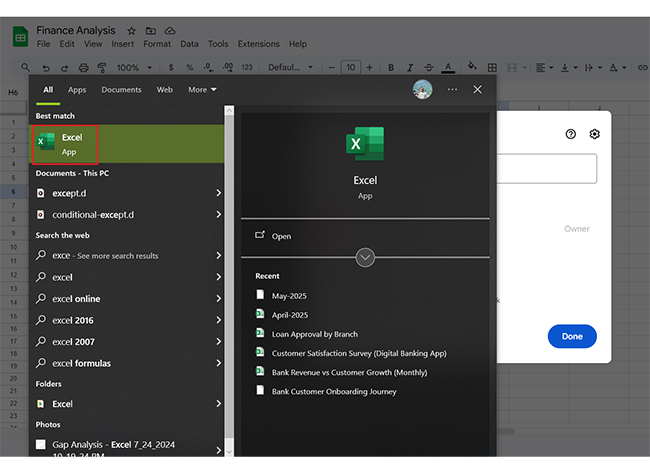
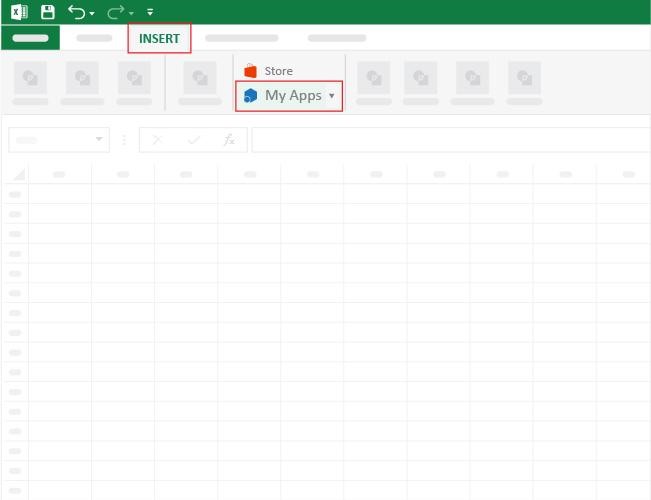
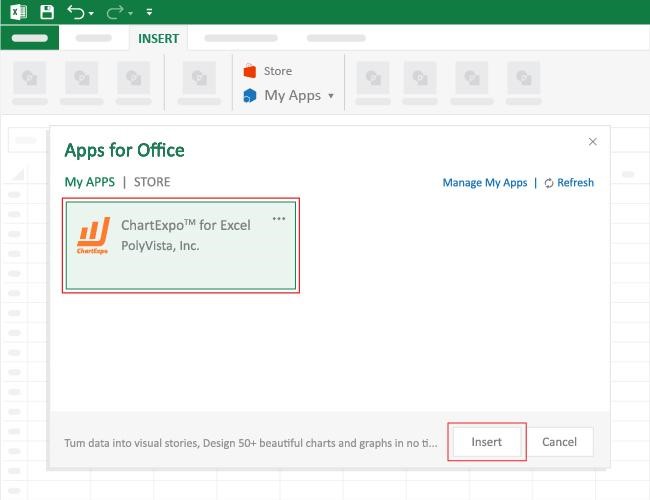
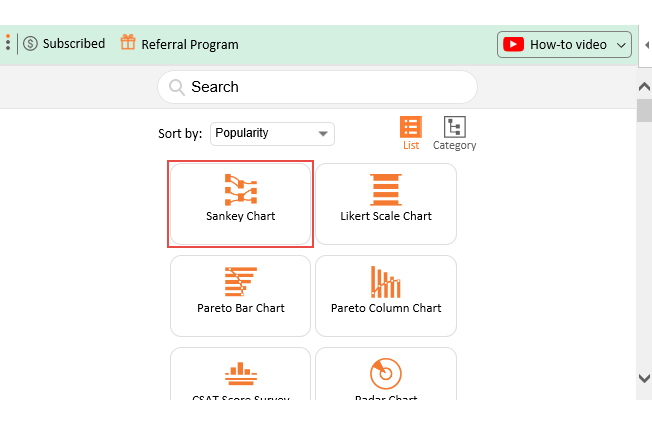
How to Install ChartExpo in Excel?
ChartExpo charts are available both in Google Sheets and Microsoft Excel. Please use the following CTAs to install the tool of your choice and create beautiful visualizations with a few clicks in your favorite tool.
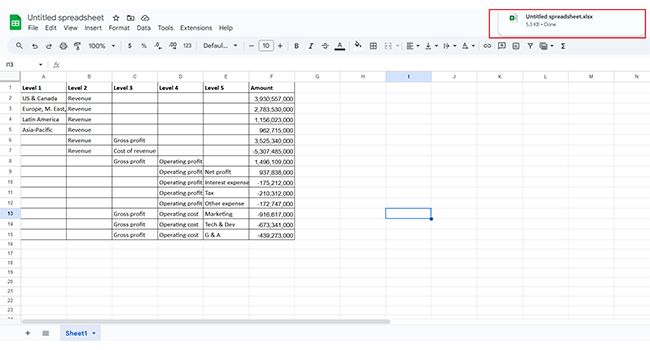
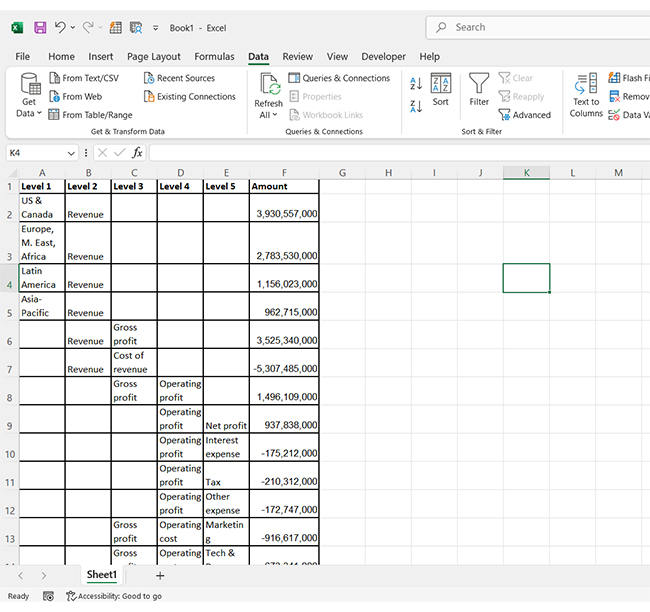
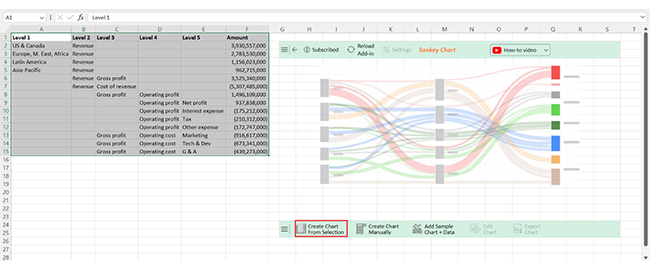
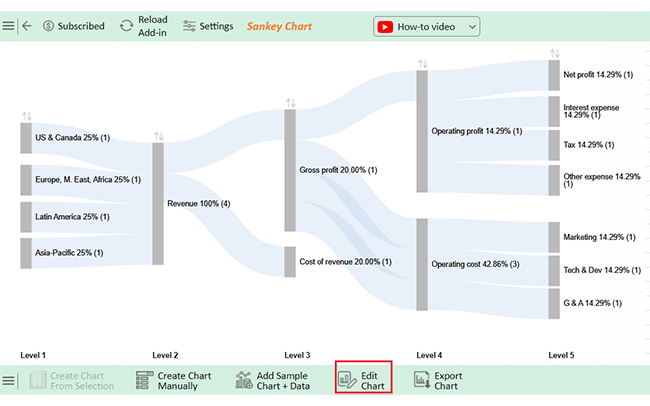
Let’s explore how to convert Excel to Google Sheets and analyze it using ChartExpo. You can also create a Sankey chart Excel visualization to better understand data flows before transferring your work to Google Sheets.
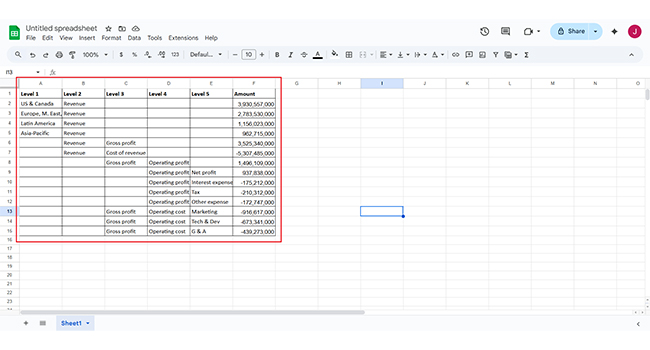
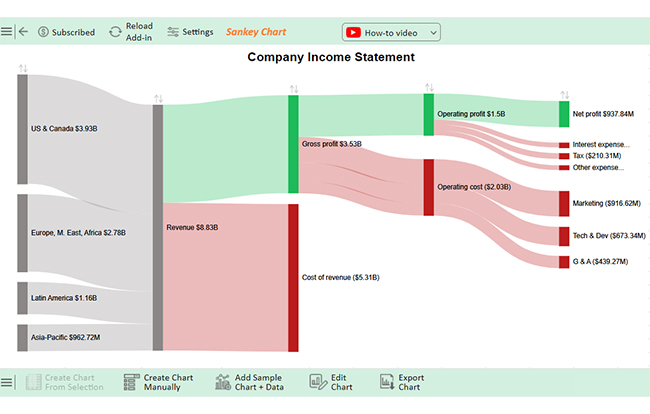
| Level 1 | Level 2 | Level 3 | Level 4 | Level 5 | Amount |
| US & Canada | Revenue | 3,930,557,000 | |||
| Europe, M. East, Africa | Revenue | 2,783,530,000 | |||
| Latin America | Revenue | 1,156,023,000 | |||
| Asia-Pacific | Revenue | 962,715,000 | |||
| Revenue | Gross profit | 3,525,340,000 | |||
| Revenue | Cost of revenue | (5,307,485,000) | |||
| Gross profit | Operating profit | 1,496,109,000 | |||
| Operating profit | Net profit | 937,838,000 | |||
| Operating profit | Interest expense | (175,212,000) | |||
| Operating profit | Tax | (210,312,000) | |||
| Operating profit | Other expense | (172,747,000) | |||
| Gross profit | Operating cost | Marketing | (916,617,000) | ||
| Gross profit | Operating cost | Tech & Dev | (673,341,000) | ||
| Gross profit | Operating cost | G & A | (439,273,000) |
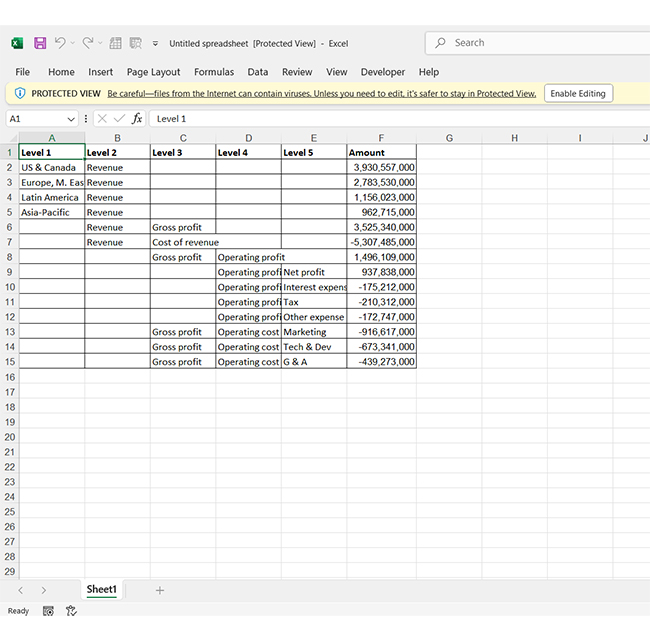
So, you’ve decided to go from Sheets to Excel. That’s a smart move—if done right. But exporting isn’t always a clean break. You might lose formulas, links, or formatting without the proper steps. These tips will help you make the transfer smooth, clean, and ready for Excel’s full potential.
Exporting Google Sheets to Excel might seem simple—until things start falling apart. It’s not always a smooth ride. You could lose more than you think.
Why?
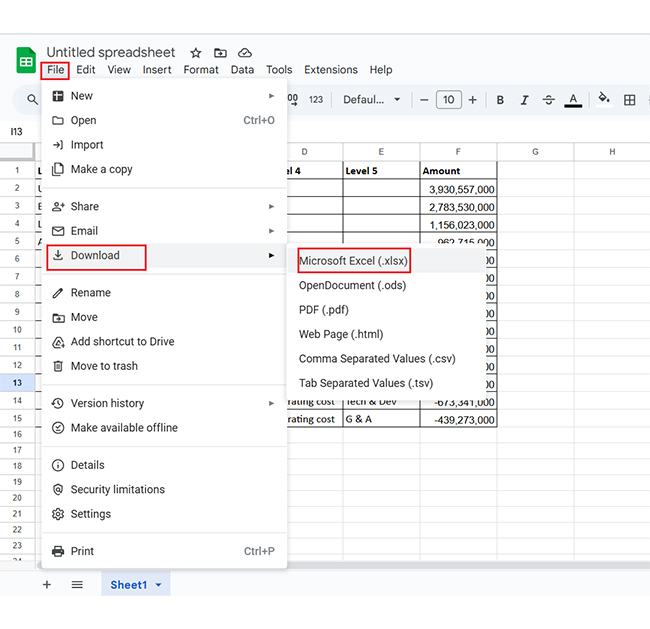
Click File > Download > Microsoft Excel (.xlsx) in Google Sheets. This keeps most formatting intact. Avoid custom fonts or scripts – they may not transfer well. Always double-check after export.
Yes, it can.
Converting a Google Sheet to Excel is about shifting your data to a more versatile format. It lets you work offline, use powerful features, and manage files with more control. For many teams, it’s a practical step toward efficiency.
Still, some trade-offs exist; You lose real-time collaboration, and certain features from Google Sheets won’t carry over. Always double-check formulas and formatting post-export.
To avoid issues, prepare your data. Remove unnecessary links or scripts. Use the .xlsx format to preserve layout and structure. This helps keep things smooth during transfer.
Excel offers deeper tools for analysis. It supports advanced Excel functions for data analysis that Google Sheets doesn’t. These functions give professionals more ways to work with large or complex datasets.
Excel also manages data better across files. You can organize content using the Excel workbook vs. worksheet structure. This keeps reports cleaner and projects more organized.
While Sheets is excellent for collaboration, Excel wins in performance. Choosing between them depends on your task, and understanding the benefits of both helps you work smarter, not harder. Sometimes, switching platforms is exactly what you need.
How much did you enjoy this article?


Learn how to use sparklines in Excel to quickly visualize trends inside cells. Discover types, creation steps, customization, use cases, benefits, and best practices.

Learn what a confidence interval graph is, how to create it in Excel, and how to interpret results to make more reliable, data-driven decisions.

A correlation matrix in Excel helps identify relationships between variables. Learn how to create, read, and use it for effective data analysis.


