• Home
  • Tools dropdown img
    • Spreadsheet Charts

      • ChartExpo for Google Sheets
      • ChartExpo for Microsoft Excel
    • Power BI Charts

      • Power BI Custom Visuals by ChartExpo
    • Word Cloud

  • Charts dropdown img
    • Chart Category

      • Bar Charts
      • Circle Graphs
      • Column Charts
      • Combo Charts
      • Comparison Charts
      • Line Graphs
      • PPC Charts
      • Sentiment Analysis Charts
      • Survey Charts
    • Chart Type

      • Box and Whisker Plot
      • Clustered Bar Chart
      • Clustered Column Chart
      • Comparison Bar Chart
      • Control Chart
      • CSAT Survey Bar Chart
      • CSAT Survey Chart
      • Dot Plot Chart
      • Double Bar Graph
      • Funnel Chart
      • Gauge Chart
      • Likert Scale Chart
      • Matrix Chart
      • Multi Axis Line Chart
      • Overlapping Bar Chart
      • Pareto Chart
      • Radar Chart
      • Radial Bar Chart
      • Sankey Diagram
      • Scatter Plot Chart
      • Slope Chart
      • Sunburst Chart
      • Tornado Chart
      • Waterfall Chart
      • Word Cloud
    • Google Sheets
      Microsoft Excel
  • Services
  • Pricing
  • Contact us
  • Blog
  • Support dropdown img
      • Gallery
      • Videos
      • Contact us
      • FAQs
      • Resources
    • Please feel free to contact us

      atsupport@chartexpo.com

Categories
All Data Visualizations Data Analytics Surveys
Add-ons/
  • Google Sheets
  • Microsoft Excel
  • Power BI
All Data Visualizations Data Analytics Surveys
Add-ons
  • Google Sheets
  • Microsoft Excel
  • Power BI

We use cookies

This website uses cookies to provide better user experience and user's session management.
By continuing visiting this website you consent the use of these cookies.

Ok

ChartExpo Survey


Home > Blog > Microsoft Excel

Excel Workbook vs Worksheet for Building Effective Visuals

What is an Excel workbook vs a worksheet? If you’ve ever used Excel, you’re already familiar with both. Yet, many people confuse these two vital elements. Understanding their differences can save you time and effort.

An Excel workbook is the entire file. Think of it as the container holding everything. Inside, you’ll find worksheets—individual pages where your data lives. A workbook can hold one worksheet or hundreds, depending on your needs. Each worksheet has its grid of rows and columns, ready for data, formulas, and charts. This structure is beneficial for tasks involving data modeling in Excel, allowing you to organize and analyze data.

Excel Workbook vs Worksheet

Why does this distinction matter? Because Excel is everywhere. It helps you work smarter and supports data democratization, giving you the tools to interpret and leverage information.

For instance, a workbook lets you keep multiple worksheets in one place. This structure is perfect for projects involving different data categories. Instead of juggling multiple files, everything stays organized and easy to navigate in one workbook. On the other hand, worksheets focus on the details. Both are crucial workspaces for critical data analysis tasks, such as creating a dynamic graph in Excel for visualizing trends.

Excel’s versatility makes it a favorite in offices, schools, and homes. You’ll boost your efficiency by mastering the difference between a workbook and a worksheet. These minor distinctions add up, helping you better manage your time and data.

Table of Contents:

  1. What is Workbook vs. Worksheet in Excel?
  2. What is the Difference Between a Workbook vs. Worksheet in Excel?
  3. What are the Benefits of Using Excel Worksheet vs. Spreadsheet?
  4. How to Use Excel Worksheets and Workbooks?
  5. Which is Best: Excel Workbooks or Worksheets?
  6. How to Analyze Data in Excel Workbook vs Worksheet?
  7. FAQs
  8. Wrap Up

First…

What is Workbook vs. Worksheet in Excel?

Definition: A workbook is the entire file, while a worksheet is a single page. Think of the workbook as a binder and the worksheets as individual sheets. A workbook can hold one or many worksheets, each organized into rows and columns.

This structure helps manage large data sets efficiently. It also allows for creating and customizing chart elements in Excel directly within individual worksheets.

Knowing the difference between an Excel workbook and a worksheet is key to improving task productivity. These minor distinctions make a big difference when working with data and visuals.

What is the Difference Between a Workbook vs. Worksheet in Excel?

Understanding the difference between a workbook and a worksheet can clear up confusion in data analysis. Although these two terms sound similar, they serve different purposes. Knowing their roles makes Excel more straightforward.

Let’s break it down with a simple comparison.

Feature Workbook Worksheet
Definition The entire Excel file A single page inside a workbook
Purpose Stores multiple worksheets Holds specific data or tasks
Structure Contains all sheets and settings Grid of rows and columns
Example Use Budget file for a year Monthly expenses sheet
Number Limit One per file Many within a workbook

What are the Benefits of Using Excel Worksheet vs. Spreadsheet?

Excel is a game-changer for managing and analyzing data. It’s more than just a spreadsheet. With data visualization tools, Excel transforms raw numbers into actionable insights. Excel makes data clear and easy to understand, from charts to pivot tables.

  • Powerful features: Excel has advanced tools like formulas, pivot tables, and macros that save you time and effort. These features let you automate tasks and perform complex calculations in seconds.
  • Better organization: With Excel, you can manage multiple sheets in a single file, grouping related data. It makes it easier to navigate and organize large projects or datasets. Before organizing your sheets, knowing how to clean data in Excel is essential. Why? To ensure your information is accurate and ready for analysis.
  • Visual impact: Make data analysis simple by turning raw data into visually appealing charts, graphs, and dashboards. Excel’s formatting options help you communicate insights clearly and professionally.
  • Seamless integration: Excel works effortlessly with other tools like Word, PowerPoint, and external databases. This compatibility makes sharing and collaborating on data simple and efficient.
  • Top-notch security: Excel offers robust security features like password protection and file encryption. Your sensitive data stays safe and accessible only to those you trust.

How to Use Excel Worksheets and Workbooks?

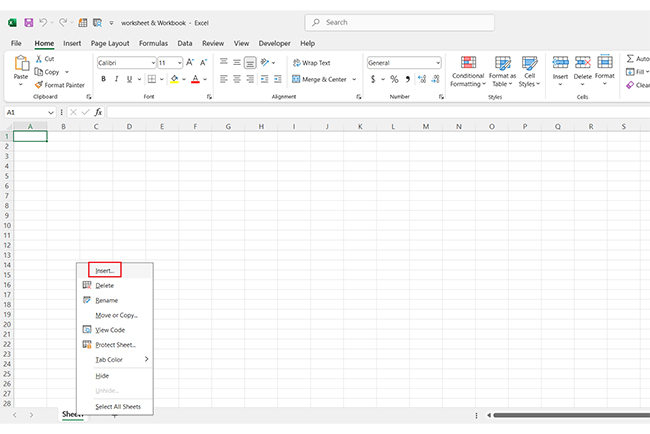
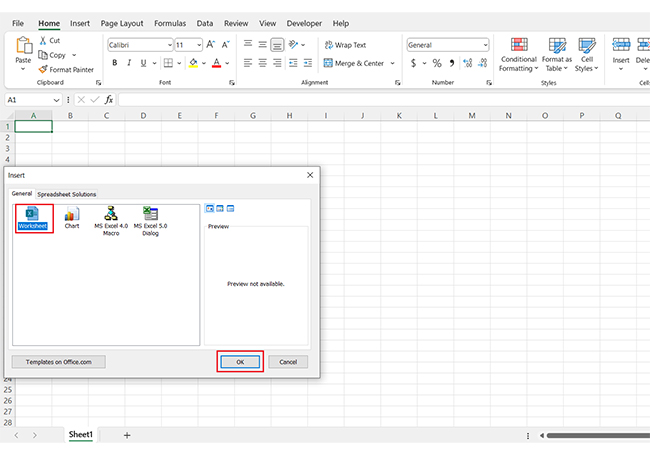
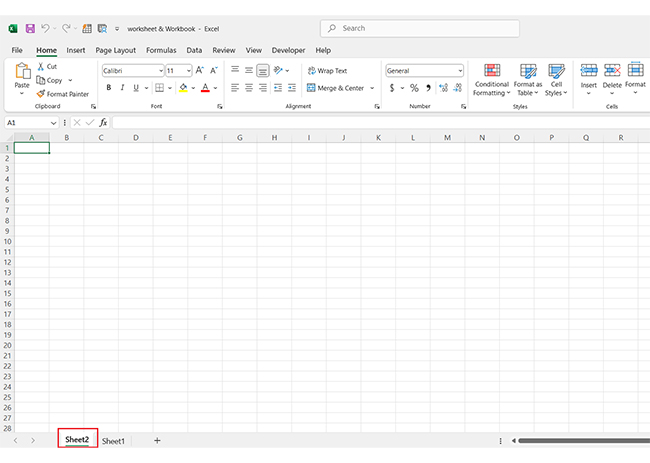
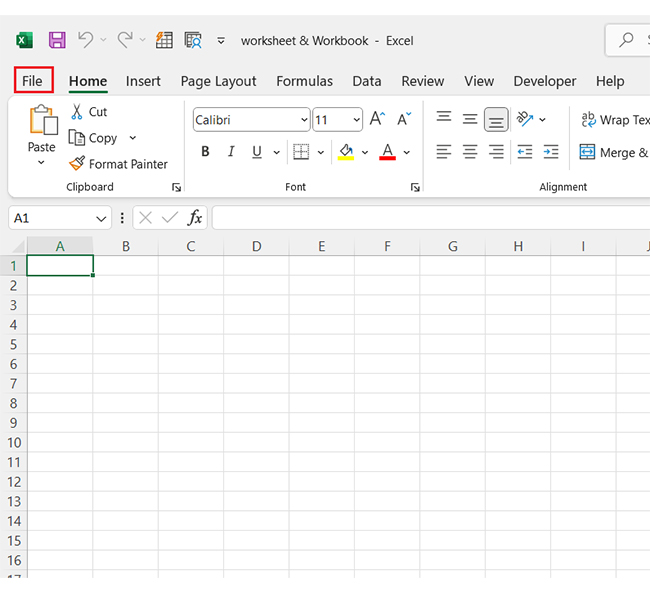
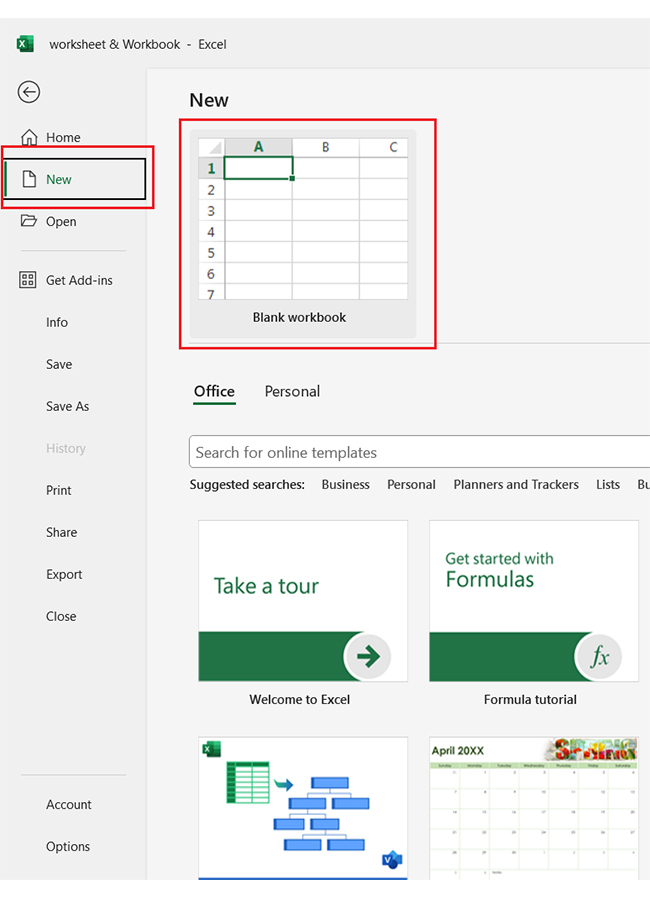
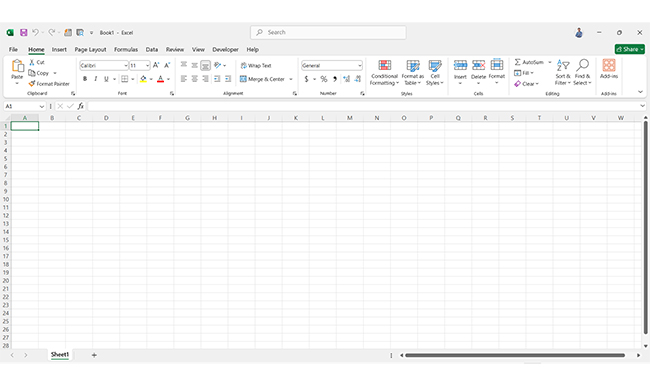
Getting started with Excel is easier than you think. Whether you’re organizing data, creating reports, or improving data presentation, here’s how to add and use Worksheets and Workbooks:

Worksheets

  1. Right-click anywhere on the sheet tabs at the bottom of the screen.
Right Click Anywhere on Sheet Tabs for Comparing Excel Workbook vs Worksheet
  1. Select “Insert”, then choose “Worksheet” and click “OK”.
Choose Worksheet and Click Ok for Comparing Excel Workbook vs Worksheet
  1. A new worksheet is ready for you to enter and analyze your data.
Enter and Analyze Data for Comparing Excel Workbook vs Worksheet

Workbooks

  1. Click the “File” tab in the top-left corner.
Click File Tab in Top Left Corner for Comparing Excel Workbook vs Worksheet
  1. Select “New”, then choose “Blank Workbook”.
Select New Then Choose Blank Workbook for Comparing Excel Workbook vs Worksheet
  1. A fresh workbook is created, giving you a clean slate to organize multiple worksheets.
Clean Slate to Organize Multiple Worksheets for Comparing Excel Workbook vs Worksheet

Which is Best: Excel Workbooks or Worksheets?

Choosing between Excel Workbooks and Worksheets depends on your goals. For instance, organizing data for Excel chart creation often starts with understanding this difference. Let’s break it down to help you decide:

Excel Workbook

  • Organizing multiple datasets: Workbooks are great for grouping related datasets into one file with multiple sheets. It keeps your data organized and easy to navigate.
  • Data management: You can quickly switch between sheets in a workbook, making it efficient for handling complex projects. This structure simplifies large-scale data organization.
  • Collaboration: Workbooks allow you to share all your related data in one file. It’s perfect for teamwork and reduces the hassle of managing multiple files.

Excel Worksheet

  • Specific tasks: Worksheets work best for focused tasks like individual reports, charts, or calculations. They’re lightweight and ideal for single-purpose data analysis.
  • Flexibility: You can add, edit, or delete individual sheets without impacting the rest of the workbook. This flexibility is handy for small, dynamic changes.
  • Data isolation: Use worksheets to separate unrelated datasets and prevent confusion. It’s an excellent way to ensure clarity and precision in your work.

Which is Better?

It depends. Workbooks are good for big projects and collaboration, while Worksheets are better for quick, focused work. The real power lies in knowing when to use each one.

How to Analyze Data in Excel Workbook vs Worksheet?

Excel is a powerful tool, but it’s easy to get tangled between its workbooks and worksheets. While these are essential for organizing data, they aren’t always ideal for presenting it. Data visualization plays a key role in data analysis—it turns numbers into actionable insights.

Unfortunately, Excel’s built-in charts can sometimes feel limiting. Why? If you want a dynamic graph in Excel, you might end up taking headache pills.

This is where ChartExpo comes into play. This Excel charts add-in expands your options for more flexibility, offering advanced visuals that improve your analysis.

With enhanced visuals, you can take visual analytics to the next level. ChartExpo helps uncover trends and patterns that standard tables or basic charts might miss. Whether you analyze sales data or project performance, better visuals lead to more precise insights.

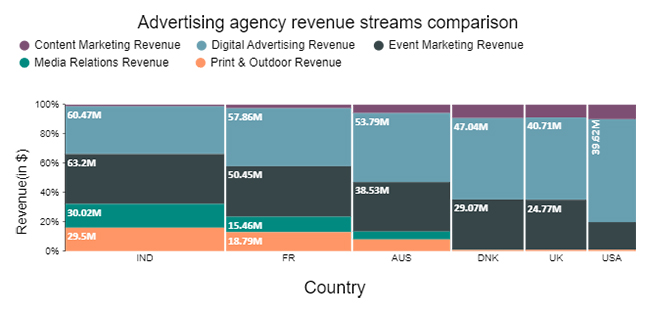
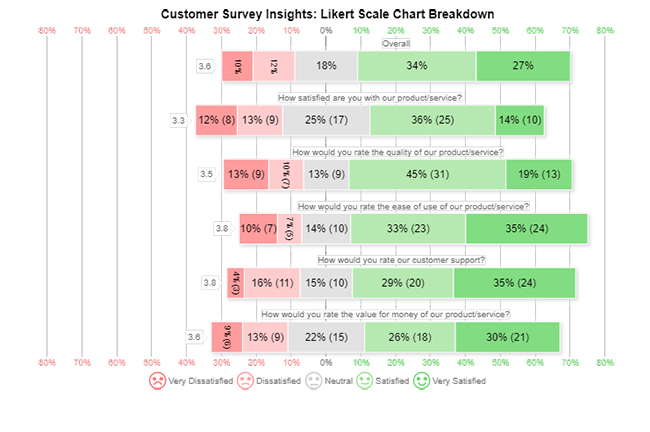
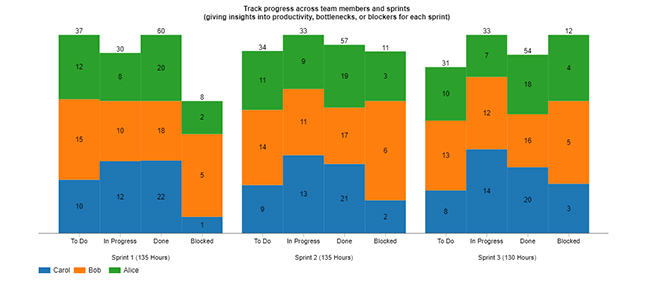
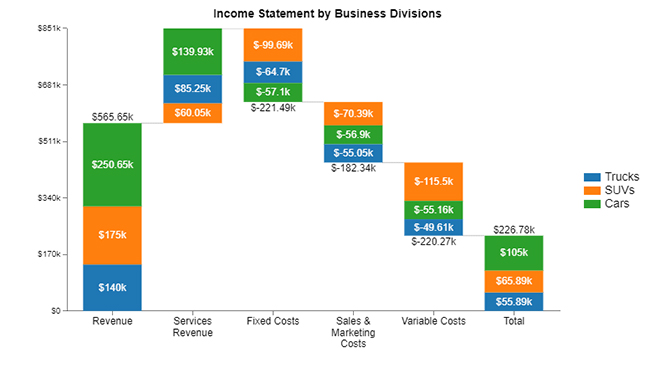
The charts below were created in Excel using ChartExpo:

Mosaic Plot (aka Mekko)

Mosaic Plot for Comparing Excel Workbook vs Worksheet

Likert Scale Chart

Likert Scale Chart for Comparing Excel Workbook vs Worksheet

Clustered Stacked Bar Chart

Clustered Stacked Bar Chart for Comparing Excel Workbook vs Worksheet

Stacked Waterfall Chart

Stacked Waterfall Chart for Comparing Excel Workbook vs Worksheet

Sankey Chart

Sankey Chart for Comparing Excel Workbook vs Worksheet

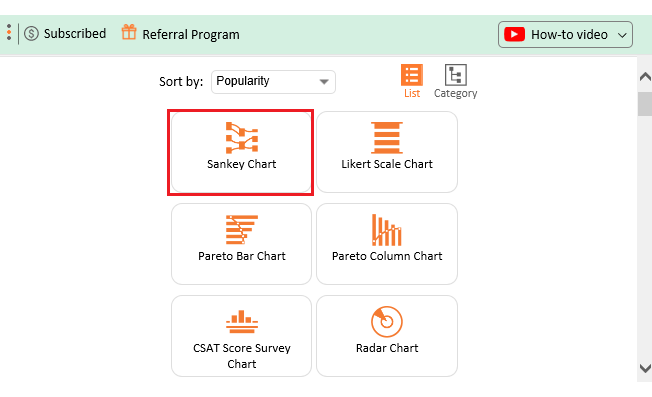
Let’s learn how to install ChartExpo in Excel.

  1. Open your Excel application.
  2. Open the worksheet and click the “Insert” menu.
  3. You’ll see the “My Apps” option.
  4. In the Office Add-ins window, click “Store” and search for ChartExpo on my Apps Store.
  5. Click the “Add” button to install ChartExpo in your Excel.

ChartExpo charts are available both in Google Sheets and Microsoft Excel. Please use the following CTAs to install the tool of your choice and create beautiful visualizations with a few clicks in your favorite tool.

Example

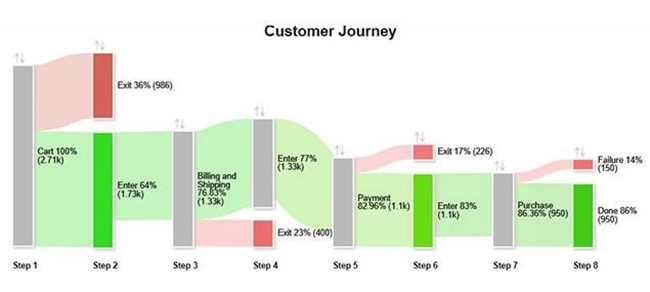
Let’s see how to create a dashboard in Excel with ChartExpo using the sample data below.

Step 1 Step 2 Step 3 Step 4 Step 5 Step 6 Step 7 Step 8 Users
Cart Exit 986
Cart Enter 1726
Billing and Shipping Exit 400
Enter Billing and Shipping Enter 1326
Payment Exit 226
Enter Payment Enter 1100
Purchase Failure 150
Enter Purchase Done 950
  • To get started with ChartExpo, install ChartExpo in Excel.
  • Now Click on My Apps from the INSERT menu.
insert chartexpo in excel
  • Choose ChartExpo from My Apps, then click Insert.
open chartexpo in excel
  • Once it loads, choose the “Sankey Chart” from the charts list.
search sankey chart in excel
  • Click the “Create Chart From Selection” button after selecting the data from the sheet, as shown.
Click Create Chart From Selection for Comparing Excel Workbook vs Worksheet
  • ChartExpo will generate the visualization below for you.
Initial Visual for Comparing Excel Workbook vs Worksheet
  • If you want to have the chart’s title, click Edit Chart, as shown in the above image.
  • Click the pencil icon next to the Chart Header to change the title.
  • It will open the properties dialog. Under the Text section, you can add a heading in Line 1 and enable Show.
  • Give the appropriate title of your chart and click the Apply button.
Add Chart Header for Comparing Excel Workbook vs Worksheet
  • Let’s give colors to the nodes. Click the pencil icon at the top of the nodes and go to “Node“. Select the color and click the “Apply” button to save all changes.
Select Color of Nodes and Click Apply for Comparing Excel Workbook vs Worksheet
  • Click the “Save Changes” button to persist the changes.
Click Save Changes for Comparing Excel Workbook vs Worksheet
  • Your final chart will appear as below.
Final Excel Workbook vs Worksheet

Insights

  • User cart activity: 1,726 users entered the cart.
  • Completed purchases: 950 users completed the purchase.
  • Key drop-off points: Significant drop-offs occurred at the billing/shipping and payment stages.
  • Improvement opportunity: Enhancing the checkout process could reduce drop-offs and increase conversions.

Excel Workbook vs Worksheet: How to Organize Data for Better Charts:

  1. Open your Excel Application.
  2. Install ChartExpo Add-in for Excel from Microsoft AppSource to create interactive visualizations.
  3. Select the Sankey Chart from the list of charts.
  4. Select your data.
  5. Click on the “Create Chart from Selection” button.
  6. Customize your chart properties to add header, axis, legends, and other required information.

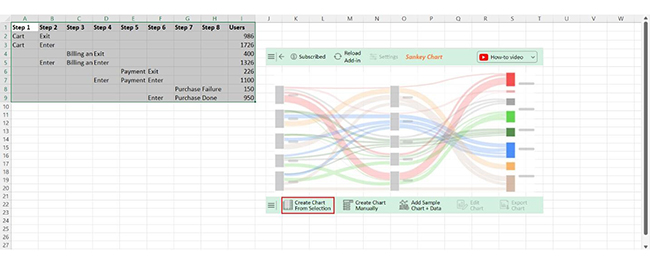
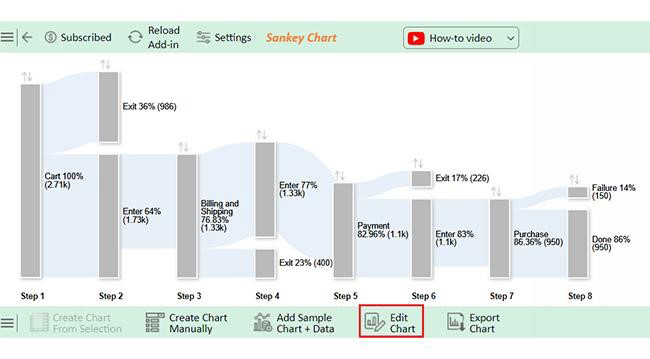
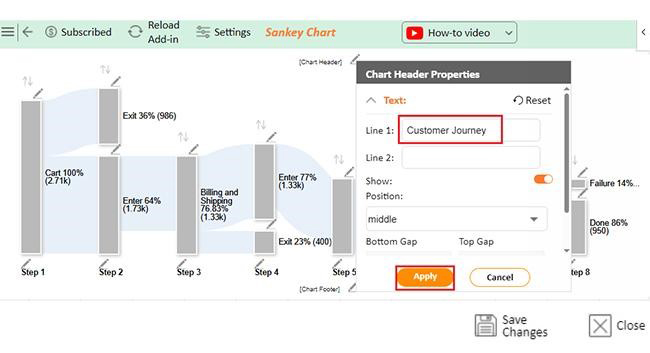
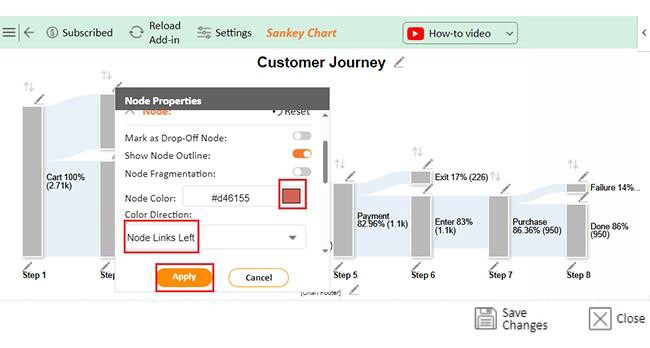
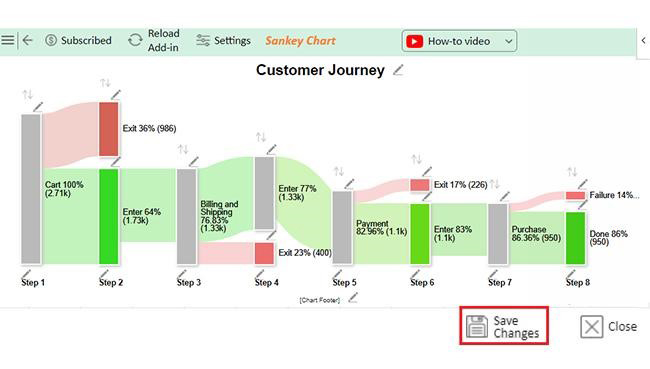
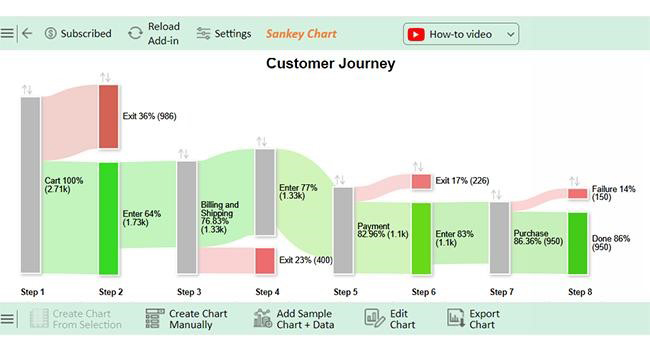
The following video will help you create a Sankey Chart in Microsoft Excel.

FAQs

Why is each Excel sheet called a workbook?

Each Excel sheet is part of a Workbook, which is a collection of multiple sheets. A workbook holds various worksheets under one file, enabling better organization, related data grouping, and streamlined management.

Is an entire Excel document called a workbook?

Yes, an entire Excel document is called a Workbook. It contains multiple worksheets within a single file. This structure allows you to manage and organize related datasets. This makes analyzing, sharing, and collaborating on data easier.

Why are multiple sheets used in a workbook?

Multiple sheets in a workbook allow better organization and separation of data. This setup ensures clarity, prevents confusion, and supports efficient handling of complex. They help group related datasets, simplify navigation, and enable detailed analysis of large-scale projects.

Wrap Up

Understanding the difference between an Excel workbook and a worksheet is essential. It’s the foundation of using Excel effectively. These two elements work together to manage data seamlessly and create the best-designed dashboards for any project.

A workbook is the complete file. It’s where all your data, settings, and sheets are stored. Think of it as the container that holds everything. Without the workbook, there’s no structure, making tasks like data merging in Excel nearly impossible.

A worksheet, on the other hand, is a single page within the workbook. Data is organized into rows and columns for analysis or creating custom Excel charts to visualize trends. Multiple worksheets can exist in one workbook, offering endless flexibility.

This setup makes Excel versatile. You can manage complex projects within a single file, and worksheets can focus on a specific part of your data, keeping everything organized. It’s also a key component in building a digital dashboard that provides actionable insights at a glance.

Using workbooks and worksheets can save time and help you manage data efficiently. This knowledge is invaluable, whether for personal use or professional tasks.

Next time you open Excel, remember that the workbook is the file, and worksheets are its pages. To take your productivity to the next level, install ChartExpo. It simplifies data visualization, making your work in Excel more insightful and organized.

How much did you enjoy this article?

ExcelAd2
Start Free Trial!
147764

Related articles

next previous
Microsoft Excel13 min read

Excel for Teachers for Insightful Preparation

Excel for teachers simplifies grading, tracks attendance, and organizes data. Find its key features, expert tips, and how ChartExpo enhances data visualization.

Microsoft Excel14 min read

How to Make a Cash Flow Diagram in Excel?

Learn how to make a Cash Flow Diagram in Excel. It will help you learn to visualize and analyze inflows and outflows of your business cash flow.

Microsoft Excel11 min read

Succession Planning Template for Long-Term Success

Succession Planning Templates help businesses prepare for leadership changes. Learn to create, analyze, and use them for seamless transitions and growth.

Microsoft Excel10 min read

Grant Tracking Spreadsheet: Insights Made Easy

A Grant Tracker Spreadsheet helps track funding, deadlines, and expenses in Excel. Learn to use grant tracking templates, analyze data, and stay organized.

Microsoft Excel10 min read

What is Excel Software Used for: A Complete Guide

What is Excel software used for? It organizes, analyzes, and manages data. Explore its workplace applications, benefits, and top tips for efficiency and more.

ChartExpo logo

Turn Data into Visual
Stories

CHARTEXPO

  • Home
  • Gallery
  • Videos
  • Services
  • Pricing
  • Contact us
  • FAQs
  • Privacy policy
  • Terms of Service
  • Sitemap

TOOLS

  • ChartExpo for Google Sheets
  • ChartExpo for Microsoft Excel
  • Power BI Custom Visuals by ChartExpo
  • Word Cloud

CATEGORIES

  • Bar Charts
  • Circle Graphs
  • Column Charts
  • Combo Charts
  • Comparison Charts
  • Line Graphs
  • PPC Charts
  • Sentiment Analysis Charts
  • Survey Charts

TOP CHARTS

  • Sankey Diagram
  • Likert Scale Chart
  • Comparison Bar Chart
  • Pareto Chart
  • Funnel Chart
  • Gauge Chart
  • Radar Chart
  • Radial Bar Chart
  • Sunburst Chart
  • see more
  • Scatter Plot Chart
  • CSAT Survey Bar Chart
  • CSAT Survey Chart
  • Dot Plot Chart
  • Double Bar Graph
  • Matrix Chart
  • Multi Axis Line Chart
  • Overlapping Bar Chart
  • Control Chart
  • Slope Chart
  • Clustered Bar Chart
  • Clustered Column Chart
  • Box and Whisker Plot
  • Tornado Chart
  • Waterfall Chart
  • Word Cloud
  • see less

RESOURCES

  • Blog
  • Resources
  • YouTube
SIGN UP FOR UPDATES

We wouldn't dream of spamming you or selling your info.

© 2025 ChartExpo, all rights reserved.