Categories
What is a responsibility assignment matrix template? If you’re managing a team, it’s one item you can’t ignore. Why? People don’t always know who’s in charge of what.
This slows down progress and creates tension. Teams spend more time figuring out ownership than solving problems. A responsibility assignment matrix template clears that fog.


Project delays are expensive. According to PMI, poor communication leads to project failure one-third of the time. With a responsibility assignment matrix template, teams stay aligned, and tasks progress. Leaders lead while contributors contribute – no guessing.
And what about time? Time is money. It’s confidence. It’s momentum. The clarity assignment matrix templates save time when managing internal projects or working with external partners.
Tools like a task-tracking spreadsheet also help. They show progress in real-time. By combining that with structured role assignments, you get less noise and more results. Moreover, a strong analytical report template tracks who did what and how well they did it.
Think about how you assign tasks today. Is everyone on the same page? Or are things slipping through the cracks? If there’s friction, start here: define roles, make them visible, and then use templates that work.
Definition: A responsibility assignment matrix (RAM) template is a chart that shows who is responsible for each project task. Roles are matched to specific actions, preventing confusion since everyone knows their assigned responsibilities.
Standard formats include RACI (Responsible, Accountable, Consulted, Informed). This helps teams stay on track and boosts accountability. This template is straightforward to use, and you can use it for any project. It keeps tasks organized, ensuring no missed duties, and the teamwork structure is maintained.
A responsibility assignment matrix template cuts through the chaos. It gives your team structure without slowing things down. Let’s break down why using one makes so much sense.
Not all teams work the same way. That’s why there’s no one-size-fits-all approach to assigning responsibilities. The good news? There are different types of responsibility assignment matrix templates built for other needs. Let’s look at a few popular ones.
Have you ever felt that your project plan is one big game of “Who’s doing what?” A responsibility assignment matrix template solves that quickly, and combining it with a Scatter plot can help visualize team roles, workloads, and overlaps at a glance.
But that’s only half the battle. Visualizing this kind of data is where things get tricky. Excel is excellent for crunching numbers, but let’s be honest—it’s not winning any awards for data storytelling. Spreadsheets can get messy fast. That’s where tools like an Sankey diagram can help simplify complex project data and make relationships between tasks and roles easier to understand.
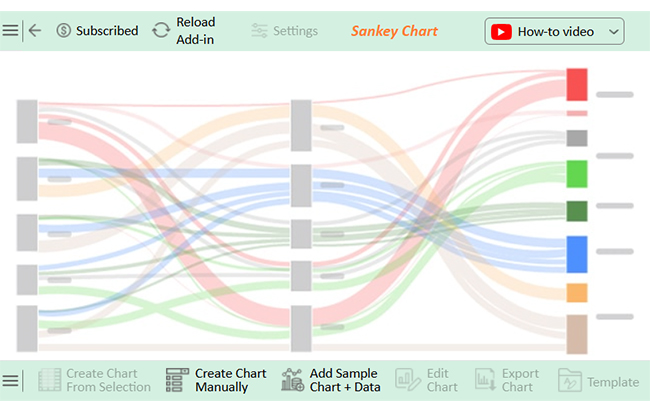
That’s where ChartExpo steps in. It brings clean, powerful visuals to your data, less chaos, and more clarity.
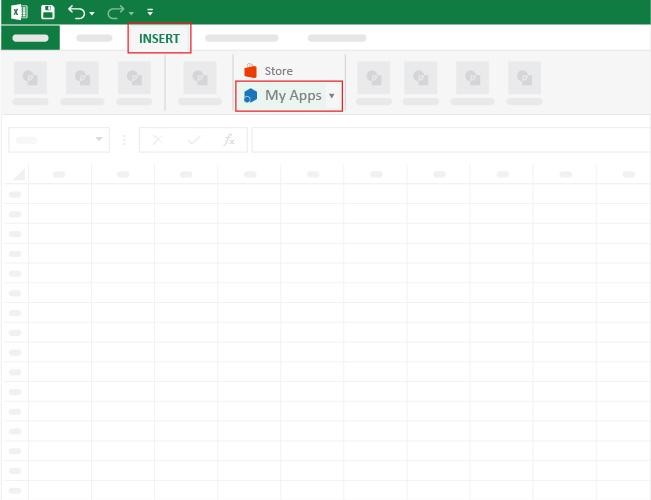
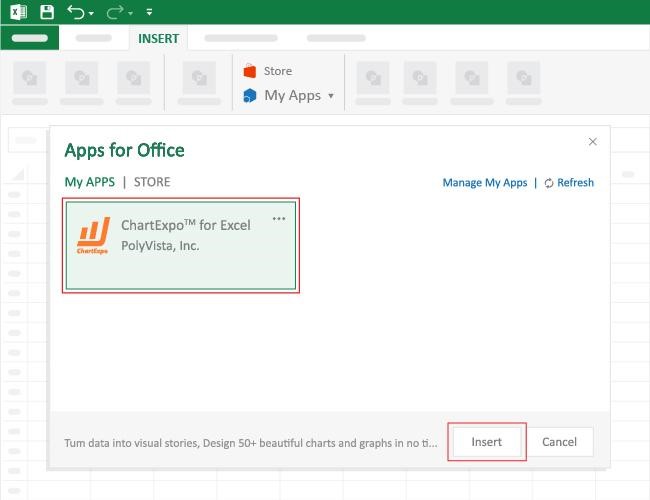
How to Install ChartExpo in Excel?
ChartExpo charts are available both in Google Sheets and Microsoft Excel. Please use the following CTAs to install the tool of your choice and create beautiful visualizations with a few clicks in your favorite tool.
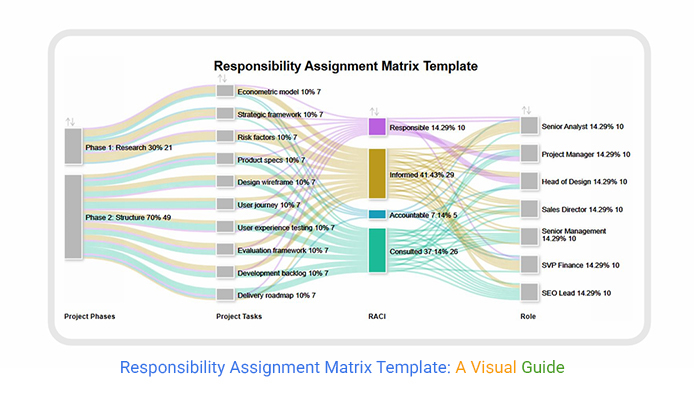
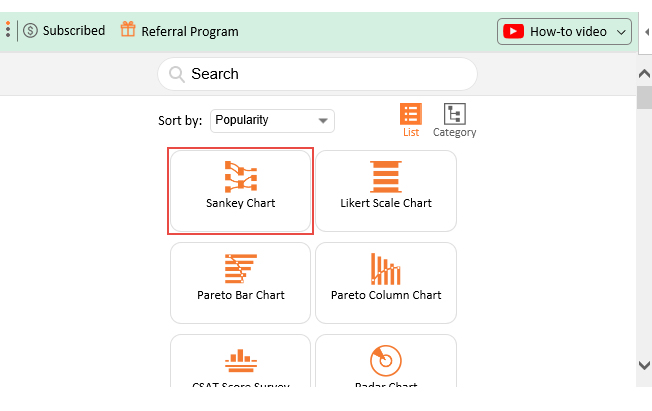
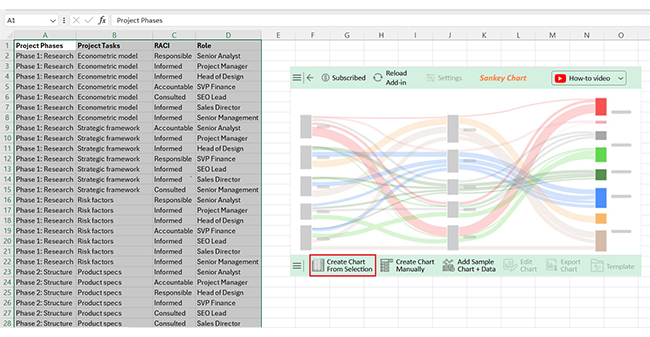
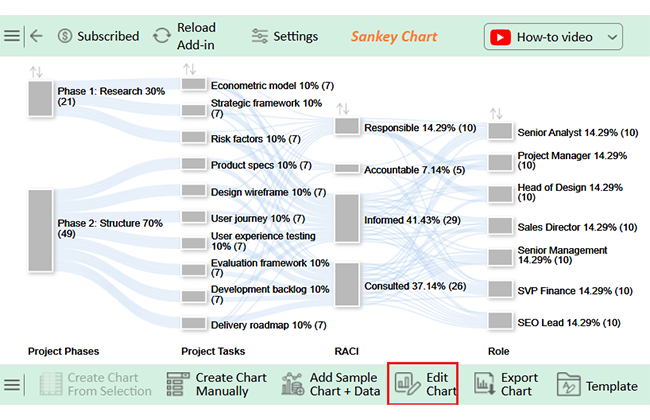
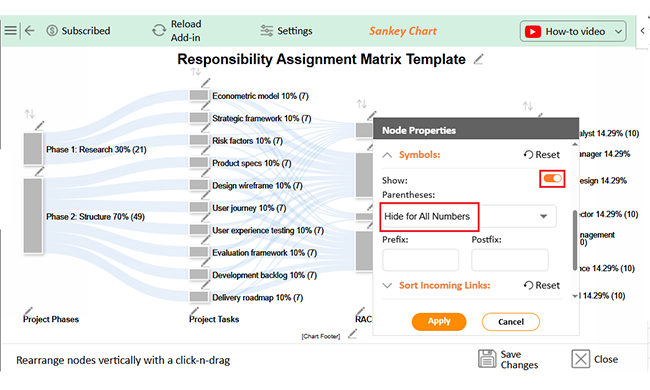
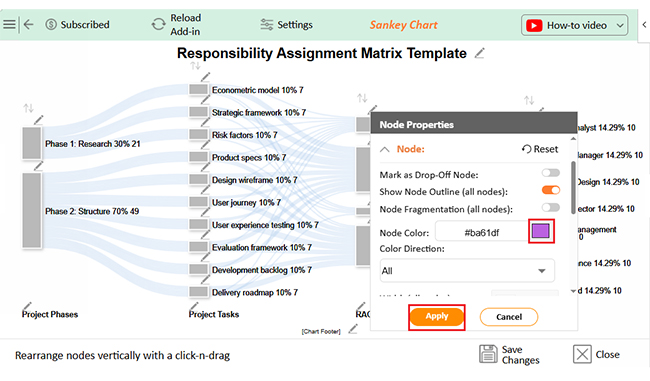
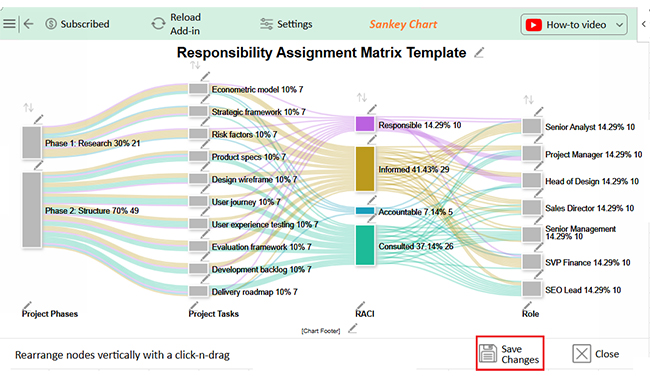
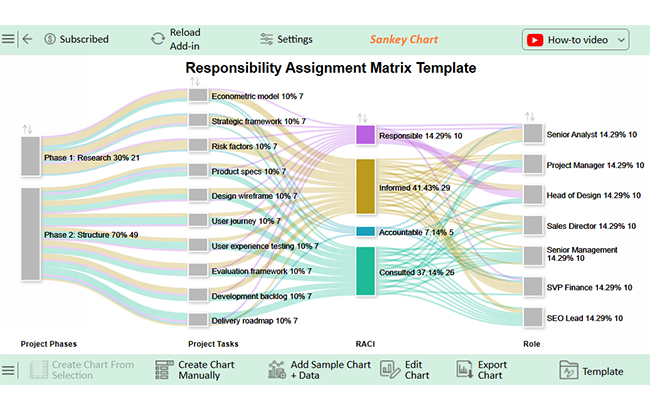
Let’s analyze this sample data in Excel using a Sankey chart in Excel with ChartExpo.
| Project Phases | Project Tasks | RACE | Role |
| Phase 1: Research | Econometric model | Responsible | Senior Analyst |
| Phase 1: Research | Econometric model | Informed | Project Manager |
| Phase 1: Research | Econometric model | Informed | Head of Design |
| Phase 1: Research | Econometric model | Accountable | SVP Finance |
| Phase 1: Research | Econometric model | Consulted | SEO Lead |
| Phase 1: Research | Econometric model | Informed | Sales Director |
| Phase 1: Research | Econometric model | Informed | Senior Management |
| Phase 1: Research | Strategic framework | Accountable | Senior Analyst |
| Phase 1: Research | Strategic framework | Informed | Project Manager |
| Phase 1: Research | Strategic framework | Informed | Head of Design |
| Phase 1: Research | Strategic framework | Responsible | SVP Finance |
| Phase 1: Research | Strategic framework | Informed | SEO Lead |
| Phase 1: Research | Strategic framework | Informed | Sales Director |
| Phase 1: Research | Strategic framework | Consulted | Senior Management |
| Phase 1: Research | Risk factors | Responsible | Senior Analyst |
| Phase 1: Research | Risk factors | Informed | Project Manager |
| Phase 1: Research | Risk factors | Informed | Head of Design |
| Phase 1: Research | Risk factors | Accountable | SVP Finance |
| Phase 1: Research | Risk factors | Informed | SEO Lead |
| Phase 1: Research | Risk factors | Informed | Sales Director |
| Phase 1: Research | Risk factors | Informed | Senior Management |
| Phase 2: Structure | Product Specs | Informed | Senior Analyst |
| Phase 2: Structure | Product Specs | Accountable | Project Manager |
| Phase 2: Structure | Product Specs | Responsible | Head of Design |
| Phase 2: Structure | Product Specs | Informed | SVP Finance |
| Phase 2: Structure | Product Specs | Consulted | SEO Lead |
| Phase 2: Structure | Product Specs | Consulted | Sales Director |
| Phase 2: Structure | Product Specs | Consulted | Senior Management |
| Phase 2: Structure | Design wireframe | Informed | Senior Analyst |
| Phase 2: Structure | Design wireframe | Consulted | Project Manager |
| Phase 2: Structure | Design wireframe | Responsible | Head of Design |
| Phase 2: Structure | Design wireframe | Informed | SVP Finance |
| Phase 2: Structure | Design wireframe | Consulted | SEO Lead |
| Phase 2: Structure | Design wireframe | Informed | Sales Director |
| Phase 2: Structure | Design wireframe | Consulted | Senior Management |
| Phase 2: Structure | User journey | Informed | Senior Analyst |
| Phase 2: Structure | User journey | Consulted | Project Manager |
| Phase 2: Structure | User journey | Responsible | Head of Design |
| Phase 2: Structure | User journey | Informed | SVP Finance |
| Phase 2: Structure | User journey | Consulted | SEO Lead |
| Phase 2: Structure | User journey | Consulted | Sales Director |
| Phase 2: Structure | User journey | Consulted | Senior Management |
| Phase 2: Structure | User experience testing | Informed | Senior Analyst |
| Phase 2: Structure | User experience testing | Consulted | Project Manager |
| Phase 2: Structure | User experience testing | Responsible | Head of Design |
| Phase 2: Structure | User experience testing | Informed | SVP Finance |
| Phase 2: Structure | User experience testing | Consulted | SEO Lead |
| Phase 2: Structure | User experience testing | Consulted | Sales Director |
| Phase 2: Structure | User experience testing | Consulted | Senior Management |
| Phase 2: Structure | Evaluation framework | Informed | Senior Analyst |
| Phase 2: Structure | Evaluation framework | Responsible | Project Manager |
| Phase 2: Structure | Evaluation framework | Consulted | Head of Design |
| Phase 2: Structure | Evaluation framework | Informed | SVP Finance |
| Phase 2: Structure | Evaluation framework | Consulted | SEO Lead |
| Phase 2: Structure | Evaluation framework | Informed | Sales Director |
| Phase 2: Structure | Evaluation framework | Consulted | Senior Management |
| Phase 2: Structure | Development backlog | Informed | Senior Analyst |
| Phase 2: Structure | Development backlog | Responsible | Project Manager |
| Phase 2: Structure | Development backlog | Consulted | Head of Design |
| Phase 2: Structure | Development backlog | Informed | SVP Finance |
| Phase 2: Structure | Development backlog | Consulted | SEO Lead |
| Phase 2: Structure | Development backlog | Informed | Sales Director |
| Phase 2: Structure | Development backlog | Consulted | Senior Management |
| Phase 2: Structure | Delivery roadmap | Consulted | Senior Analyst |
| Phase 2: Structure | Delivery roadmap | Responsible | Project Manager |
| Phase 2: Structure | Delivery roadmap | Accountable | Head of Design |
| Phase 2: Structure | Delivery roadmap | Consulted | SVP Finance |
| Phase 2: Structure | Delivery roadmap | Consulted | SEO Lead |
| Phase 2: Structure | Delivery roadmap | Consulted | Sales Director |
| Phase 2: Structure | Delivery roadmap | Informed | Senior Management |
A responsibility assignment matrix template only works if it’s built the right way. The goal? Clarity without clutter and simplicity without skipping key steps. Here’s how to get it right from the start:
Responsible, Accountable, Consulted, and Informed. These define who does the work, who approves it, who gives input, and who stays updated. Together, they bring clarity to team roles and task ownership.
A RAM is the overall chart showing task-role assignments. RACI is a specific model used within a RAM. It outlines how each role relates to a task using the four key components.
A responsibility assignment matrix template is a powerful tool for clarifying roles in any project. It is simple yet effective in showing who is responsible for what tasks. Defining roles removes confusion and ensures everyone knows their responsibilities. This is similar to understanding what is a confusion matrix. Here, clarity and correct interpretation of data can lead to better decisions.
This template helps you avoid overlap and ensure accountability. It’s useful when multiple stakeholders are involved, as it keeps track of who needs to be consulted. Clear role assignments benefit both large teams and smaller projects.
The responsibility assignment matrix template works seamlessly with other project management tools. Pair it with a task-tracking spreadsheet for progress or a covariance matrix for performance analysis. The key is consistency—regular updates keep the matrix aligned with the project’s needs.
Ultimately, this template enhances communication, increases efficiency, and supports better decision-making. It’s a game-changer for managing tasks and making sure things get done.
So, do not hesitate. Install ChartExpo to visualize assignments with clarity and impact. Clear roles lead to better outcomes.
How much did you enjoy this article?


Calculate accounts receivable turnover ratio to measure credit collection speed, improve cash flow, and strengthen your financial strategy. Read on!

Change Management KPIs are the key to tracking adoption, performance, and ROI during transitions. Find out which metrics matter. Read on!

Data collection methods and techniques determine the quality of every insight you act on. Explore key approaches for gathering reliable data. Read on!


