• Home
  • Tools dropdown img
    • Spreadsheet Charts

      • ChartExpo for Google Sheets
      • ChartExpo for Microsoft Excel
    • Power BI Charts

      • Power BI Custom Visuals by ChartExpo
    • Word Cloud

  • Charts dropdown img
    • Chart Category

      • Bar Charts
      • Circle Graphs
      • Column Charts
      • Combo Charts
      • Comparison Charts
      • Line Graphs
      • PPC Charts
      • Sentiment Analysis Charts
      • Survey Charts
    • Chart Type

      • Box and Whisker Plot
      • Clustered Bar Chart
      • Clustered Column Chart
      • Comparison Bar Chart
      • Control Chart
      • CSAT Survey Bar Chart
      • CSAT Survey Chart
      • Dot Plot Chart
      • Double Bar Graph
      • Funnel Chart
      • Gauge Chart
      • Likert Scale Chart
      • Matrix Chart
      • Multi Axis Line Chart
      • Overlapping Bar Chart
      • Pareto Chart
      • Radar Chart
      • Radial Bar Chart
      • Sankey Diagram
      • Scatter Plot Chart
      • Slope Chart
      • Sunburst Chart
      • Tornado Chart
      • Waterfall Chart
      • Word Cloud
    • Google Sheets
      Microsoft Excel
  • Services
  • Pricing
  • Contact us
  • Blog
  • Support dropdown img
      • Gallery
      • Videos
      • Contact us
      • FAQs
      • Resources
    • Please feel free to contact us

      atsupport@chartexpo.com

Categories
All Data Visualizations Data Analytics Surveys
Add-ons/
  • Google Sheets
  • Microsoft Excel
  • Power BI
All Data Visualizations Data Analytics Surveys
Add-ons
  • Google Sheets
  • Microsoft Excel
  • Power BI

We use cookies

This website uses cookies to provide better user experience and user's session management.
By continuing visiting this website you consent the use of these cookies.

Ok

ChartExpo Survey


Home > Blog > Data Analytics

Budgeting in Education: A Visual Walk Through

What is budgeting in education? It’s a decisive process that determines how schools spend money. With some decentralization, proper educational budgetary allocation can directly improve teaching and learning quality.

Budgeting in Education

Large amounts require financial management. The goal of budgeting in education is to provide a better understanding of budgeting and improve spending decisions. Every decision needs to be carefully planned. Tools such as a monthly finance report help institutions understand their spending and where they could improve.

A clear budget allows schools to avoid budget deficits. Analyzing these finances using data visualization tools makes it easier to see trends. For instance, a budget deficit by year graph can highlight potential shortfalls, guiding future planning.

Therefore, budgeting in education isn’t just about balancing numbers. It’s about setting priorities to ensure the best outcomes for students and staff.

Let’s dive deeper.

Table of Contents:

  1. What is Educational Budgeting?
  2. Why Budgeting in Educational Management is Important?
  3. Key Components of a Teaching Budget
  4. What is the Educational Budgeting Process?
  5. How to Visualize Educational Budgeting in Excel?
  6. Tools and Techniques for Budgeting in Education
  7. Common Challenges in Educational Budgeting
  8. Financial Educational Budgeting Best Practices
  9. FAQs
  10. Wrap Up

What is Educational Budgeting?

Definition: Educational budgeting is planning how funds are used in schools or academic programs. It involves setting priorities and allocating resources, including teacher salaries, classroom supplies, and technology. A clear budget supports better learning outcomes and ensures accountability and transparency.

School leaders often use a monthly finance report to track spending and adjust plans. Moreover, good budgeting relies on data analysis to make informed decisions. It helps meet both short-term and long-term goals. This is essential for effectively managing limited resources in education.

Why Budgeting in Educational Management is Important?

Budgeting is more than just a financial task—it’s a strategic tool that shapes a school or institution’s success. Effective budgeting helps schools maximize limited resources, ensuring every dollar is spent wisely.

Here’s why budgeting in education is essential:

  • Efficient resource allocation: Budgeting helps schools focus funds where they’re needed most. Tools like a finance dashboard in Excel make tracking and allocating resources easier.
  • Financial accountability: A clear budget prevents overspending and ensures the correct use of funds. Reviewing financial reports with data analysis tools ensures transparency and accountability.
  • Sustaining long-term goals: Budgeting sets aside funds for future growth, helping schools align their spending with long-term educational goals.
  • Enhancing decision-making: A structured budget guides key decisions about spending and staffing. A budget deficit by year graph helps identify areas needing attention.
  • Improved student experience: Proper budgeting enhances the student experience. Schools can invest in better resources and programs, giving students more opportunities to succeed.

Key Components of a Teaching Budget

Creating a teaching budget is essential for ensuring schools have the resources to provide quality education. It’s about ensuring the funds are directed to the areas that matter most. Let’s explore the key components of a teaching budget that keep everything running smoothly:

  • Salaries and wages: A large portion of the budget comprises teacher salaries. Ensuring competitive pay attracts and retains skilled educators.
  • Instructional materials and supplies: Schools require the appropriate resources to teach. When teachers must budget for books, paper, and other supplies, this cuts into classroom  supplies.
  • Professional development: Educators must keep pace with new developments through professional development programs. This ongoing professional development requires budgeting and is essential to teacher growth.
  • Technology and equipment: Technology and advanced equipment play a vital role in education nowadays. They include tools like computers, projectors, and smart boards to enhance instruction.
  • Classroom maintenance: A clean, safe environment is essential for learning. Budgeting for regular maintenance keeps classrooms in top condition for students and teachers.
  • Student support services: Services like counseling, tutoring, and special education support are essential. Allocating funds for these services ensures every student gets the help they need to succeed.

What is the Educational Budgeting Process?

The educational budgeting process is the backbone of financial planning in schools. A well-executed budget helps schools thrive, even with limited resources. Let’s examine the steps involved in creating a solid educational budget.

  1. Needs assessment: The first step is understanding what the school needs. This involves gathering input from teachers, staff, and administration to identify key budget priorities.
  2. Revenue estimation: Next, schools estimate how much money they will have. It includes funding from taxes, grants, and other sources, which is tracked in the finance dashboard in Excel.
  3. Expense allocation: Once revenue is estimated, the next step is to allocate funds. This involves deciding how to divide the money among different departments, such as salaries, technology, and maintenance.
  4. Budget preparation: With the allocations in place, the budget is prepared. This document outlines all the planned expenditures and expected revenues for the year.
  5. Approval and review: The relevant authorities, such as the school board, then approve the budget. They ensure it aligns with the school’s priorities and goals.
  6. Monitoring and adjusting: Finally, the budget is regularly monitored. Spending is adjusted as needed to stay on track and maintain stability.

How to Visualize Educational Budgeting in Excel?

So, what exactly is budgeting in education? It’s the art of juggling resources to ensure schools run while providing the best possible experience for students.

But here’s the catch—Excel can track expenses, but it can fall short when it comes to visualizing complex data. You need something that turns those numbers into something meaningful and easy to understand.

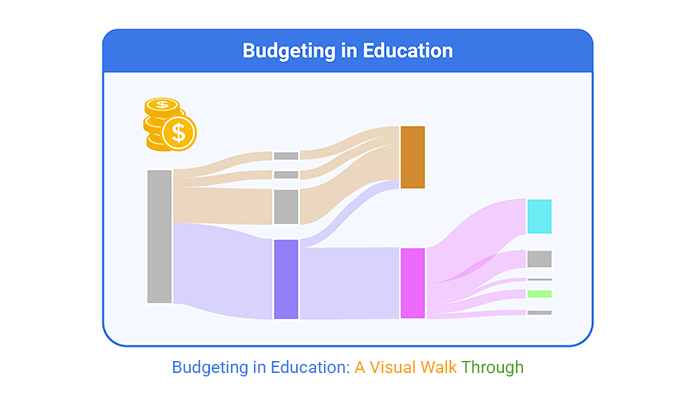
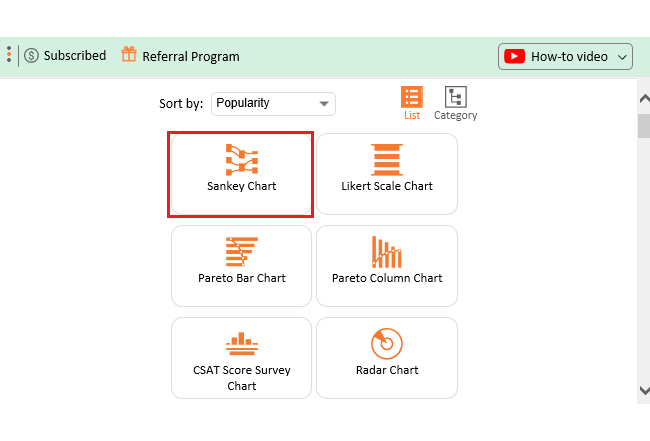
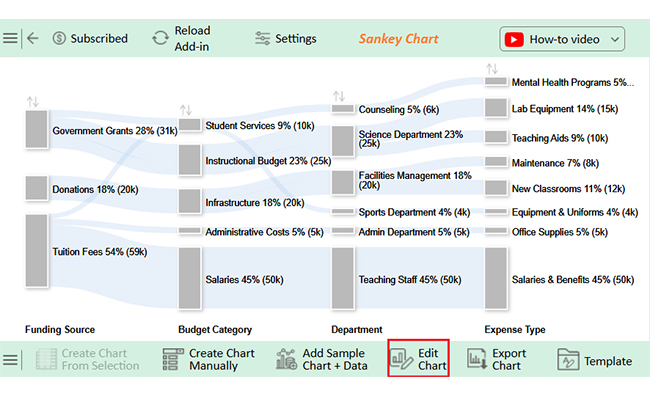
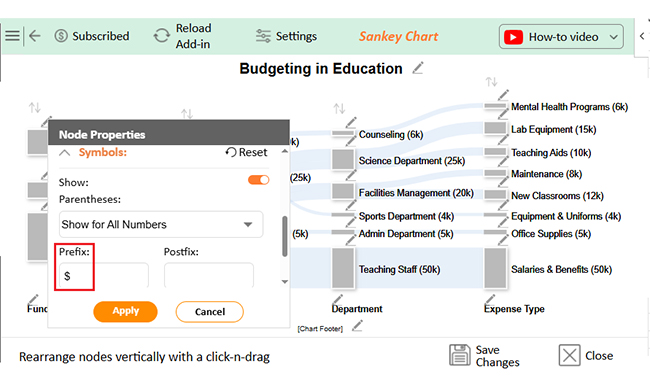
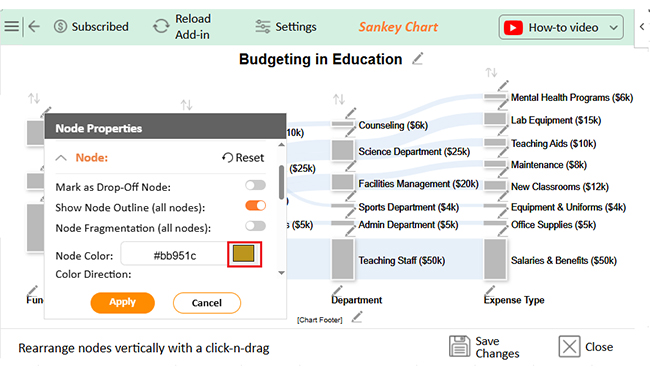
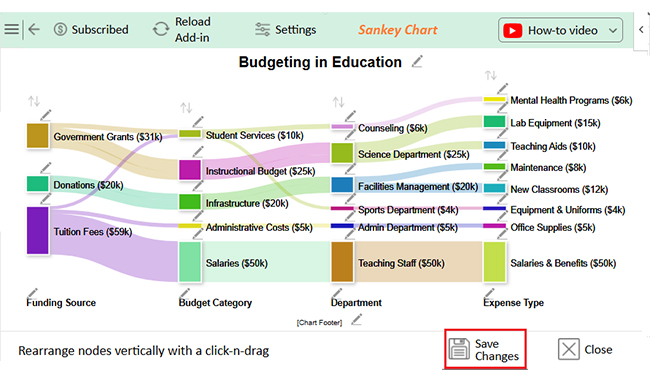
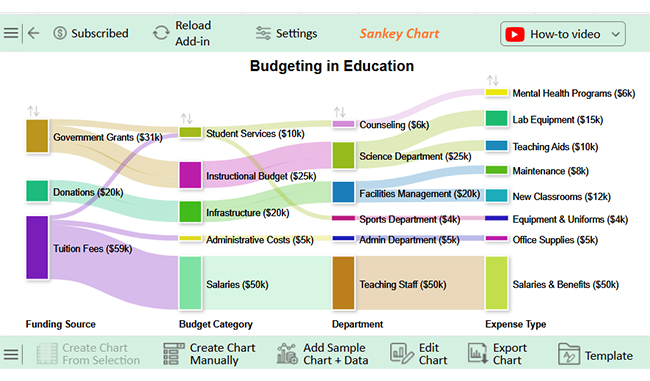
That’s where ChartExpo comes in. This tool takes data analysis to the next level, offering powerful data visualization that Excel can’t match. It’s the perfect solution for transforming educational budgets into clear, actionable insights.

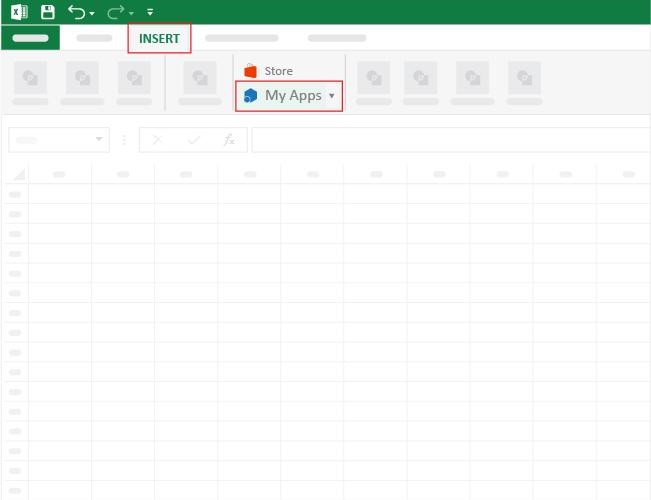
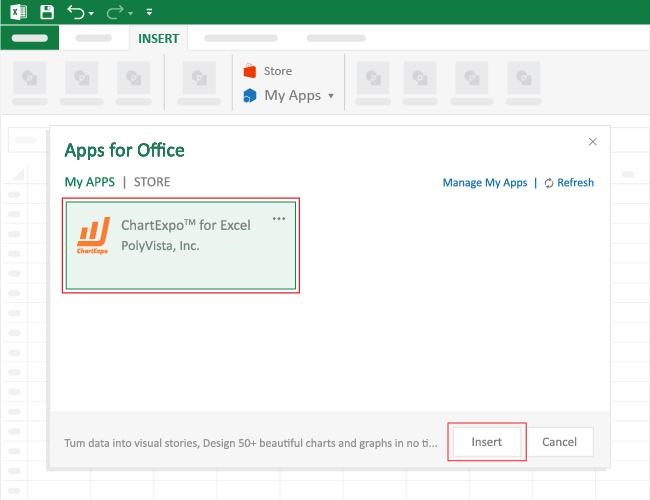
How to Install ChartExpo in Excel?

  1. Open your Excel application.
  2. Open the worksheet and click the “Insert” menu.
  3. You’ll see the “My Apps” option.
  4. In the Office Add-ins window, click “Store” and search for ChartExpo on the My Apps Store.
  5. Click the “Add” button to install ChartExpo in your Excel.

ChartExpo charts are available both in Google Sheets and Microsoft Excel. Please use the following CTAs to install the tool of your choice and create beautiful visualizations with a few clicks in your favorite tool.

Example

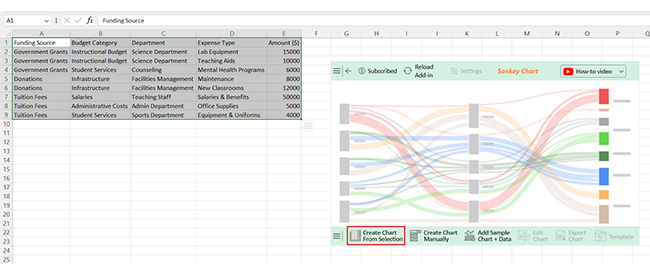
Let’s use the sample data below to learn how to create a monthly budget in Excel.

Funding Source Budget Category Department Expense Type Amount ($)
Government Grants Instructional Budget Science Department Lab Equipment 15000
Government Grants Instructional Budget Science Department Teaching Aids 10000
Government Grants Student Services Counseling Mental Health Programs 6000
Donations Infrastructure Facilities Management Maintenance 8000
Donations Infrastructure Facilities Management New Classrooms 12000
Tuition Fees Salaries Teaching Staff Salaries & Benefits 50000
Tuition Fees Administrative Costs Admin Department Office Supplies 5000
Tuition Fees Student Services Sports Department Equipment & Uniforms 4000
  • To get started with ChartExpo, install ChartExpo in Excel.
  • Now, click on My Apps from the INSERT menu.
Budgeting in Education
  • Choose ChartExpo from My Apps, then click Insert.
Budgeting in Education
  • Once it loads, scroll through the charts list to locate and choose the “Sankey Chart”.
Budgeting in Education
  • Click the “Create Chart From Selection” button after selecting the data from the sheet, as shown.
Budgeting in Education
  • ChartExpo will generate the visualization below for you.
Budgeting in Education
  • If you want to add anything to the chart, click the Edit Chart button:
  • Click the pencil icon next to the Chart Header to change the title.
  • It will open the properties dialog. Under the Text section, you can add a heading in Line 1 and enable Show.
  • Give the appropriate title of your chart and click the Apply button.
Budgeting in Education
  • Click the pencil icon at the top of the nodes to disable the percentage with the numeric values in the chart.
Budgeting in Education
  • Click the pencil icon at the top of the nodes to add the prefix (e.g., $ sign) to the numeric values in the chart.
Budgeting in Education
  • Let’s give colors to the nodes. Click the pencil icon at the top of the nodes and go to “Node.” Select the color and click the “Apply” button to save all changes.
Budgeting in Education
  • Click the “Save Changes” button to persist the changes.
Budgeting in Education
  • Your final chart will appear below.
Budgeting in Education

Insights

  • Tuition Fees: Primarily fund salaries and student services.
  • Government Grants: Support instructional and counseling programs.
  • Donations: Focus on infrastructure, particularly classroom development, and maintenance for institutional improvement.

Tools and Techniques for Budgeting in Education

Budgeting in education is about using the right tools and techniques to spend every dollar. These tools help manage funds more effectively, whether for a small classroom or a large district:

  • Spreadsheet software (e.g., Excel, Google Sheets, ChartExpo): Spreadsheet software is among the most used budgeting tools in education. These tools help with tracking, organizing, and analyzing financial data efficiently.
  • Zero-based budgeting (ZBB): Each department receives a zero budget every year. All expenses must be justified so that only essential costs are included.
  • Incremental budgeting: Incremental budgeting is more straightforward. It takes the previous year’s budget and adjusts it based on expected changes.
  • Performance-based budgeting: Performance-based budgeting ties funding to educational program performance. The better a program performs, the more funds it may receive. This makes it a great way to ensure resources are used efficiently.
  • Budgeting software (e.g., QuickBooks, Budget Maestro): Budgeting software like QuickBooks or Budget Maestro streamlines the budgeting process. These tools automate calculations, generate reports, and track spending in real-time, making it easier to stay on top of finances.

Common Challenges in Educational Budgeting

Balancing the educational budget can be tough. It involves carefully weighing different priorities and making difficult choices. Here are some of the typical pain points encountered during the budgeting process.

  • Limited funding: Funding availability can also limit resource allocation. Many schools have to track expenses and make sense of their limited budgets without much money.
  • Unpredictable costs: Unforeseen expenses, such as emergency repairs or sudden changes in staffing, can disrupt a budget. Data analysis better equips schools to adapt by tracking trends in both spending and revenue.
  • Balancing needs vs. resources available: Schools require more than the available funds. Budgeting means deciding what programs to fund, including student support or classroom supplies.
  • Inflation and rising costs: With increasing costs of materials, energy, and salaries, school budgets are feeling a crunch. Data visualization tools can help schools keep track of these rising costs, allowing them to adjust how they spend their money.
  • Changing enrollment numbers: Enrollment numbers can fluctuate, affecting funding. A finance dashboard in Excel helps schools manage these changes by adjusting budgets based on current student enrollment.
  • Stakeholder expectations: Teachers, parents, and administrators tend to have conflicting ideas about allocating funds. Keeping expectations in check with the budget requires regular revisions to satisfy your stakeholders.

Financial Educational Budgeting Best Practices

Developing an appropriate education budget is more than just balancing the numbers. It is about ensuring financial resources align with the institution’s goals, creating the best possible environment for students and staff. Below are the best practices for financial education budgeting you can follow:

  • Align budget with institutional aspirations: A budget should embody the school’s mission and long-range vision. Each allocation should advance the institution closer to its goals through improved academic programs.
  • Make data-driven decisions: It is critical to make financial decisions based on data. Data visualization tools help leaders spot trends and make smarter funding decisions.
  • Incorporate flexibility: Budgets should be flexible enough to accommodate unforeseen changes. Schools can use tools like an Excel finance dashboard to adjust if costs rise or priorities shift.
  • Engage stakeholders: Including teachers, parents, and administrators in the budgeting process ensures that all perspectives are considered. This helps balance needs and resources, providing a budget that benefits everyone.
  • Regular monitoring and evaluation: A budget is only adequate if it’s actively monitored. Regular assessment through data analysis helps schools track progress and adjust spending when needed.
  • Transparency: Transparency is crucial for trust. Providing clear and open financial reports helps all stakeholders understand how resources are used.

FAQs

Why is budgeting important in school?

Budgeting helps schools allocate resources efficiently. It ensures teachers have what they need. It supports student programs and improves the learning environment. Proper budgeting leads to better planning and financial stability for the school.

How do budgeting and funding influence teacher and student progress?

Proper budgeting provides teachers with resources to improve lessons. It ensures students have access to programs and tools for success. Adequate funding enhances the learning environment, leading to better student outcomes and teacher effectiveness.

Why is budgeting important for students?

Budgeting ensures that schools can invest in resources that benefit students. It provides access to quality teaching materials, extracurricular activities, and student support services. Proper budgeting creates a better environment for students to learn and grow.

Wrap Up

Budgeting in education plays a key role in managing resources effectively. Schools must allocate funds where they are most needed, such as for teaching materials, student support services, and infrastructure. A well-planned budget ensures every dollar is spent wisely.

Schools can easily track and control their finances with the help of monthly budget examples. This makes it easier to see where money is going and adjust when necessary. Data analysis allows educational leaders to make data-driven decisions and improve budgeting accuracy.

Budget deficit by year graphs are also valuable in monitoring finances. They provide clear visuals of deficits over time, allowing schools to adjust budgets early before issues become bigger. Proper monitoring will enable schools to stay on track and avoid unexpected financial shortfalls.

Ultimately, budgeting in education is about ensuring that schools have the resources they need to succeed. A clear budget helps prioritize goals, supports long-term planning, and improves the learning experience for both students and teachers. A well-managed budget contributes to the overall success of the institution and the achievement of its educational goals.

How much did you enjoy this article?

PBIAd1
Start Free Trial!
151768

Related articles

next previous
Data Analytics11 min read

Income and Expenditure Tracker Made Easy with ChartExpo

An Income and Expenditure Tracker helps you record income and spending. Learn how to use it, build Excel graphs, and manage money better and more.

Data Analytics10 min read

SEO Analytics Report: Analyze, Visualize, Improve

An SEO analytics report tracks traffic, rankings, and conversions to measure success. This blog helps you create, improve, and visualize SEO reports easily.

Data Analytics10 min read

Business Management KPIs for Driving Clearer Insights

Business management KPIs track key performance areas to drive success. Click here to learn how to analyze, use, and measure them effectively and more.

Data Analytics11 min read

Business Development Plan Template: A Complete Guide

A business development plan template helps to structure your growth strategy. This blog will guide you on how to write, visualize, and download your template.

Data Analytics22 min read

80-20 Rule: The Math Is Simple. The Impact Isn’t.

80-20 rule missteps can cost growth and alignment. Are you focusing on the right 20% or missing what matters? Learn more and rethink your strategy today!

ChartExpo logo

Turn Data into Visual
Stories

CHARTEXPO

  • Home
  • Gallery
  • Videos
  • Services
  • Pricing
  • Contact us
  • FAQs
  • Privacy policy
  • Terms of Service
  • Sitemap

TOOLS

  • ChartExpo for Google Sheets
  • ChartExpo for Microsoft Excel
  • Power BI Custom Visuals by ChartExpo
  • Word Cloud

CATEGORIES

  • Bar Charts
  • Circle Graphs
  • Column Charts
  • Combo Charts
  • Comparison Charts
  • Line Graphs
  • PPC Charts
  • Sentiment Analysis Charts
  • Survey Charts

TOP CHARTS

  • Sankey Diagram
  • Likert Scale Chart
  • Comparison Bar Chart
  • Pareto Chart
  • Funnel Chart
  • Gauge Chart
  • Radar Chart
  • Radial Bar Chart
  • Sunburst Chart
  • see more
  • Scatter Plot Chart
  • CSAT Survey Bar Chart
  • CSAT Survey Chart
  • Dot Plot Chart
  • Double Bar Graph
  • Matrix Chart
  • Multi Axis Line Chart
  • Overlapping Bar Chart
  • Control Chart
  • Slope Chart
  • Clustered Bar Chart
  • Clustered Column Chart
  • Box and Whisker Plot
  • Tornado Chart
  • Waterfall Chart
  • Word Cloud
  • see less

RESOURCES

  • Blog
  • Resources
  • YouTube
SIGN UP FOR UPDATES

We wouldn't dream of spamming you or selling your info.

© 2025 ChartExpo, all rights reserved.