• Home
  • Tools dropdown img
    • Spreadsheet Charts

      • ChartExpo for Google Sheets
      • ChartExpo for Microsoft Excel
    • Power BI Charts

      • Power BI Custom Visuals by ChartExpo
    • Word Cloud

  • Charts dropdown img
    • Chart Category

      • Bar Charts
      • Circle Graphs
      • Column Charts
      • Combo Charts
      • Comparison Charts
      • Line Graphs
      • PPC Charts
      • Sentiment Analysis Charts
      • Survey Charts
    • Chart Type

      • Box and Whisker Plot
      • Clustered Bar Chart
      • Clustered Column Chart
      • Comparison Bar Chart
      • Control Chart
      • CSAT Survey Bar Chart
      • CSAT Survey Chart
      • Dot Plot Chart
      • Double Bar Graph
      • Funnel Chart
      • Gauge Chart
      • Likert Scale Chart
      • Matrix Chart
      • Multi Axis Line Chart
      • Overlapping Bar Chart
      • Pareto Chart
      • Radar Chart
      • Radial Bar Chart
      • Sankey Diagram
      • Scatter Plot Chart
      • Slope Chart
      • Sunburst Chart
      • Tornado Chart
      • Waterfall Chart
      • Word Cloud
    • Google Sheets
      Microsoft Excel
  • Services
  • Pricing
  • Contact us
  • Blog
  • Support dropdown img
      • Gallery
      • Videos
      • Contact us
      • FAQs
      • Resources
    • Please feel free to contact us

      atsupport@chartexpo.com

Categories
All Data Visualizations Data Analytics Surveys
Add-ons/
  • Google Sheets
  • Microsoft Excel
  • Power BI
All Data Visualizations Data Analytics Surveys
Add-ons
  • Google Sheets
  • Microsoft Excel
  • Power BI

We use cookies

This website uses cookies to provide better user experience and user's session management.
By continuing visiting this website you consent the use of these cookies.

Ok

ChartExpo Survey


Home > Blog > Data Analytics

Financial Forecasting for Startups: A Complete Guide

Financial forecasting for startups helps predict expenses, revenue, and cash flow. It enables better budgeting, business growth strategies, and investment decisions. This guide explores the nitty-gritty of financial forecasting for startups.

Financial Forecasting for Startups

You’ll discover how to analyze financial statements, and how the 3-Statement financial modeling works. There is a financial performance analysis example to help you come up with a monthly finance report for your business. You’ll also discover some long-term financial goals examples, and how to prepare financial statements.

Furthermore, the guide discusses what financial forecasting is for startups, startup financial projections examples, and elements of a financial projection for a startup. Aside from all these, you’ll discover how to create financial projections for startups, how to show startup financial forecasting in Power BI, and how to use financial projections for startup businesses.

Table of Contents:

  1. What is Financial Forecasting for Startups?
  2. How to Create Financial Projections for Startups?
  3. How to Show Startup Financial Forecasting in Power BI?
  4. How to Use Financial Projection for Startup Business?
  5. Tips for Creating Financial Projections for a Startup
  6. FAQs
  7. Wrap Up

What is Financial Forecasting for Startups?

Financial forecasting for startups involves the prediction of future revenue, cash flow, and expenses based on market trends, historical data, and business assumptions.

It helps entrepreneurs make informed decisions about fundraising, growth strategies, and budgeting. Elements of a financial projection for a startup include:

  • Revenue Projections: It estimates future sales based on market demand, pricing, and customer acquisition strategies.
  • Expense Forecasting: Calculating salaries, operational costs, marketing expenses, and other financial outflows.
  • Cash Flow Predictions: It ensures the startup has enough liquidity to sustain operations and scale effectively.
  • Profit and Loss Statement: Outlines expected costs, income, and net profit.
  • Break-Even Analysis: It determines when the startup will become profitable.

How to Create Financial Projections for Startups?

  • Define Key Assumptions

Your projections should be based on industry benchmarks, market research, and historical data. Identify growth rates, expected customer acquisition, and pricing strategy.

  • Forecast Revenue

You have to estimate monthly (or yearly) sales based on pricing, market size, and customer demand. Break revenue down by services, products, or sales channels.

  • Calculate the Cost of Goods Sold (COGS)

You should figure out direct costs like production, distribution, and materials. This will help you understand pricing strategy and profit margins.

  • Estimate Operating Expenses (OPEX)

You should include fixed (salaries, rent, utilities) and variable (software, marketing) costs. This will help you manage cash burn and profitability.

  • Create a Cash Flow Statement

Project cash inflows (investments, sales) and outflows (debt payments, taxes, expenses). This ascertains that the startup maintains positive cash flow.

How to Use Financial Projection for Startup Business? DO NOT

How to Show Startup Financial Forecasting in Power BI?

This section shows you the work that goes into analyzing company financials. You’ll also be introduced to some reports on financial analysis.

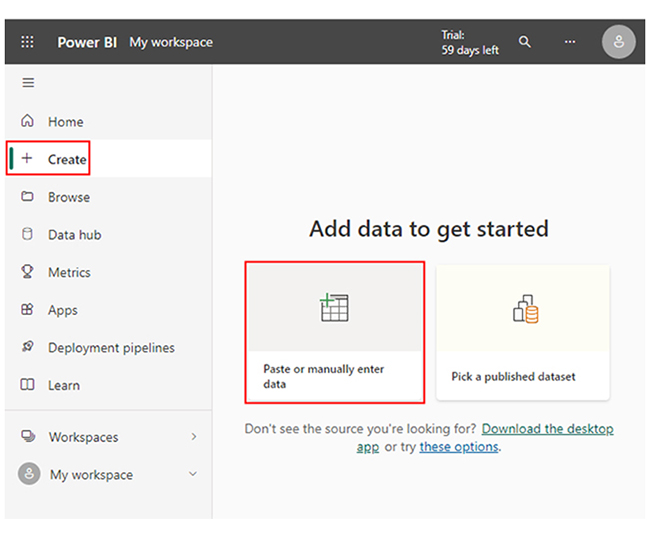
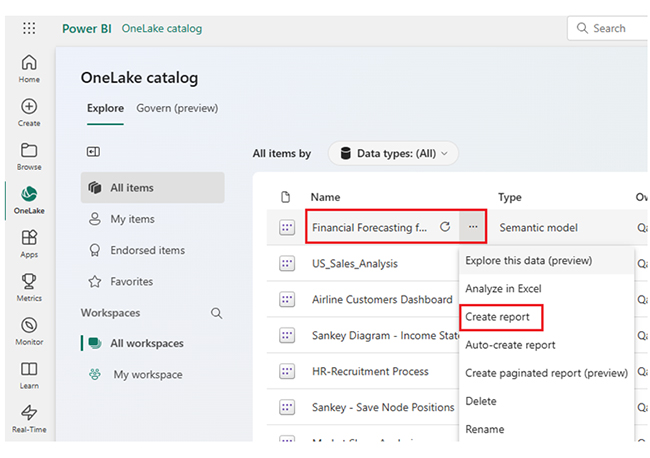
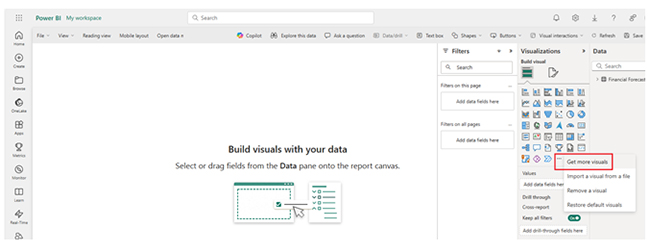
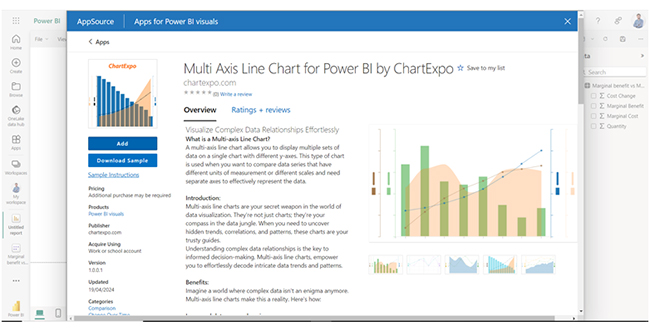
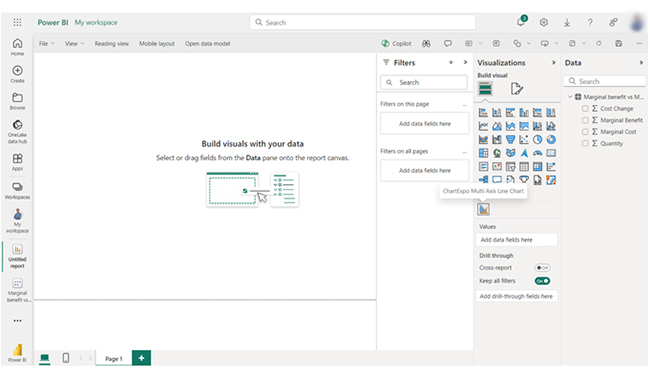
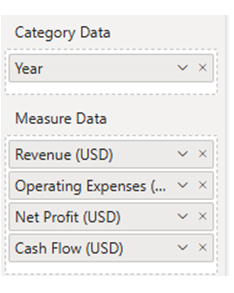
Here are the stages to startup financial forecasting in Power BI.

  • Stage 1: Log into Power BI, enter your email, and click the “Submit” button.
Financial Forecasting for Startups
  • Enter your password, and click “Sign in.”
Financial Forecasting for Startups
  • You can opt to stay signed in.
Financial Forecasting for Startups
  • Stage 2: Create a Data Set and Select the Data Set to Use in the Sankey Chart
  • Navigate to the left-side menu, and click on the “Create” option. After that, select “Paste or manually enter data.”
Financial Forecasting for Startups
  • The following data will be used for this illustration.
Financial Forecasting for Startups
  • Paste the data table above into the “Power Query” window. At this point, select the “Create a semantic model only” option.
Financial Forecasting for Startups
  • Navigate to the left-side menu, and click on the “OneLake” option. Power BI will populate the data set list. If no data set has been created, you’ll get an error message.
  • Click on “Create report.”
Financial Forecasting for Startups
  • After clicking on “Expand All,” you’ll see the chart metrics. Check the dimensions and metrics. Click on “Get more visuals.” At this point, search ChartExpo and select Comparison Bar Chart.
Financial Forecasting for Startups
  • Click on “Add.”
Financial Forecasting for Startups
  • After that, you’ll see the Multi-Axis Line Chart in the visuals list.
Financial Forecasting for Startups
  • Enter your email in visual properties under the “Trial Mode” section.
Financial Forecasting for Startups
  • You’ll receive the ChartExpo key in your email. Copy the key from the email, and paste it into the ChartExpo License Key text box under the “License Settings” section.
Financial Forecasting for Startups
  • Here’s the sequence of fields from the data table or model used in the chart.
Financial Forecasting for Startups
  • You can add the Header text on top of the chart.
Financial Forecasting for Startups
  • Add the dollar sign with all values on the y-axis. You can do the same for all x-axis.
Financial Forecasting for Startups
  • Set the property “Dynamic Range” from the common Y-axis properties section. Dynamically, y-axis ticks will be generated.
Financial Forecasting for Startups
  • Arrange the y-axis orientation.
Financial Forecasting for Startups
  • There’s the option to sort the chart for different metrics and dimensions.
Financial Forecasting for Startups
  • You can change the data representation (like in bar, line, and area). In this illustration, the revenue is shown as bars, the operating expenses as fill area, while the net profit and cash flow are with line and circle.
Financial Forecasting for Startups
  • You can change the shape of the legend. That will be according to the chart’s look and feel. In this illustration, changes are for all metrics shown in the legend.
Financial Forecasting for Startups
  • Here’s the final chart.
Financial Forecasting for Startups

Insights

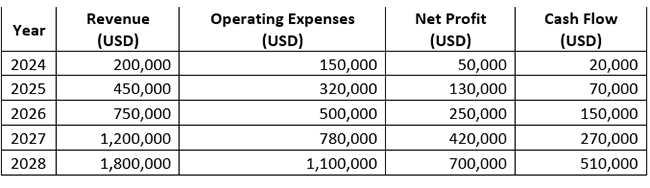
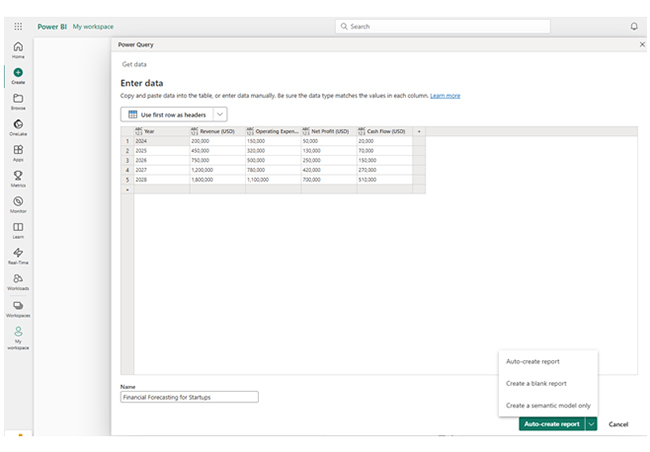
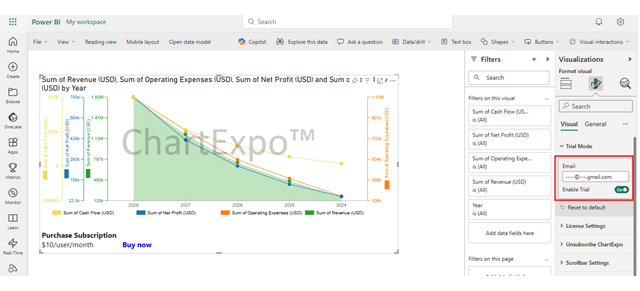
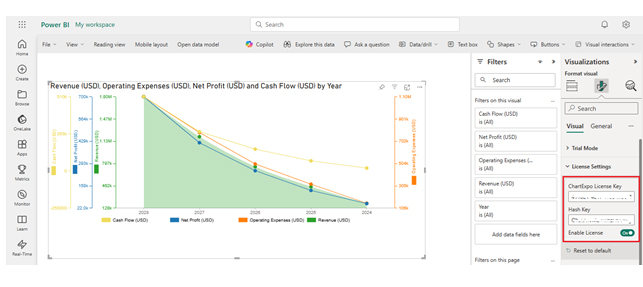
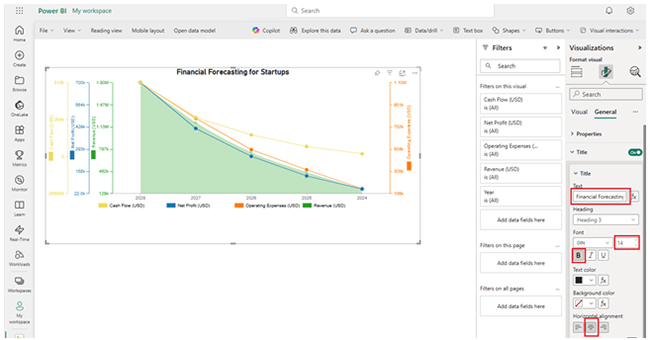
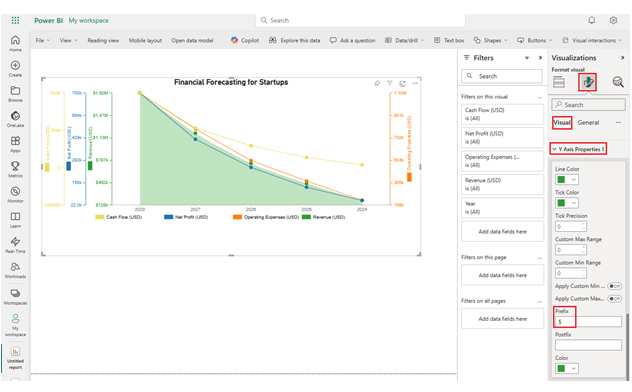
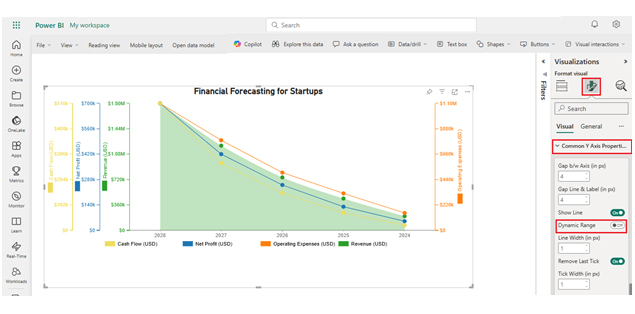
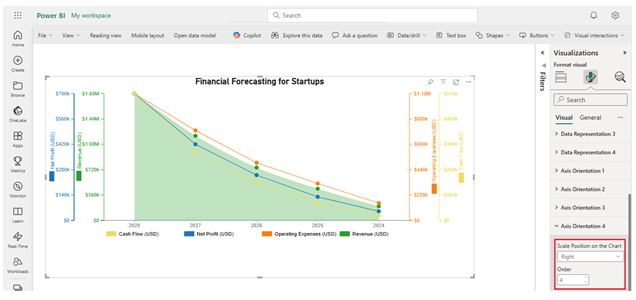
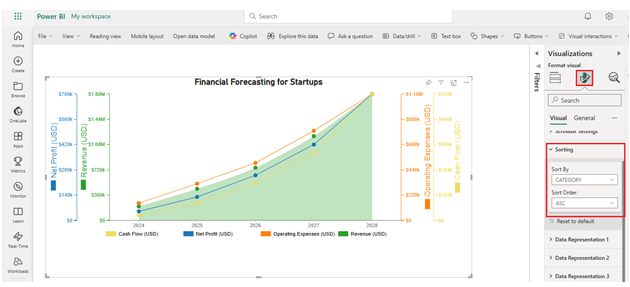
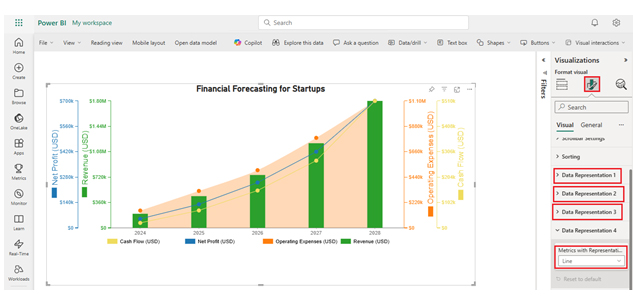
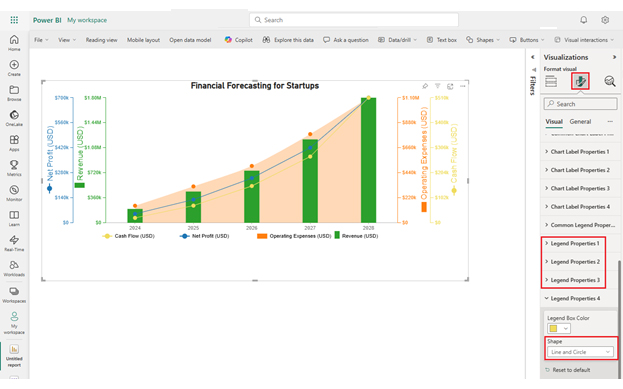
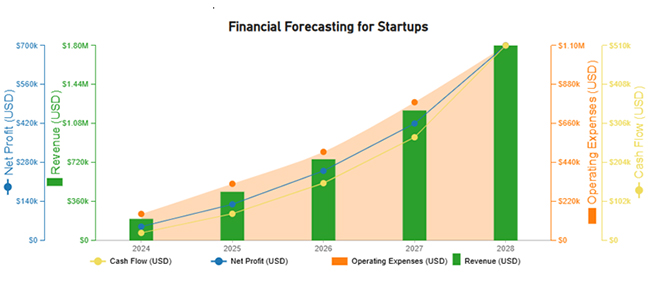
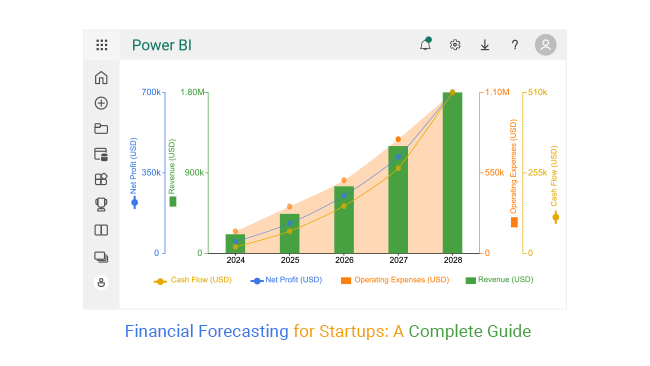
The financial chart shows insights into the company’s performance from 2024 to 2028:

  • Strong Revenue Growth: There’s a revenue increase each year, from $200K in 2024 to $1.8M in 2028. That shows a rapidly growing business, and it could be due to increased market demand, better product offerings, or expansion.
  • Rising Operating Expenses: Operating expenses increase with revenue. It grew from $150K in 2024 to $1.1M in 2028. It’s observed that expenses are increasing at a controlled rate relative to revenue.
  • Increasing Profitability: Net profit is growing steadily from $50K in 2024 to $700K in 2028. It shows that the business is effectively managing costs while scaling up.

How to Use Financial Projection for Startup Business?

  • Attract Investors and Secure Funding

Investors always evaluate revenue forecasts, profitability, expenses, and return on investment (ROI) before funding a startup. Always use projections to demonstrate financial stability, scalability, and risk management.

  • Manage Cash Flow Efficiently

To maintain a positive cash balance, you have to predict cash inflows and outflows. Also plan for slow periods, and ensure sufficient funds for operations.

  • Budget and Expense Control

Create a realistic budget by aligning revenue forecasts with expenses. You should track actual vs. projected expenses to adjust spending and prevent overspending.

  • Risk Mitigation and Decision-Making

Use projections to figure out financial risks and develop contingency plans. You should also conduct a scenario analysis to prepare for market challenges and fluctuations.

Tips for Creating Financial Projections for a Startup

  • Use Realistic Assumptions

Your projections should be based on historical data, market research, and industry benchmarks. Always avoid overestimating revenue, and consider the competition, seasonality, and customer behavior.

  • Focus on Cash Flow Management

To ensure positive cash flow, track inflows (investments, sales) and outflows (loan payments, expenses). You should also put unexpected costs and delayed payments into consideration.

  • Keep it Simple and Transparent.

Use clear, logical financial models that are easy for investors and other stakeholders to understand. Furthermore, provide detailed justifications for projections.

  • Regularly Update Projections

Adjust projections based on actual performance, business changes, and economic conditions. Endeavor to reevaluate assumptions quarterly (or annually).

  • Conduct a Break-Even Analysis

You have to figure out the sales volume needed to cover costs and become profitable.

Which chart type is best suited for displaying annual financial data for a 10-year period? Well, all these are discussed in the next section.

FAQs

How to create a 5-year financial forecast?

First, you have to estimate revenue, expenses, cash flow, and profitability. That could be done using historical data, growth assumptions, and market trends. Always update projections for accuracy and strategic decision-making.

How to do a financial forecast for a startup?

You have to estimate revenue, cash flow, expenses, and profitability. To do that, you’ll have to use assumptions and market research. Always update projections to guide investment decisions, budgeting, and growth strategies.

How do you lay out a financial forecast?

To lay out a financial forecast, you have to structure revenue projections, cash flow statements, expenses, profit & loss statements, break-even analysis, and balance sheets. All these ensure clarity, accuracy, and regular updates for informed decision-making.

Wrap Up

Financial forecasting helps startups predict future expenses, revenue, and cash flow. This way, they will be able to make informed decisions. It aids in securing investments, budgeting, growth planning, and risk management.

To create financial projections for a startup, you have to use realistic assumptions, and forecast revenue and expenses separately. Your projections should be based on historical data, market research, and industry benchmarks.

You should break down revenue by products, services, or sales channels. Always include fixed costs (salaries, rent) and variable costs (production, marketing).

Furthermore, projections should be adjusted based on economic conditions, actual performance, and business changes. You need to reevaluate assumptions quarterly (or annually).

Now you know how financial forecasting for startups works, what metrics will you consider when representing your financial data in Power BI?

How much did you enjoy this article?

ExcelAd1
Start Free Trial!
150636

Related articles

next previous
Data Analytics9 min read

Marketing Spend Template for Smarter Insights

Learn everything about the marketing spend template. You'll also learn how to create a marketing budget plan and tips for using one, and many more.

Data Analytics12 min read

Business Intelligence in Healthcare Industry: A Visual Approach

Business Intelligence in the healthcare industry improves patient care and streamlines operations. Learn how BI works and benefits healthcare providers.

Data Analytics10 min read

Analytics in Telecom Industry for Better Insights

Analytics in the telecom industry optimizes networks, enhances customer experience, and detect fraud. Learn its key benefits, challenges, and use cases.

Data Analytics32 min read

Data Reporting: Making Your Reports Irresistible

Data reporting turns numbers into insights that guide decisions. Learn how to simplify complex data and make confident choices. Read on for key strategies!

Data Analytics10 min read

Employee Performance KPIs: Insights That Drive Action

Employee performance KPIs track productivity and success. Learn the key metrics, measurement methods, and analysis techniques to boost performance.

ChartExpo logo

Turn Data into Visual
Stories

CHARTEXPO

  • Home
  • Gallery
  • Videos
  • Services
  • Pricing
  • Contact us
  • FAQs
  • Privacy policy
  • Terms of Service
  • Sitemap

TOOLS

  • ChartExpo for Google Sheets
  • ChartExpo for Microsoft Excel
  • Power BI Custom Visuals by ChartExpo
  • Word Cloud

CATEGORIES

  • Bar Charts
  • Circle Graphs
  • Column Charts
  • Combo Charts
  • Comparison Charts
  • Line Graphs
  • PPC Charts
  • Sentiment Analysis Charts
  • Survey Charts

TOP CHARTS

  • Sankey Diagram
  • Likert Scale Chart
  • Comparison Bar Chart
  • Pareto Chart
  • Funnel Chart
  • Gauge Chart
  • Radar Chart
  • Radial Bar Chart
  • Sunburst Chart
  • see more
  • Scatter Plot Chart
  • CSAT Survey Bar Chart
  • CSAT Survey Chart
  • Dot Plot Chart
  • Double Bar Graph
  • Matrix Chart
  • Multi Axis Line Chart
  • Overlapping Bar Chart
  • Control Chart
  • Slope Chart
  • Clustered Bar Chart
  • Clustered Column Chart
  • Box and Whisker Plot
  • Tornado Chart
  • Waterfall Chart
  • Word Cloud
  • see less

RESOURCES

  • Blog
  • Resources
  • YouTube
SIGN UP FOR UPDATES

We wouldn't dream of spamming you or selling your info.

© 2025 ChartExpo, all rights reserved.