• Home
  • Tools dropdown img
    • Spreadsheet Charts

      • ChartExpo for Google Sheets
      • ChartExpo for Microsoft Excel
    • Power BI Charts

      • Power BI Custom Visuals by ChartExpo
    • Word Cloud

  • Charts dropdown img
    • Chart Category

      • Bar Charts
      • Circle Graphs
      • Column Charts
      • Combo Charts
      • Comparison Charts
      • Line Graphs
      • PPC Charts
      • Sentiment Analysis Charts
      • Survey Charts
    • Chart Type

      • Box and Whisker Plot
      • Clustered Bar Chart
      • Clustered Column Chart
      • Comparison Bar Chart
      • Control Chart
      • CSAT Survey Bar Chart
      • CSAT Survey Chart
      • Dot Plot Chart
      • Double Bar Graph
      • Funnel Chart
      • Gauge Chart
      • Likert Scale Chart
      • Matrix Chart
      • Multi Axis Line Chart
      • Overlapping Bar Chart
      • Pareto Chart
      • Radar Chart
      • Radial Bar Chart
      • Sankey Diagram
      • Scatter Plot Chart
      • Slope Chart
      • Sunburst Chart
      • Tornado Chart
      • Waterfall Chart
      • Word Cloud
    • Google Sheets
      Microsoft Excel
  • Services
  • Pricing
  • Contact us
  • Blog
  • Support dropdown img
      • Gallery
      • Videos
      • Contact us
      • FAQs
      • Resources
    • Please feel free to contact us

      atsupport@chartexpo.com

Categories
All Data Visualizations Data Analytics Surveys
Add-ons/
  • Google Sheets
  • Microsoft Excel
  • Power BI
All Data Visualizations Data Analytics Surveys
Add-ons
  • Google Sheets
  • Microsoft Excel
  • Power BI

We use cookies

This website uses cookies to provide better user experience and user's session management.
By continuing visiting this website you consent the use of these cookies.

Ok

ChartExpo Survey


Home > Blog > Microsoft Excel

Training Plan Template in Excel for Effective Planning

Managing a team or planning employee development can be challenging to keep organized. But don’t worry; a spreadsheet can turn chaos into clarity.

This is where the training plan template in Excel comes into play.

Companies worldwide rely on Excel for tracking progress, scheduling sessions, and managing resources. An Excel training plan template simplifies planning by structuring tasks, deadlines, and learning objectives in one place. Using an analytical report template alongside it can provide deeper insights into training effectiveness.

Training Plan Template in Excel

Think of growing industries: tech, healthcare, and finance demand continuous learning. Employees need new skills, and businesses must keep up. Without a solid plan, training becomes scattered, leading to missed deadlines, wasted budgets, and poor results. A well-structured template eliminates guesswork, ensuring teams stay on track.

An Excel template brings flexibility. Do you need to adjust schedules, update progress, or track individual performance? A few clicks can make all the difference – try the training plan template. A monthly financial report template in Excel can also help allocate training budgets efficiently.

A training plan template in Excel acts as a roadmap, helping businesses streamline employee growth. Structure makes all the difference in onboarding new hires or upskilling a team. An X and Y axis chart natively and strategically displays progress trends, making performance tracking clearer.

So, why waste hours on manual tracking when a template can handle it all?

Let me guide you…

Table of Contents:

  1. What is a Training Plan Template in Excel?
  2. How to Create a Training Plan in Excel?
  3. How to Analyze the Excel Training Plan Template?
  4. Benefits of Employee Training Plan Template Excel
  5. Best Practices of the Annual Training Plan Excel Template
  6. FAQs
  7. Wrap Up

What is a Training Plan Template in Excel?

Definition: A training plan template in Excel is a structured document for organizing and tracking training activities. It typically includes columns for the training topic, date, duration, instructor, and participant details. The template helps ensure all training sessions are scheduled and managed effectively.

You customize this template to fit specific needs, such as adding goals and resources, tracking progress, and comparing training costs. A price comparison template in Excel can help here by evaluating expenses and optimizing the budget. Tracking expenses alongside training ensures better financial planning.

The template also facilitates planning, monitoring, and evaluating training programs for employees or teams. A well-structured approach improves efficiency and maximizes learning outcomes.

How to Create a Training Plan in Excel?

Creating a training plan in Excel is simple. A solid plan keeps sessions structured and prevents wasted time. A spreadsheet brings order and efficiency while using a Time Series Chart Excel helps track progress and makes improvements clear.

Let me show you how to make use of this tool:

  1. Define training objectives: Start with the end in mind. Clear goals help employees understand what they need to achieve and ensure the training stays focused.
  2. List required training topics: Break the training into key topics. Organizing content in sections makes it easier to follow and track progress.
  3. Create a schedule: Set realistic dates for each session. A structured timeline prevents training overload and keeps everything on track.
  4. Assign trainers or resources: Decide who will lead each session. Whether it’s a manager, an external trainer, or an online course, assigning the right resources keeps training effective.
  5. Set clear metrics for success: Define how success will be measured. It could include quizzes, project completion, or performance improvements.
  6. Track progress: Use Excel to log attendance and completion rates. A simple color-coded system can highlight progress and identify areas needing attention.
  7. Review and adjust: Gather feedback from participants. Making improvements ensures training stays relevant and continues to add value.

How to Analyze the Excel Training Plan Template?

Are you struggling to track employee training in Excel? You’re not alone. A training plan template helps organize progress, but Excel has a major flaw—weak data visualization.

Spreadsheets pile up, and insights get lost in rows and columns. These data visualization examples using Excel show how charts and graphs can make training progress easier to understand. Clear visuals help managers spot trends and make informed decisions.

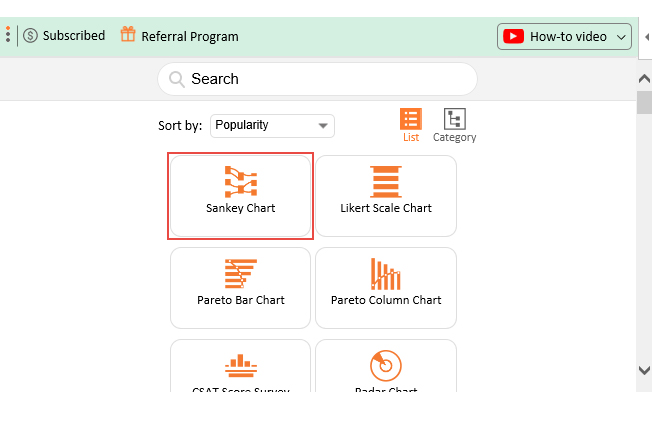
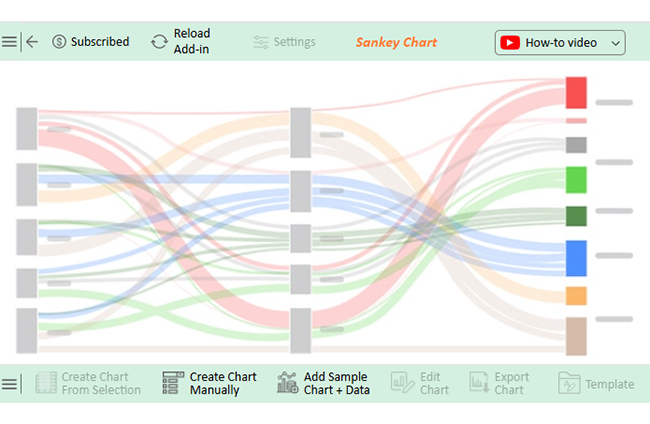
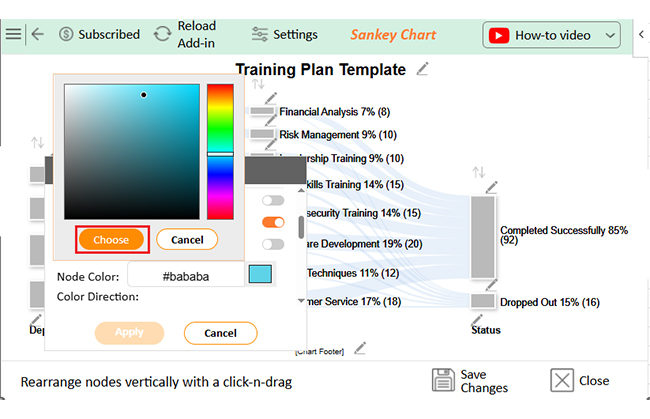
That’s where ChartExpo steps in. This powerful tool transforms dull data into clear, engaging visuals. Say goodbye to Excel’s limits and hello to better decision-making.

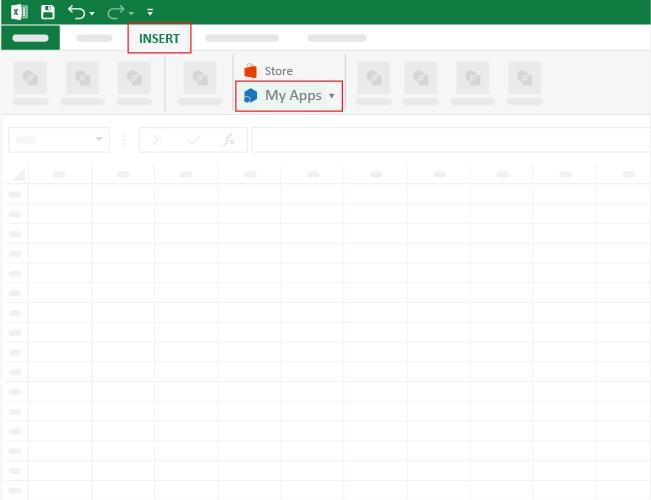
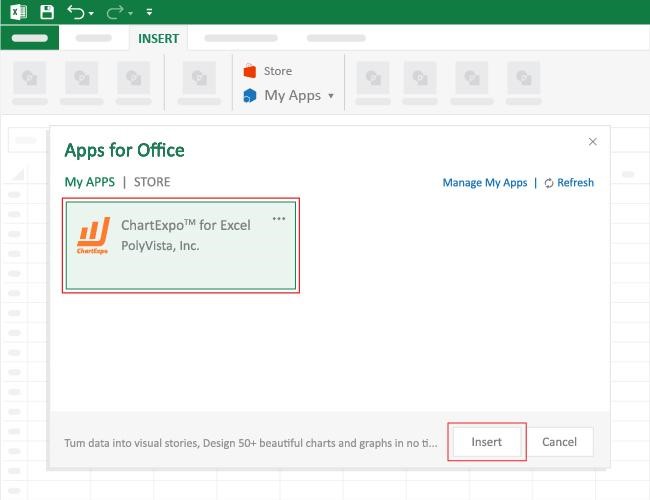
How to Install ChartExpo in Excel?

  1. Open your Excel application.
  2. Open the worksheet and click the “Insert” menu.
  3. You’ll see the “My Apps” option.
  4. In the Office Add-ins window, click “Store” and search for ChartExpo on my Apps Store.
  5. Click the “Add” button to install ChartExpo in your Excel.

ChartExpo charts are available both in Google Sheets and Microsoft Excel. Please use the following CTAs to install the tool of your choice and create beautiful visualizations with a few clicks in your favorite tool.
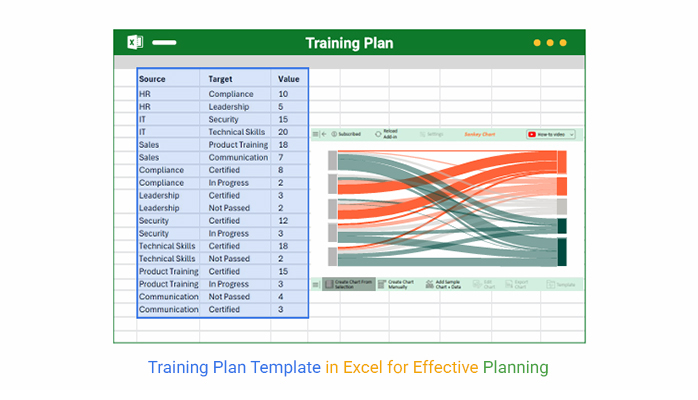
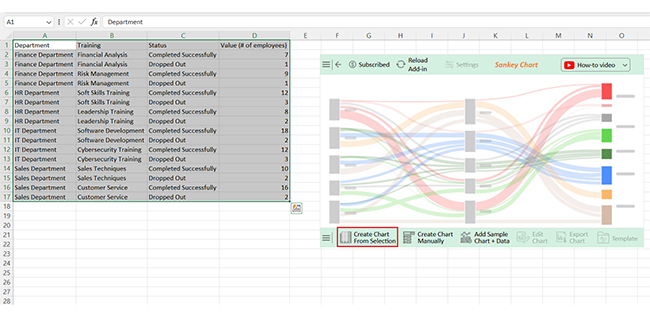
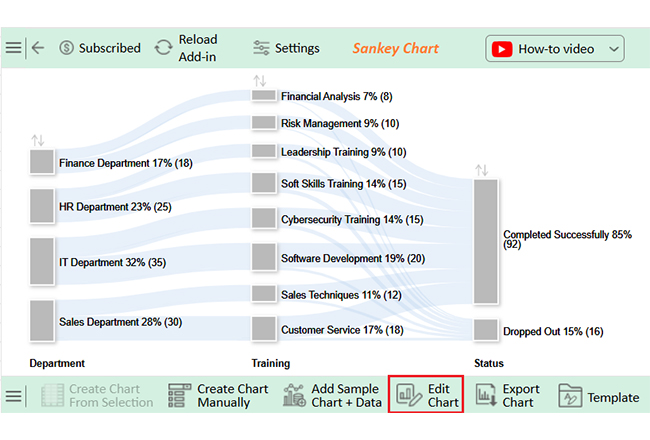
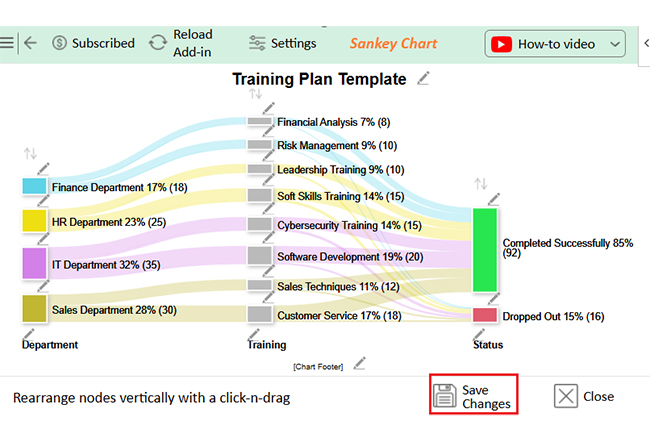
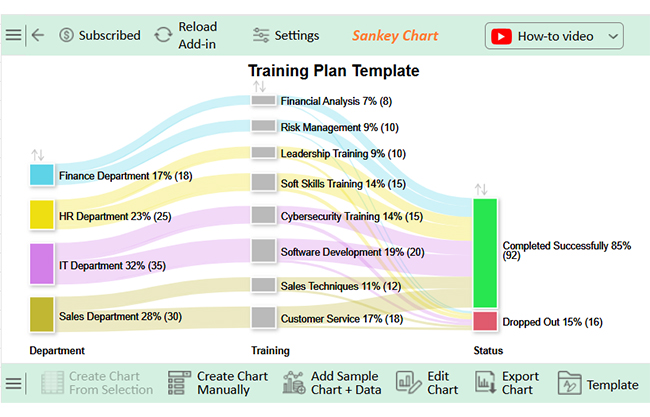
Example

Let’s learn how to analyze Excel training plan template using ChartExpo:

Department Training Status Value (# of employees)
Finance Department Financial Analysis Completed Successfully 7
Finance Department Financial Analysis Dropped Out 1
Finance Department Risk Management Completed Successfully 9
Finance Department Risk Management Dropped Out 1
HR Department Soft Skills Training Completed Successfully 12
HR Department Soft Skills Training Dropped Out 3
HR Department Leadership Training Completed Successfully 8
HR Department Leadership Training Dropped Out 2
IT Department Software Development Completed Successfully 18
IT Department Software Development Dropped Out 2
IT Department Cybersecurity Training Completed Successfully 12
IT Department Cybersecurity Training Dropped Out 3
Sales Department Sales Techniques Completed Successfully 10
Sales Department Sales Techniques Dropped Out 2
Sales Department Customer Service Completed Successfully 16
Sales Department Customer Service Dropped Out 2
  • To get started with ChartExpo, install ChartExpo in Excel.
  • Now Click on My Apps from the INSERT menu.
Training Plan Template in Excel
  • Choose ChartExpo from My Apps, then click Insert.
Training Plan Template in Excel
  • Once it loads, choose the “Sankey Chart” from the charts list.
Training Plan Template in Excel
  • After clicking on the chart, you will see the Sankey Chart on the screen.
Training Plan Template in Excel
  • Click the “Create Chart From Selection” button after selecting the data from the sheet, as shown.
Training Plan Template in Excel
  • ChartExpo will generate the visualization below for you.
Training Plan Template in Excel
  • If you want to have the chart’s title, click Edit Chart, as shown in the above image.
  • Click the pencil icon next to the Chart Header to change the title.
  • It will open the properties dialog. Under the Text section, you can add a heading in Line 1 and enable Show.
  • Give the appropriate title of your chart and click the Apply button.
Training Plan Template in Excel
  • You can add the color in status Nodes as follows:
Training Plan Template in Excel
  • Click the “Save Changes” button to persist the changes.
Training Plan Template in Excel
  • Your final chart will appear as below.
Training Plan Template in Excel

Insights

  • Total training sessions: 92 successful completions
  • Employee dropouts: 16 in total
  • Highest dropout rates: HR (5) and IT (5)
  • Lowest dropouts: Finance (2)

Benefits of Employee Training Plan Template Excel

Using an employee training plan template in Excel streamlines your process. It keeps training organized and efficient. Cross tabulation in Excel helps analyze the data, revealing trends across departments. This makes tracking progress and managing training easier.

Here’s how:

  • Organized training: The template helps structure training programs, ensuring nothing gets overlooked. All the essential details are in one place, making it easy to find what you need.
  • Customization: You can customize the template to align with your organization’s needs or training objectives. This flexibility makes it perfect for any industry or training format.
  • Track progress: A template provides a clear view of employees’ progress. This helps you monitor skill development and identify areas for improvement.
  • Saves time: Pre-built templates save you the hassle of starting from scratch. They also help you plan and organize training faster, letting you focus on content delivery.
  • Cost-effective: Excel is free or already part of most software suites. You can stay organized without investing in costly training management systems.
  • Easy collaboration: You can share this template across teams with a click. It aids in data storytelling, clarifies insights, and ensures alignment.

Best Practices of the Annual Training Plan Excel Template

An annual training plan Excel template keeps training structured. The Correlation Chart in Excel shows links between the training and performance. Here’s how to make a well-organized template and ensure every session has an impact:

  1. Set clear goals: Define what the training should achieve. When objectives are specific, employees and managers know what to focus on.
  2. Organize by category: Group training sessions by skills, departments, or job roles. This keeps the plan structured and ensures no essential topics are missed.
  3. Create a structured schedule: Plan sessions in advance and spread them throughout the year. A balanced schedule prevents overwhelming employees while keeping learning consistent.
  4. Assign trainers and resources: Decide who will lead each session and list the necessary materials. Having this prepared ahead of time avoids confusion and keeps sessions productive.
  5. Track progress and gather feedback: Use Excel to track attendance and completion rates with custom Excel charts. Collect feedback to improve future training and address any gaps.
  6. Review, adjust, and budget wisely: Analyze training results regularly and update plans as needed. Properly allocating funds ensures resources are used efficiently for maximum impact.

FAQs

How do I create a plan in Excel?

  1. Open Excel and create a new sheet.
  2. List tasks, deadlines, and responsible persons.
  3. Use columns for status, priority, and details.
  4. Apply formatting for better clarity.
  5. Add formulas to automate calculations.
  6. Use charts for data visualization.
  7. Save and update regularly.

How do you prepare a training calendar in Excel?

  1. Open Excel and create a new sheet.
  2. List training topics, dates, and trainers.
  3. Add columns for attendees and status.
  4. Use color coding for clarity.
  5. Apply filters for easy tracking.
  6. Insert a calendar template or use conditional formatting.
  7. Save and update regularly.

Wrap Up

A training plan template in Excel keeps the learning structure. It helps teams stay on track with clear goals and schedules. Without a plan, training can feel scattered and ineffective.

Businesses need a simple way to manage employee development. Excel makes tracking progress easy and efficient, and a well-organized template saves time and effort. Using skills matrix templates alongside a training plan helps assess employee competencies and identify skill gaps.

Training impacts productivity and growth. Companies that invest in learning see better performance and retention. A structured plan ensures training delivers accurate results. The best Excel add-ins for data analysis can provide deeper insights into training effectiveness and employee progress.

Flexibility is key. Teams can update schedules, adjust goals, and track improvements in one place. Excel allows for quick changes without disrupting progress. Add-ins for Excel Mac can enhance functionality, making training management even smoother.

Measuring success matters. Tracking attendance, assessments, and feedback ensures training remains effective. Regular updates keep sessions relevant and valuable.

A training plan template in Excel brings order to learning. It simplifies planning, execution, and review. To enhance data visualization, install ChartExpo for clearer insights and better decision-making. Also, learn how to create a monthly budget in Excel to include training expenses in your budget with ease.

With the right approach, training becomes a powerful tool for success.

How much did you enjoy this article?

ExcelAd1
Start Free Trial!
149745

Related articles

next previous
Microsoft Excel9 min read

How to Create a Stacked Waterfall Chart in Excel?

Discover how to build and customize a stacked waterfall chart in Excel. Ideal for showing positive and negative values across categories or time.

Microsoft Excel10 min read

Excel Bookkeeping for Small Business: Insights at a Glance

Excel bookkeeping for small businesses helps track income, expenses, and cash flow. Learn about templates and financial analysis to simplify bookkeeping.

Microsoft Excel10 min read

Compound Interest in Excel for Smarter Reporting

Discover compound interest in Excel and how it works. Learn its formulas, calculation tips, and common errors to avoid for more accurate financial analysis.

Microsoft Excel9 min read

KPI Dashboard in Excel: A Complete Guide

A KPI dashboard in Excel helps track key metrics and streamline data visualization. Discover how to create, analyze, and use it with clear guides and examples.

Microsoft Excel11 min read

How to Plot a Speedometer Chart in Excel?

Create a Speedometer Chart in Excel to track KPIs, goals, and performance metrics visually. Explore templates, examples, and step-by-step instructions for better dashboards.

ChartExpo logo

Turn Data into Visual
Stories

CHARTEXPO

  • Home
  • Gallery
  • Videos
  • Services
  • Pricing
  • Contact us
  • FAQs
  • Privacy policy
  • Terms of Service
  • Sitemap

TOOLS

  • ChartExpo for Google Sheets
  • ChartExpo for Microsoft Excel
  • Power BI Custom Visuals by ChartExpo
  • Word Cloud

CATEGORIES

  • Bar Charts
  • Circle Graphs
  • Column Charts
  • Combo Charts
  • Comparison Charts
  • Line Graphs
  • PPC Charts
  • Sentiment Analysis Charts
  • Survey Charts

TOP CHARTS

  • Sankey Diagram
  • Likert Scale Chart
  • Comparison Bar Chart
  • Pareto Chart
  • Funnel Chart
  • Gauge Chart
  • Radar Chart
  • Radial Bar Chart
  • Sunburst Chart
  • see more
  • Scatter Plot Chart
  • CSAT Survey Bar Chart
  • CSAT Survey Chart
  • Dot Plot Chart
  • Double Bar Graph
  • Matrix Chart
  • Multi Axis Line Chart
  • Overlapping Bar Chart
  • Control Chart
  • Slope Chart
  • Clustered Bar Chart
  • Clustered Column Chart
  • Box and Whisker Plot
  • Tornado Chart
  • Waterfall Chart
  • Word Cloud
  • see less

RESOURCES

  • Blog
  • Resources
  • YouTube
SIGN UP FOR UPDATES

We wouldn't dream of spamming you or selling your info.

© 2025 ChartExpo, all rights reserved.