• Home
  • Tools dropdown img
    • Spreadsheet Charts

      • ChartExpo for Google Sheets
      • ChartExpo for Microsoft Excel
    • Power BI Charts

      • Power BI Custom Visuals by ChartExpo
    • Word Cloud

  • Charts dropdown img
    • Chart Category

      • Bar Charts
      • Circle Graphs
      • Column Charts
      • Combo Charts
      • Comparison Charts
      • Line Graphs
      • PPC Charts
      • Sentiment Analysis Charts
      • Survey Charts
    • Chart Type

      • Box and Whisker Plot
      • Clustered Bar Chart
      • Clustered Column Chart
      • Comparison Bar Chart
      • Control Chart
      • CSAT Survey Bar Chart
      • CSAT Survey Chart
      • Dot Plot Chart
      • Double Bar Graph
      • Funnel Chart
      • Gauge Chart
      • Likert Scale Chart
      • Matrix Chart
      • Multi Axis Line Chart
      • Overlapping Bar Chart
      • Pareto Chart
      • Radar Chart
      • Radial Bar Chart
      • Sankey Diagram
      • Scatter Plot Chart
      • Slope Chart
      • Sunburst Chart
      • Tornado Chart
      • Waterfall Chart
      • Word Cloud
    • Google Sheets
      Microsoft Excel
  • Services
  • Pricing
  • Contact us
  • Blog
  • Support dropdown img
      • Gallery
      • Videos
      • Contact us
      • FAQs
      • Resources
    • Please feel free to contact us

      atsupport@chartexpo.com

Categories
All Data Visualizations Data Analytics Surveys
Add-ons/
  • Google Sheets
  • Microsoft Excel
  • Power BI
All Data Visualizations Data Analytics Surveys
Add-ons
  • Google Sheets
  • Microsoft Excel
  • Power BI

We use cookies

This website uses cookies to provide better user experience and user's session management.
By continuing visiting this website you consent the use of these cookies.

Ok

ChartExpo Survey


Home > Blog > Power BI

Quarterly Business Review Template for Optimum Reports

The Quarterly Business Review (QBR) template shows key achievements, performance insights, and challenges over the past quarter. It provides actionable recommendations to align strategies, drive sustainable growth, and improve operations for upcoming quarters.

Quarterly Business Review (QBR) template

This guide shows you what the QBR template is, what makes a good Quarterly Business Review template, and some Power BI design ideas. You’ll also discover major Power BI best practices, and how data-driven decision-making can help improve your business.

Aside from all these, this guide shows you why QBR templates are important for your business, and how to use the Quarterly Business Review Template.

Table of Contents:

  1. What is a QBR Template?
  2. Why are QBR Templates important for your Business?
  3. What makes a Good Quarterly Business Review Template?
  4. What To Include in Your QBR Template?
  5. How to Analyze Quarterly Business Review Templates in Power BI?
  6. How to Use the Quarterly Business Review Template?
  7. Pros and Cons of Using a QBR Template
  8. Best Practices of Quarterly Business Review Format
  9. FAQs
  10. Wrap Up

What is a QBR Template?

It includes key metrics, customer insights, financial updates, and improvement plans. This helps stakeholders make informed decisions.

Analyzing QBR Template in Microsoft Excel using Comparison Bar Chart

Analyzing QBR Template in Google Sheets using Comparison Bar Chart

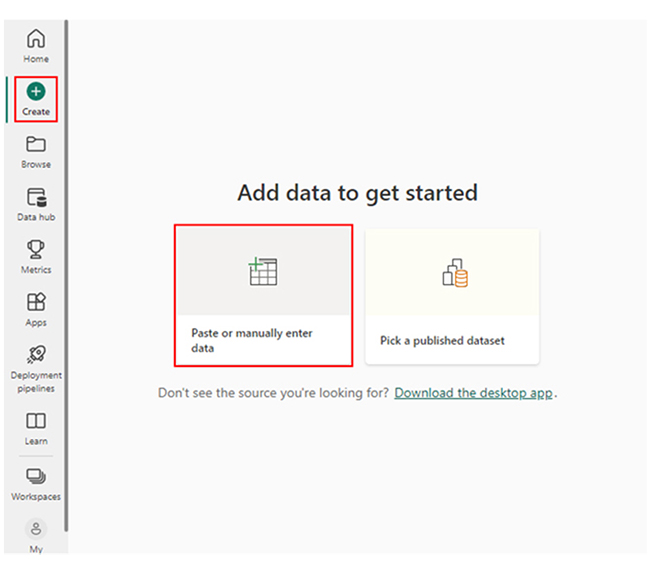
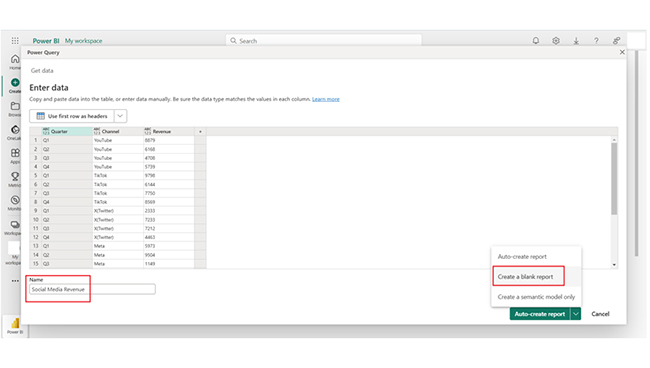
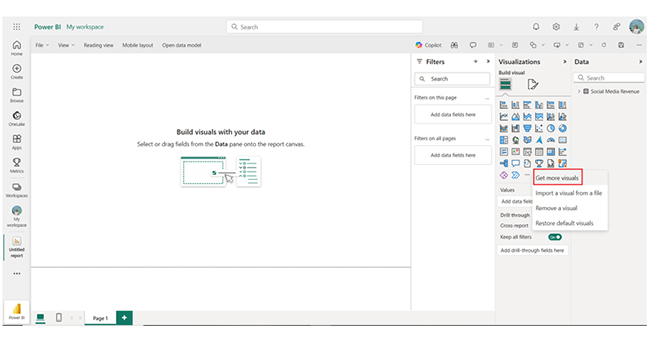
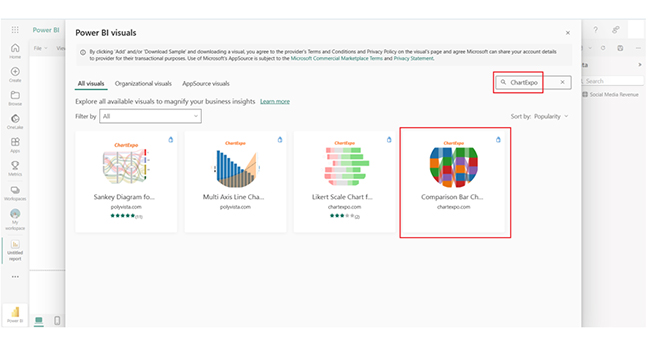
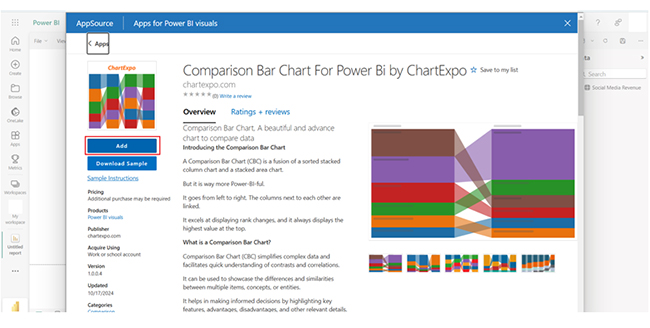
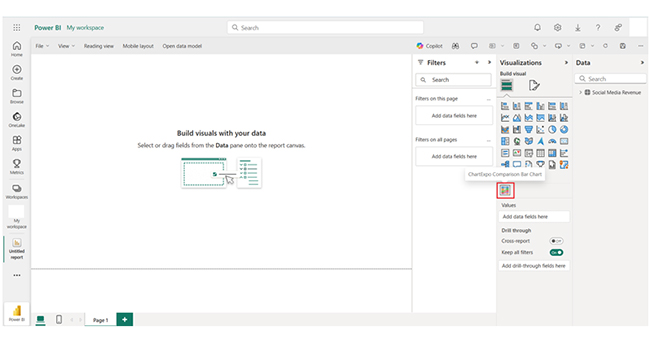
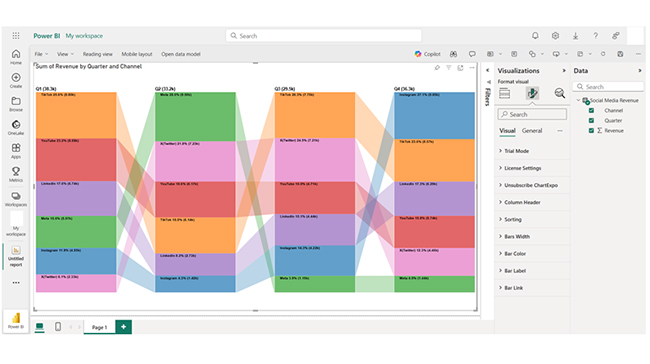
Analyzing QBR Template in Power BI using Comparison Bar Chart

Why are QBR Templates important for your Business?

  1. Performance Evaluation: QBR template provides a structured way to assess business performance. They help in tracking progress toward key goals, identify growth opportunities, and measure the success of strategic initiatives.
  2. Data-Driven Decision Making: Since essential metrics, operational insights, and financial updates are consolidated, it will help businesses make informed decisions. QBR highlights strengths, trends, and areas that require immediate attention.
  3. Stakeholder Alignment: Effective communication is a major piece of business success. QBR templates provide a shared understanding of business objectives and priorities, thereby aligning internal teams, executives, and external stakeholders.
  4. Customer Engagement and Retention: Customer insights in QBR help organizations assess satisfaction, retention strategies, and engagement levels. A good grasp of the client’s needs boosts stronger relationships and improves service delivery.
  5. Continuous Improvement: QBR documents the achievements and challenges. This promotes a culture of learning and accountability. Actionable insights from reviews help businesses refine strategies and improve efficiency.

What makes a Good Quarterly Business Review Template?

  • Clear Objectives: Define the purpose and goals of your review.
  • Executive Summary: Highlight key insights, challenges, and accomplishments.
  • Performance Metrics: Include KPIs for revenue, sales, operations, and customer satisfaction.
  • Financial Overview: Present quarterly financials with comparisons to previous periods.
  • Customer Insights: Share feedback, case studies, and engagement trends.

What To Include in Your QBR Template?

  1. Executive Summary: Come up with a brief overview of key achievements (and challenges) from the quarter. You also need a high-level summary of financial performance and operational results.
  2. Business Goals and Objectives: Outline the strategic goals for the quarter. The goals have to align with the company’s priorities.
  3. Key Performance Indicators (KPIs): Look out for metrics that track success. It could be customer acquisition, retention rates, or revenue. Perform a comparative analysis of current performance vs. targets (or previous quarters).
  4. Financial Overview: It involves income, expenses, and profit analysis. Break down the revenue streams and operating costs.
  5. Operational Updates: Monitor progress on ongoing projects and initiatives. Make the necessary adjustments to improve performance.
  6. Customer Insights and Feedback: Keep a close eye on key customer satisfaction and engagement metrics. Feedback trends and case studies are some of the ways of drawing customer insights.
  7. Risks and Challenges: Identify current and potential risks. You need to have plans and take action to mitigate any challenges.

How to Analyze Quarterly Business Review Templates in Power BI?

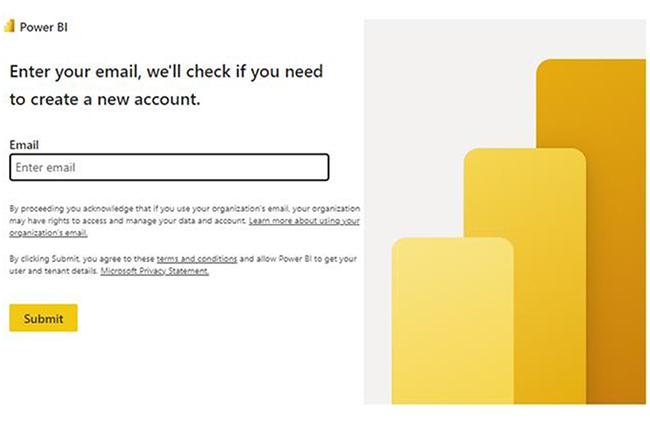
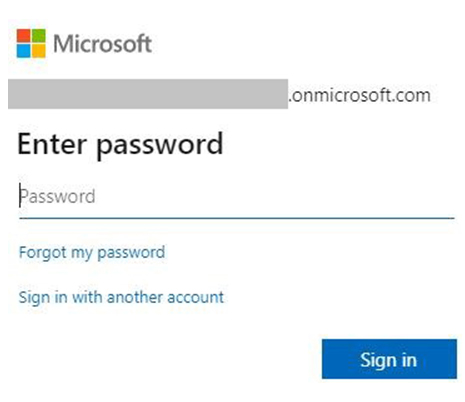
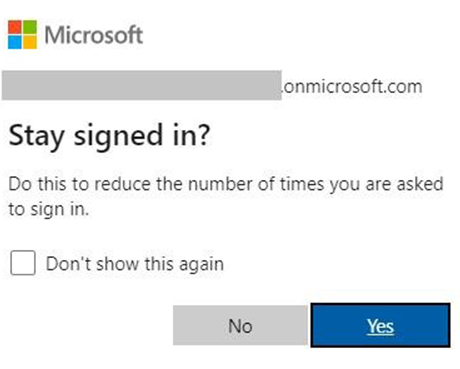
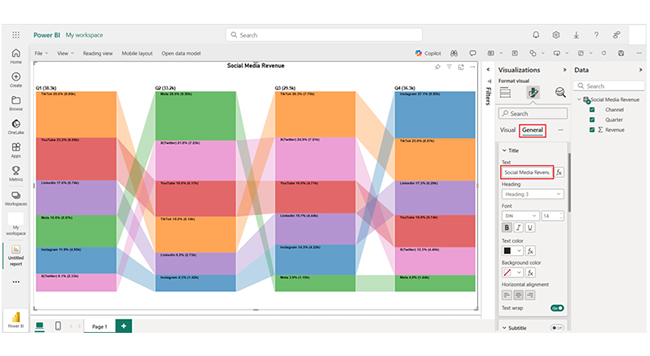
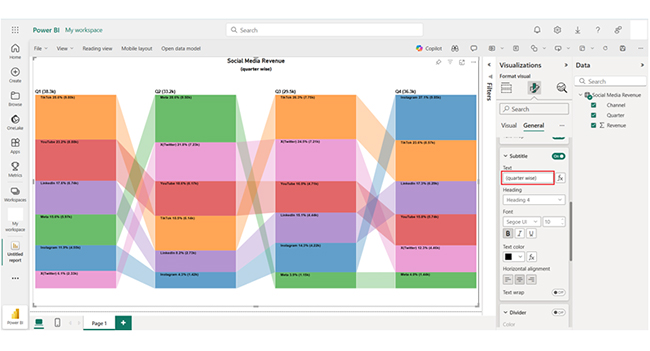
This section shows you how Power BI publishing to web works. These are the stages to help you get started.

  • Stage 1: Log into Power BI, enter your email address, and click the “Submit” button.
Quarterly Business Review (QBR) template
  • You’ll be redirected to a Microsoft account. Enter your password, and click “Sign in.”
Quarterly Business Review (QBR) template
  • You can opt to stay signed in.
Quarterly Business Review (QBR) template
  • Stage 2: Create a Data Set and Select the Data Set to Use in the Chart
  • Navigate to the left-side menu, and click the “Create” button. Select “Paste or manually enter data.”
Quarterly Business Review (QBR) template
  • The sample data below will be used for this illustration.
Quarterly Business Review (QBR) template
  • Paste the data table into the “Power Query” window. After that, choose the “Create a blank report” option.
Quarterly Business Review (QBR) template
  • Click on “Get more visuals.”
Quarterly Business Review (QBR) template
  • After that, click “Get more visuals,” and search ChartExpo. Select Comparison Bar Chart.
Quarterly Business Review (QBR) template
  • Click “Add.”
Quarterly Business Review (QBR) template
  • You’ll see the Comparison Bar Chart in the visuals list.
Quarterly Business Review (QBR) template
  • At this point, click on the License Settings and add your key. After adding the key, you’ll see a comparison bar chart similar to the one below.
Quarterly Business Review (QBR) template
  • You can add the header text on top of the chart.
Quarterly Business Review (QBR) template
  • You can add the header text on top of the chart as a subtitle.
Quarterly Business Review (QBR) template
  • Here’s what the Comparison Bar Chart in Power BI looks like.
Quarterly Business Review (QBR) template

Regardless of the Power BI data model you’re working with, you can perform data analytics, business analytics, or visuals, you’ll get the right results by following the steps outlined above.

Getting the most out of your Power BI dashboard vs report involves tracking the right Power BI metrics.

Insights

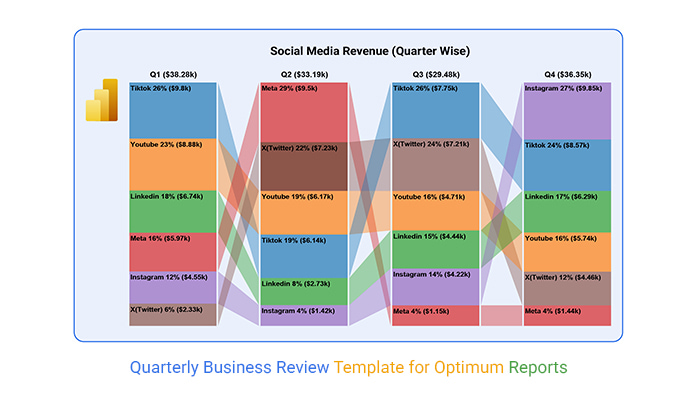
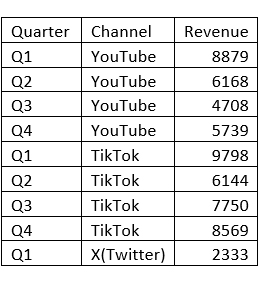
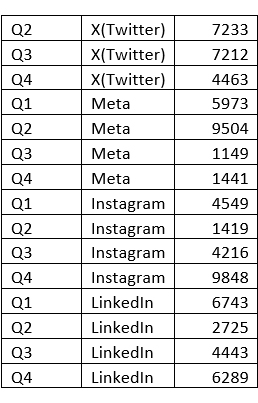
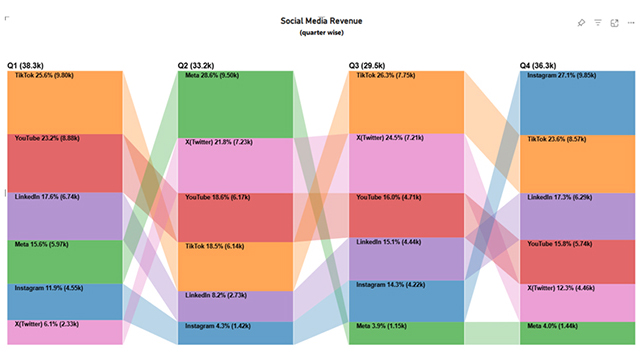
TikTok leads Q1 with peak revenue but declines in Q2, and recovers by Q4. Meta sees a sharp Q2 spike before plummeting. Instagram rebounds with strong Q4 revenue. Twitter (X) peaks in Q2-Q3, while YouTube declines steadily. LinkedIn remains stable but ends with a Q4 boost.

How to Use the Quarterly Business Review Template?

Step 1: Define Your Primary Business Aims

You have to outline the key objectives of your business. These include expanding market reach, increasing revenue, optimizing operations, or improving customer satisfaction. Establishing clear aims will help review the process and align the team’s focus.

Step 2: Evaluate Your Current Quarter Goals

Assess your performance against the goals set for the current quarter. You can use key performance indicators (KPIs) to measure success and identify any deviations. You should highlight achievements, challenges faced, and lessons faced. Analyze financial data, customer engagement metrics, and operational efficiency. This will help you gain a holistic view of the business’s performance.

Step 3: Plan Upcoming Goals

From the insights gained from the current quarter’s evaluation, set actionable goals for the next quarter. Also ascertain that these goals are specific, measurable, achievable, relevant, and time-bound (SMART). Outline strategies, key milestones, and resource requirements. Address any challenges and come up with ways to mitigate risks.

Pros and Cons of Using a QBR Template

Pros of Using a QBR Template

  • Structured Review Process: A QBR template offers a clear framework, and ensures consistent and thorough evaluations of business performance each quarter.
  • Data-Driven Insights: The QBR template consolidates key metrics, customer feedback, and financial data. This will help users in making informed decisions.
  • Actionable Outcomes: A well-designed template offers actionable recommendations for continuous improvement and future planning.
  • Accountability and Transparency: Documenting challenges, progress, and achievements helps foster accountability within teams. This helps in building trust with stakeholders.

Cons of Using a QBR Template

  • Time-Consuming: Completing a QBR template is time-intensive, and also helps gather data from multiple sources.,
  • Over-Simplification: There are cases where a template may not capture the complexity of business nuances. This leads to oversimplified insights.
  • Rigidity: Strict adherence to a template may overlook unique, context-specific business needs or stifle creativity.

Best Practices of Quarterly Business Review Format

  • Start with Executive Summary: Start with a concise overview of key outcomes, successes, and challenges. This sets the tone for the meeting and gives stakeholders the room to understand the highlights.
  • Use Clear, Visual Data: Incorporate graphs, charts, and tables to present data. Good visuals simplify complex information and make performance metrics easier to understand. For instance, you have to use clear data when creating Power BI Calculated Tables.
  • Engage Stakeholders: Encourage discussions and feedback to ensure buy-in from relevant parties. Consider involving departments outside of the core review team for diverse perspectives.
  • Set Clear Next Steps: You have to conclude with actionable next steps. Focus on concrete actions for the next quarter to drive performance and growth.

FAQs

What should be covered in a quarterly business review?

A quarterly business review should cover performance metrics, progress on strategic goals, financial overview, challenges faced, customer insights, and risks. It should also cover key achievements, operational updates, and actionable recommendations for the upcoming quarter.

How do you present a quarterly business review?

You can present a quarterly business review by analyzing performance metrics, summarizing key achievements, addressing challenges, and providing actionable recommendations. Use visuals like graphs and charts to enhance clarity and engage stakeholders.

What is the agenda for a quarterly business review?

A QBR agenda includes: a review of business goals, executive summary, performance metrics, customer insights, financial overview, and operational updates. It also includes actionable recommendations, challenges and risks, and setting goals for the next quarter.

Wrap Up

A QBR template is a structured document for reviewing business performance each quarter. It helps measure KPIs, track goals, align teams, identify challenges, and drive informed decisions.

To get the most out of a QBR template, you’ll have to set clear next steps. Conclude with actionable next steps, and focus on concrete actions for the next quarter.

You should also encourage feedback and discussions to ensure buy-in from all relevant parties. Always involve departments outside of the core review team for diverse perspectives.

Now you know what the quarterly business review template is, what role will it play in your data analytics process?

How much did you enjoy this article?

PBIAd1
Start Free Trial!
149047

Related articles

next previous
Power BI12 min read

In-depth Look at Effective Healthcare Dashboard Examples

Immerse yourself in Healthcare Dashboard Examples, illustrating innovative ways to transform complex data into actionable insights for healthcare professionals.

Power BI12 min read

Power BI Group By Guide for Effective Data Insights

Learn how Power BI Group By helps you aggregate data, clarify trends, and create reports by grouping values to make large datasets manageable & insightful.

Power BI12 min read

How to Create Sankey Diagram in Microsoft Power BI?

Learn How to Create Sankey Diagram in Microsoft Power BI using Desktop & Web Service. What they are and how to use them effectively.

Power BI8 min read

Power BI Artificial Intelligence: Insights Using Visuals

Discover all there is to know about the Power BI artificial intelligence. You'll also discover how AI is used in Power BI, and how to use it for analysis and more.

Power BI9 min read

Budgeting in Healthcare: Use Visuals to Spot Budget Gaps

This guide helps you discover what budgeting in healthcare is. You'll also discover the factors that affect hospital budgets and types of budgeting in healthcare.

ChartExpo logo

Turn Data into Visual
Stories

CHARTEXPO

  • Home
  • Gallery
  • Videos
  • Services
  • Pricing
  • Contact us
  • FAQs
  • Privacy policy
  • Terms of Service
  • Sitemap

TOOLS

  • ChartExpo for Google Sheets
  • ChartExpo for Microsoft Excel
  • Power BI Custom Visuals by ChartExpo
  • Word Cloud

CATEGORIES

  • Bar Charts
  • Circle Graphs
  • Column Charts
  • Combo Charts
  • Comparison Charts
  • Line Graphs
  • PPC Charts
  • Sentiment Analysis Charts
  • Survey Charts

TOP CHARTS

  • Sankey Diagram
  • Likert Scale Chart
  • Comparison Bar Chart
  • Pareto Chart
  • Funnel Chart
  • Gauge Chart
  • Radar Chart
  • Radial Bar Chart
  • Sunburst Chart
  • see more
  • Scatter Plot Chart
  • CSAT Survey Bar Chart
  • CSAT Survey Chart
  • Dot Plot Chart
  • Double Bar Graph
  • Matrix Chart
  • Multi Axis Line Chart
  • Overlapping Bar Chart
  • Control Chart
  • Slope Chart
  • Clustered Bar Chart
  • Clustered Column Chart
  • Box and Whisker Plot
  • Tornado Chart
  • Waterfall Chart
  • Word Cloud
  • see less

RESOURCES

  • Blog
  • Resources
  • YouTube
SIGN UP FOR UPDATES

We wouldn't dream of spamming you or selling your info.

© 2025 ChartExpo, all rights reserved.