• Home
  • Tools dropdown img
    • Spreadsheet Charts

      • ChartExpo for Google Sheets
      • ChartExpo for Microsoft Excel
    • Power BI Charts

      • Power BI Custom Visuals by ChartExpo
    • Word Cloud

  • Charts dropdown img
    • Chart Category

      • Bar Charts
      • Circle Graphs
      • Column Charts
      • Combo Charts
      • Comparison Charts
      • Line Graphs
      • PPC Charts
      • Sentiment Analysis Charts
      • Survey Charts
    • Chart Type

      • Box and Whisker Plot
      • Clustered Bar Chart
      • Clustered Column Chart
      • Comparison Bar Chart
      • Control Chart
      • CSAT Survey Bar Chart
      • CSAT Survey Chart
      • Dot Plot Chart
      • Double Bar Graph
      • Funnel Chart
      • Gauge Chart
      • Likert Scale Chart
      • Matrix Chart
      • Multi Axis Line Chart
      • Overlapping Bar Chart
      • Pareto Chart
      • Radar Chart
      • Radial Bar Chart
      • Sankey Diagram
      • Scatter Plot Chart
      • Slope Chart
      • Sunburst Chart
      • Tornado Chart
      • Waterfall Chart
      • Word Cloud
    • Google Sheets
      Microsoft Excel
  • Services
  • Pricing
  • Contact us
  • Blog
  • Support dropdown img
      • Gallery
      • Videos
      • Contact us
      • FAQs
      • Resources
    • Please feel free to contact us

      atsupport@chartexpo.com

Categories
All Data Visualizations Data Analytics Surveys
Add-ons/
  • Google Sheets
  • Microsoft Excel
  • Power BI
All Data Visualizations Data Analytics Surveys
Add-ons
  • Google Sheets
  • Microsoft Excel
  • Power BI

We use cookies

This website uses cookies to provide better user experience and user's session management.
By continuing visiting this website you consent the use of these cookies.

Ok

ChartExpo Survey


Home > Blog > Google Sheets

Mastering Google Sheets Slicers for Enhanced Insights

What is a Google Sheet slicer? This handy tool changes the way you interact with your data. Filtering, sorting, and analyzing become faster and more intuitive. For businesses and individuals, it’s a game-changer for better decision-making.

Data drives our decisions every day. However, raw data can feel overwhelming. A Google Sheet slicer simplifies data, allowing you to filter information directly on your spreadsheet. It works seamlessly with tools like a Google Sheets extension to expand functionality further. However, you can focus on what matters most instead of scrolling through endless rows.

How to Measure Happiness

Imagine tracking sales or analyzing project performance in a shared file. Slicer helps team members to instantly filter for specific details without altering the main data. It’s efficient and eliminates confusion. Google Sheet slicers are useful for collaborative projects, helping with data discovery and making shared data cleaner.

Adding a slicer gives your spreadsheet a more interactive feel. Instead of static tables, data becomes flexible and responsive, bringing clarity to complex spreadsheets.

This tool is for you if you’ve ever struggled to organize or analyze data. It pairs well with KPI graphs for visual insights. By using a Google Sheet slicer, you save time and gain clarity. Mastering it could transform how you work with spreadsheets.

Let’s dive deep and learn more about Google Sheet Slicer.

Table of Contents:

  1. What are Google Sheet Slicers?
  2. Why Do We Use Google Spreadsheet Slicers?
  3. Difference Between Google Sheet Slicer vs. Filters
  4. How to Add a Slicer in Google Sheets?
  5. How to Use Slicers in Google Sheets?
  6. How do you Visualize Data with Slicer in Google Sheets?
  7. How to Remove Google Sheet Slicer?
  8. Benefits of Slicers in Google Spreadsheet
  9. FAQs
  10. Wrap Up

What are Google Sheet Slicers?

Definition: Google Sheet slicers are interactive tools that filter and sort spreadsheet data. Therefore, it makes it easier to focus on specific information without altering the main dataset. You can use slicers to complement custom Excel charts for advanced data visualization. It effortlessly allows you to create customized views of your data.

Google Sheets slicers are useful for tracking sales, analyzing performance, and managing projects. They are also useful in collaborative files, allowing you to filter data independently. This feature simplifies large spreadsheets and improves efficiency for both individuals and teams.

Why Do We Use Google Spreadsheet Slicers?

Google Spreadsheet slicers are powerful tools that make working with data easier. They clarify large datasets and let you focus on what matters most. Slicers make spreadsheets smarter and more interactive for personal projects or team collaboration. Here’s why you should use these spreadsheet slicers:

  • Interactive data filtering: Slicers let you filter data directly within the sheet. This method does not require modifying the main dataset and is quick, precise, and hassle-free.
  • Dynamic dashboards: Create dashboards that respond to your needs. With slicers, you can change views instantly and see results in real time.
  • Improved visualization: Large spreadsheets can feel overwhelming. Slicers simplify this by making data more accessible and clear.
  • Ease of use: Slicers are easy to use, even for beginners. You don’t need to be a tech expert to add and customize them.
  • Time-saving: Quickly focus on key insights without manual filtering. Slicers speed up data analysis and reporting.
  • Enhanced collaboration: In shared spreadsheets, each person can use slicers to view the data they need. It helps avoid confusion and keeps the main dataset intact.

Difference Between Google Sheet Slicer vs. Filters

Slicers and filters play key roles when managing data in Google Sheets, but they have distinct features. Let’s break down the differences between Google Sheet slicers and filters.

Feature Google Sheets Slicer Google Sheets Filters
Interactivity & Usability Designed for interactivity; users can visually filter data by clicking slicer elements.

Ideal for sharing and presentations, allowing viewers to interact without editing the sheet.

Requires manual adjustment of filter options, making it less intuitive for viewers but practical for editors.
Range & Sheet Impact Linked to specific ranges, ensuring localized filtering without affecting other parts of the sheet or users. Works across the entire sheet unless specified, and changes can impact all viewers.
Visual Interface Offers a sleek, on-sheet placement, making filtering options easily accessible and intuitive. Operates through drop-down menus with no visual component.
Persistence Filters applied via slicer remain active even after refreshing or sharing the sheet. Filters reset upon refreshing or if altered by another user.
Purpose & Practicality Best suited for viewing, interactive filtering, and shared reports; less practical for editing. Perfect for temporary data manipulation and editing workflows.

How to Add a Slicer in Google Sheets?

Adding a slicer in Google Sheets is super easy and incredibly useful. It enhances your data interpretation by allowing you to filter and focus on specific insights.

Here’s how you can do it in just two steps:

  • Add the slicer: Click on the “Data” tab in the top menu and select “Add a slicer”. A slicer box will instantly appear on your sheet.
How to Measure Happiness
  • Customize your slicer: Click the slicer and use the side panel to choose the range and column you want to filter. Drag it to your preferred spot and adjust its style if needed.
How to Measure Happiness

How to Use Slicers in Google Sheets?

Slicers in Google Sheets make filtering data fast and intuitive. They’re perfect for narrowing down your information without altering the original dataset. You can pair them with a cash flow chart to analyze financial data more effectively. Ready to learn how to use them?

  • Select your data and add a slicer: Highlight the entire dataset you want to filter. Go to the top menu, click “Data,” and choose “Add a Slicer.” A slicer box will appear on your sheet.
How to Measure Happiness
  • Choose a dimension: In the slicer settings, select the dimension you want to filter, such as “Quarter”. This will set the slicer to organize data based on your chosen field.
How to Measure Happiness
  • Apply a filter: Click on the slicer, choose the values you want (e.g., Quarter 1 and 2), and press “OK”.
How to Measure Happiness
  • After applying, it will appear as shown below:
How to Measure Happiness
  • Use comparison filters: If you need more precision, choose options like “Less than 700” to further narrow down numerical data.
How to Measure Happiness
  • View the results: After applying the filters, your sheet updates instantly. You’ll see a clean, focused view of the data that matches your criteria.
How to Measure Happiness

How do you Visualize Data with Slicer in Google Sheets?

Data is everywhere, but making sense of it can feel like solving a jigsaw puzzle. Google Sheets, though powerful, often falls short in delivering sleek visual analytics for deeper insights. Basic charts don’t cut it for modern data analysis – extraordinary graph design ideas do!

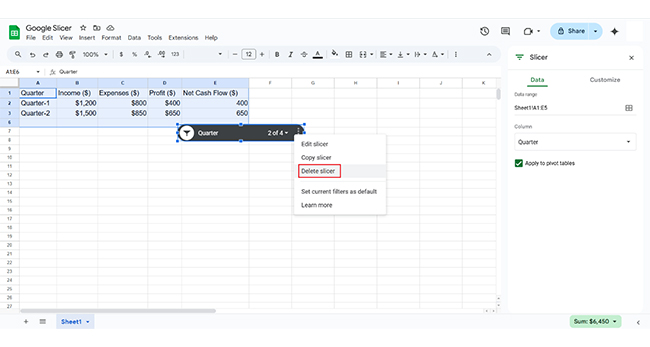
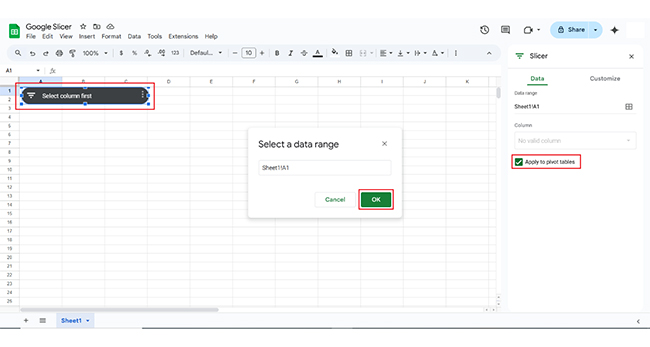
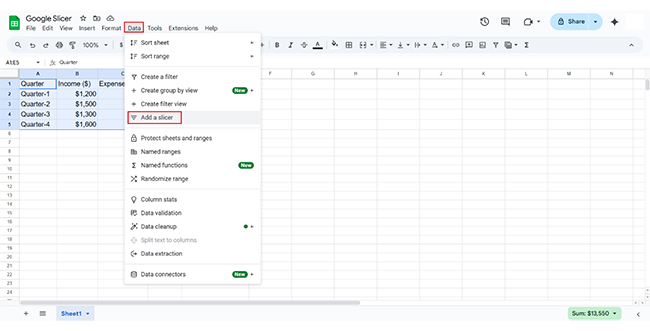
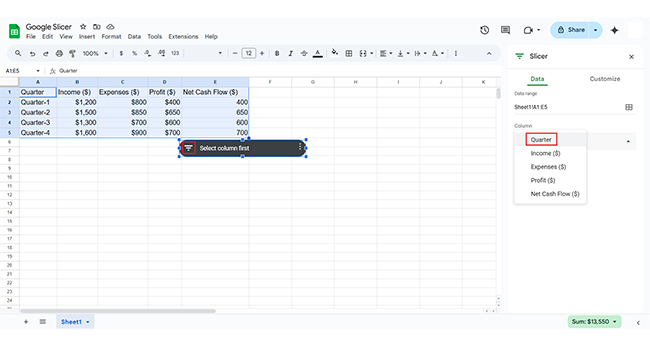
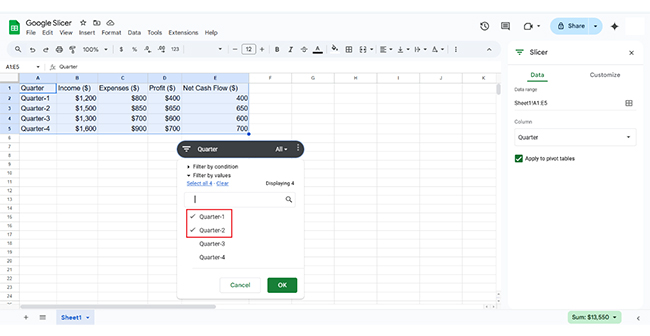
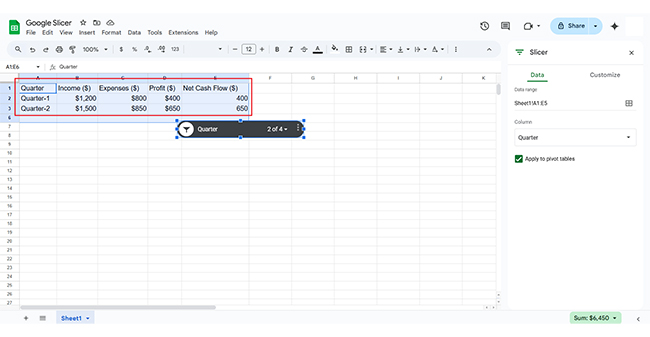
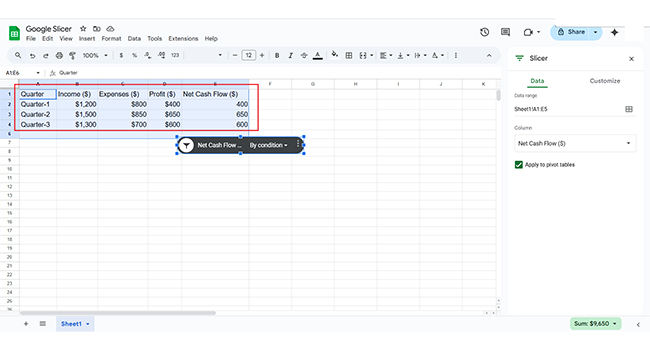
Enter Google Sheet slicers—an interactive way to filter and explore your data. They bring clarity and precision, allowing you to focus on what truly matters.
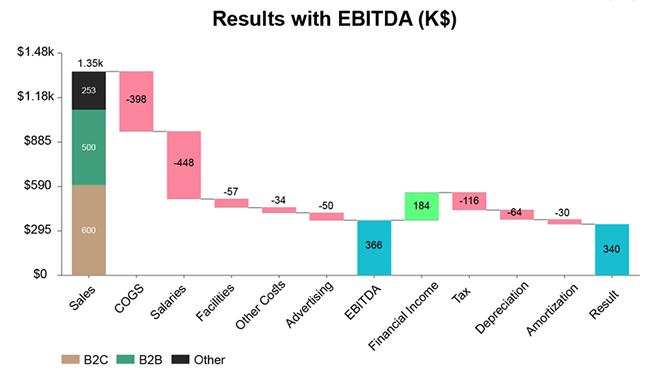
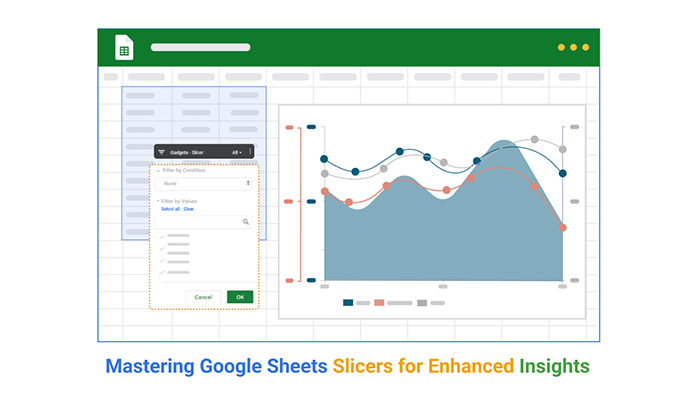
What about ChartExpo? It is a game-changer that transforms raw data into stunning, insightful visuals. It bridges the gap between basic spreadsheets and advanced visual analytics tools.

Ready to up your data game? Install ChartExpo.

The charts below are created in Google Sheets using ChartExpo as follows:

Sankey Diagram:

How to Measure Happiness

Horizontal Waterfall Chart:

How to Measure Happiness

Likert Scale Chart:

How to Measure Happiness

Stacked Waterfall Chart:

How to Measure Happiness

Multi Axes Line Chart:

How to Measure Happiness

How to Install ChartExpo in Google Sheets?

  1. To start using ChartExpo, download it directly from the Google Sheets program. To do this, select Extensions from the top toolbar.
  2. A menu will appear. Click the Get add-ons option.
  3. Search for ChartExpo, and click on Charts, Graphs & Visualizations by ChartExpo when it appears in the results.
  4. Click the Install button. You will have to confirm your Google account and accept some permissions.

ChartExpo charts are available both in Google Sheets and Microsoft Excel. Which one do you prefer: Google Sheets vs. Excel? Please use the following CTAs to install the tool of your choice and create beautiful visualizations in a few clicks in your favorite tool.

Example

Let’s analyze the sample data below in Google Sheets using ChartExpo.

Quarter Income ($) Expenses ($) Profit ($) Net Cash Flow ($)
Quarter-1 $1,200 $800 $400 400
Quarter-2 $1,500 $850 $650 650
Quarter-3 $1,300 $700 $600 600
Quarter-4 $1,600 $900 $700 700


  • To get started with ChartExpo, install ChartExpo in Google Sheets.
  • Go to Extensions > Charts, Graphs & Visualizations by ChartExpo > Open.
How to Measure Happiness
  • To access the charts library, click the Add new chart button.
How to Measure Happiness
  • Once it loads, scroll through the charts list to locate and choose the “Multi-Axis Line Chart”.
How to Measure Happiness
  • Click the “Create Chart From Selection” button after selecting the data from the sheet, as shown.
How to Measure Happiness
  • If you want to add anything to the chart, click the Edit Chart button:
How to Measure Happiness
  • Click on Settings and change the “Data Representation” as follows.
How to Measure Happiness
  • Click the pencil icon next to the Chart Header to change the title.
  • It will open the properties dialog. Under the Text section, you can add a heading in Line 1 and enable Show.
  • Give the appropriate title of your chart and click the Apply button.
How to Measure Happiness
  • You can add the Dollar Sign ($) with all values and also change the precision value to zero as follows:
How to Measure Happiness
  • Change the Legend shape of “Income and Net Cash Flow” into a Line and Circle and click the “Apply” button.
How to Measure Happiness
  • Change the shape of “Profit” into a Column and click the “Apply” button:
How to Measure Happiness
  • After making all the changes, click on the “Save” button as follows:
How to Measure Happiness
  • Your final Multi Axis Line Chart will look like the one below.
How to Measure Happiness

Insights

  • Income and profit show consistent quarterly growth.
  • Expenses increase but remain controlled.
  • Profit margins stay positive throughout the year.
  • Net cash flow improves steadily over time.
  • Quarter 4 sees peak income and profit, marking a successful period.
  • Profitability and healthy cash flow are maintained year-round.

How to Remove Google Sheet Slicer?

Removing a slicer in Google Sheets is as simple as adding it. If you no longer need it, follow these steps to declutter your sheet in a snap:

  • Select the slicer: Click on the slicer you want to remove. Once selected, a small menu will appear.
How to Measure Happiness
  • Delete the slicer: Click “Delete slicer” from the menu or hit the Delete key on your keyboard. And voilà! The slicer is gone.
How to Measure Happiness

Benefits of Slicers in Google Spreadsheet

Slicers in Google Spreadsheets are game-changers for organizing and analyzing data. They simplify large datasets, making them easier to navigate and understand. Slicers make your data more interactive and efficient for personal projects or team collaborations. Here are the top benefits:

  • Interactive data filtering: Slicers allow you to filter data instantly without altering the original dataset. It’s precise, quick, and hassle-free.
  • Improved visualization and dashboards: Slicers enhance data viewing by creating dynamic, real-time dashboards. You can easily create a Dashboard in Google Sheets to visualize your data effectively.
  • Enhanced collaboration: Slicers let you apply filters in shared spreadsheets. It keeps the main data intact while meeting individual needs.
  • Time efficiency: Slicers save time by removing the need for manual filtering. They make analyzing and presenting data faster and easier.
  • Customization and flexibility: You can adapt slicers to fit your data needs. Choose dimensions, adjust filters, and create a tailored view of your information.

FAQs

Is there a slicer in Google Sheets?

Yes, Google Sheets includes slicers. Slicers help filter data in charts and pivot tables, making data exploration easier. While useful, their design and functionality are limited for advanced data visualization needs.

How do you lock the slicer in Google Sheets?

To lock a slicer in Google Sheets, restrict access to the sheet.

  1. Right-click the sheet tab and select “Protect sheet”.
  2. Customize permissions to limit editing.

You can view the slicer but can’t modify its settings or filters.

How does a slicer work in Google Sheets?

A slicer in Google Sheets filters data in charts or pivot tables. It provides clickable options to refine displayed data dynamically. Changes made through the slicer instantly update linked visuals, making data exploration more interactive and efficient.

Wrap Up

Google Sheet slicers are powerful tools that simplify data management. They help you filter and organize information effortlessly. With slicer, you can focus on what matters most without altering the main dataset. They are useful when managing a budget on Google Sheets to track and refine expenses.

These tools make large spreadsheets manageable and provide quick ways to analyze and customize views of your data. Whether for personal projects or team collaboration, slicers make spreadsheets more efficient. Pairing slicers with a chart maker and a Google Sheets progress bar can further enhance your data presentation.

Slicers improve productivity by saving time. Instead of manual filtering, you can apply filters instantly. This speeds up decision-making and enhances workflow.

Slicers offer better clarity for visual learners. They turn static data into interactive, flexible views. This feature is perfect for dashboards, presentations, and exploring graph design Ideas that make data a standout.

Finally, collaboration becomes seamless. You can apply filters independently, avoiding confusion and keeping the shared data intact.

Google Sheet slicers bring precision, speed, and simplicity to your work. Mastering them is key to smarter data management and better insights. For enhanced data visualization, consider installing ChartExpo. This will take your analysis to the next level and make your data more impactful.

How much did you enjoy this article?

GSAd1
Start Free Trial!
147903

Related articles

next previous
Google Sheets11 min read

Google Spreadsheet Timesheet Template: A Visual Guide

A Google spreadsheet timesheet template simplifies time tracking and payroll management. Learn how to create, customize, and analyze timesheets.

Google Sheets9 min read

Google Sheets Transpose: A Complete Guide

Discover what Google Sheets Transpose is and how to flip data in your spreadsheet. You’ll learn methods and tips to enhance data analysis and visualization.

Google Sheets12 min read

How to Make Progress Bar in Google Sheets: Step-by-Step

Learn how to create a dynamic progress bar in Google Sheets to visually track goals, tasks, or project completion. Step-by-step guide with tips and examples.

Google Sheets10 min read

Google Workspace for Education for Better Insights

Google Workspace for Education boosts collaboration and remote learning. Explore its features, benefits, and how ChartExpo enhances data analysis.

Google Sheets9 min read

Google Workspace Marketplace for Boosting Insights

Google Workspace Marketplace provides apps to enhance Gmail, Drive, and Docs. Learn about this tool and how to improve data visualization and analysis.

ChartExpo logo

Turn Data into Visual
Stories

CHARTEXPO

  • Home
  • Gallery
  • Videos
  • Services
  • Pricing
  • Contact us
  • FAQs
  • Privacy policy
  • Terms of Service
  • Sitemap

TOOLS

  • ChartExpo for Google Sheets
  • ChartExpo for Microsoft Excel
  • Power BI Custom Visuals by ChartExpo
  • Word Cloud

CATEGORIES

  • Bar Charts
  • Circle Graphs
  • Column Charts
  • Combo Charts
  • Comparison Charts
  • Line Graphs
  • PPC Charts
  • Sentiment Analysis Charts
  • Survey Charts

TOP CHARTS

  • Sankey Diagram
  • Likert Scale Chart
  • Comparison Bar Chart
  • Pareto Chart
  • Funnel Chart
  • Gauge Chart
  • Radar Chart
  • Radial Bar Chart
  • Sunburst Chart
  • see more
  • Scatter Plot Chart
  • CSAT Survey Bar Chart
  • CSAT Survey Chart
  • Dot Plot Chart
  • Double Bar Graph
  • Matrix Chart
  • Multi Axis Line Chart
  • Overlapping Bar Chart
  • Control Chart
  • Slope Chart
  • Clustered Bar Chart
  • Clustered Column Chart
  • Box and Whisker Plot
  • Tornado Chart
  • Waterfall Chart
  • Word Cloud
  • see less

RESOURCES

  • Blog
  • Resources
  • YouTube
SIGN UP FOR UPDATES

We wouldn't dream of spamming you or selling your info.

© 2025 ChartExpo, all rights reserved.