• Home
  • Tools dropdown img
    • Spreadsheet Charts

      • ChartExpo for Google Sheets
      • ChartExpo for Microsoft Excel
    • Power BI Charts

      • Power BI Custom Visuals by ChartExpo
    • Word Cloud

  • Charts dropdown img
    • Chart Category

      • Bar Charts
      • Circle Graphs
      • Column Charts
      • Combo Charts
      • Comparison Charts
      • Line Graphs
      • PPC Charts
      • Sentiment Analysis Charts
      • Survey Charts
    • Chart Type

      • Box and Whisker Plot
      • Clustered Bar Chart
      • Clustered Column Chart
      • Comparison Bar Chart
      • Control Chart
      • CSAT Survey Bar Chart
      • CSAT Survey Chart
      • Dot Plot Chart
      • Double Bar Graph
      • Funnel Chart
      • Gauge Chart
      • Likert Scale Chart
      • Matrix Chart
      • Multi Axis Line Chart
      • Overlapping Bar Chart
      • Pareto Chart
      • Radar Chart
      • Radial Bar Chart
      • Sankey Diagram
      • Scatter Plot Chart
      • Slope Chart
      • Sunburst Chart
      • Tornado Chart
      • Waterfall Chart
      • Word Cloud
    • Google Sheets
      Microsoft Excel
  • Services
  • Pricing
  • Contact us
  • Blog
  • Support dropdown img
      • Gallery
      • Videos
      • Contact us
      • FAQs
      • Resources
    • Please feel free to contact us

      atsupport@chartexpo.com

Categories
All Data Visualizations Data Analytics Surveys
Add-ons/
  • Google Sheets
  • Microsoft Excel
  • Power BI
All Data Visualizations Data Analytics Surveys
Add-ons
  • Google Sheets
  • Microsoft Excel
  • Power BI

We use cookies

This website uses cookies to provide better user experience and user's session management.
By continuing visiting this website you consent the use of these cookies.

Ok

ChartExpo Survey


Home > Blog > Data Analytics

What Does DEI Stands for in Business & Corporate Culture?

What does DEI stand for? This acronym has gained new significance in the corporate realm.

DEI represents Diversity, Equity, and Inclusion – three interconnected concepts shaping modern workplaces. These principles are transforming how organizations operate and interact with their employees.

Almost 60% of employed U.S. adults say DEI initiatives are good for business! This statistic points out how these initiatives are becoming increasingly important. More and more, companies are realizing how much they need diverse perspectives in inclusive environments.

What Does DEI Stand For

Understanding DEI is vital in today’s business world. It’s not a passing trend. DEI efforts are becoming integral to company policies and culture. In fact, 61% of workers report their organizations have policies ensuring fairness in hiring, pay, and promotions.

But what does DEI stand for in practice? To create workplaces that represent our diverse society, where everyone has access and feels welcomed. Companies with strong DEI practices often outperform their less diverse counterparts.

Interestingly, opinions on what DEI stands for and its importance vary along demographic and political lines. Such thoughts emphasize the challenge of executing strong DEI strategies. It underscores the necessity for continued dialogue and enlightenment.

Here, we will examine DEI in detail, its key factors, advantages, and challenges. We will also explore how companies can go beyond the buzz and make a difference.

Let’s break down this essential element of the modern workplace.

Table of Contents:

  1. What is Diversity, Equity, and Inclusion (DEI)?
  2. Why is DEI Important?
  3. How to Apply Diversity in the Workplace?
  4. What are the Best DEI Strategies?
  5. What are the Five Stages of DEI Maturity?
  6. How to Visualize the Impact of DEI?
  7. What are the Advantages and Disadvantages of DEI?
  8. Wrap Up

First…

What is Diversity, Equity, and Inclusion (DEI)?

Definition: Diversity, Equity, and Inclusion (DEI) are principles that guide how organizations create fair and welcoming environments.

  • Diversity refers to the presence of differences within a group. These include race, gender, age, sexual orientation, and religion.
  • Equity focuses on fairness and justice. It ensures everyone can access the same opportunities by addressing systemic barriers and providing necessary resources.
  • Inclusion is about creating environments where everyone feels valued and respected. It actively involves diverse individuals in all aspects of work and decision-making.

DEI initiatives aim to foster a culture where all individuals can thrive. They promote understanding, reduce discrimination, and enhance collaboration. These principles are essential for creating a just and productive society where everyone has a chance to succeed.

Why is DEI Important?

Imagine working in a place where everyone feels valued, differences are celebrated, and everyone has a chance to succeed. That’s the power of Diversity, Equity, and Inclusion (DEI). Why is DEI so important?

  • Enhancing innovation and creativity: When diverse perspectives come together, creativity flourishes. Different backgrounds and experiences spark new ideas and lead to innovative solutions.
  • Improving organizational performance: Organizations embracing DEI often outperform those that do not. Diverse teams bring various skills and insights, leading to data-driven decision-making and stronger results.
  • Fostering equity and fairness: DEI ensures everyone can access opportunities and resources. It’s about leveling the playing field and addressing long-standing inequalities.
  • Building a sense of belonging: People are more engaged and committed when they feel included. DEI creates a workplace where everyone feels they belong, boosting morale and productivity.
  • Enhancing reputation and brand: Companies committed to DEI and a customer loyalty rewards program attract top talent and loyal customers. A strong DEI culture, combined with rewarding loyal customers, enhances an organization’s reputation and brand, making it a leader in its field.

How to Apply Diversity in the Workplace?

Creating a diverse workplace isn’t just about hiring people from different backgrounds. Instead, it’s about fostering an environment where everyone can thrive. Here’s how to apply diversity in the workplace:

  • Inclusive recruitment and training: Start by actively seeking diverse talent during recruitment. Then, provide ongoing training to ensure all employees understand and value diversity.
  • Supportive policies and leadership: Implement inclusive policies that promote equity and fairness. Encourage leaders to model inclusive behaviors and champion diversity initiatives.
  • Mentorship and Employee Resource Groups (ERGs): Offer mentorship and sponsorship programs to support diverse employees’ growth. ERGs can provide a sense of community and empower employees to share their experiences and ideas.
  • Continuous evaluation and improvement: Regularly assess diversity efforts to ensure effectiveness. Gather feedback, analyze data, and make necessary adjustments to improve your DEI strategy.

What are the Best DEI Strategies?

Developing strong Diversity, Equity, and Inclusion (DEI) strategies is essential for building a thriving workplace. Here are key strategies that can make a real impact:

  1. Leadership commitment: DEI starts at the top. Leaders must be fully committed to driving and supporting DEI initiatives across the organization.
  2. Inclusive recruitment and equitable policies: Focus on attracting diverse talent and implementing policies that ensure fairness and equal opportunities for all employees.
  3. Education and training: Provide ongoing DEI training to foster understanding and equip employees with the tools to create an inclusive environment.
  4. Mentorship and Employee Resource Groups (ERGs): Support diverse employees through mentorship programs and ERGs, which offer networking, development, and a sense of community.
  5. Data-driven continuous improvement: Use data to assess DEI efforts and make informed decisions. Review and refine strategies regularly to ensure continuous progress.

What are the Five Stages of DEI Maturity?

Understanding where your organization stands in its Diversity, Equity, and Inclusion (DEI) journey is crucial for progress. The path to DEI maturity can be seen in five stages:

  1. Awareness: This is the starting point where organizations recognize the importance of DEI. There’s a growing understanding of the benefits and challenges, but efforts are often informal and unstructured.
  2. Commitment: At this stage, leadership begins to commit to DEI actively. Goals are set, resources are allocated, and the organization develops a strategic plan to drive DEI initiatives forward.
  3. Implementation: Here, DEI strategies are put into action. Training programs, inclusive policies, and recruitment efforts are launched, and the organization begins to see early results and challenges.
  4. Integration: DEI becomes embedded in the organization’s culture and operations. It’s not just a set of initiatives but a core value reflected in everyday practices, decision-making, and employee behaviors.
  5. Sustainability: DEI efforts are maintained and continually improved in this final stage. The organization regularly evaluates its progress and ensures that DEI remains a permanent and evolving part of its identity.

How to Visualize the Impact of DEI?

Diversity, Equity, and Inclusion (DEI) walk into a bar. The bartender asks, “How can I see your impact?” Cue the awkward silence.

It’s not a joke; it’s a real challenge many organizations face.

Enter data visualization, the superhero of data analysis. It’s here to save the day, turning mind-numbing numbers into eye-catching insights.

But wait, what’s that? Excel is struggling to keep up. Its charting options are like bringing an abacus to a supercomputer showdown.

Fear not; we have ChartExpo. It’s the Robin to Excel’s Batman, filling in the gaps and taking data visualization to new heights.

Ready to see DEI in living color? Get started with ChartExpo now!

Let’s learn how to install ChartExpo in Excel.

  1. Open your Excel application.
  2. Open the worksheet and click the “Insert” menu.
  3. You’ll see the “My Apps” option.
  4. In the Office Add-ins window, click “Store” and search for ChartExpo on my Apps Store.
  5. Click the “Add” button to install ChartExpo in your Excel.

ChartExpo charts are available both in Google Sheets and Microsoft Excel. Please use the following CTAs to install the tool of your choice and create beautiful visualizations with a few clicks in your favorite tool.

DEI Program Example

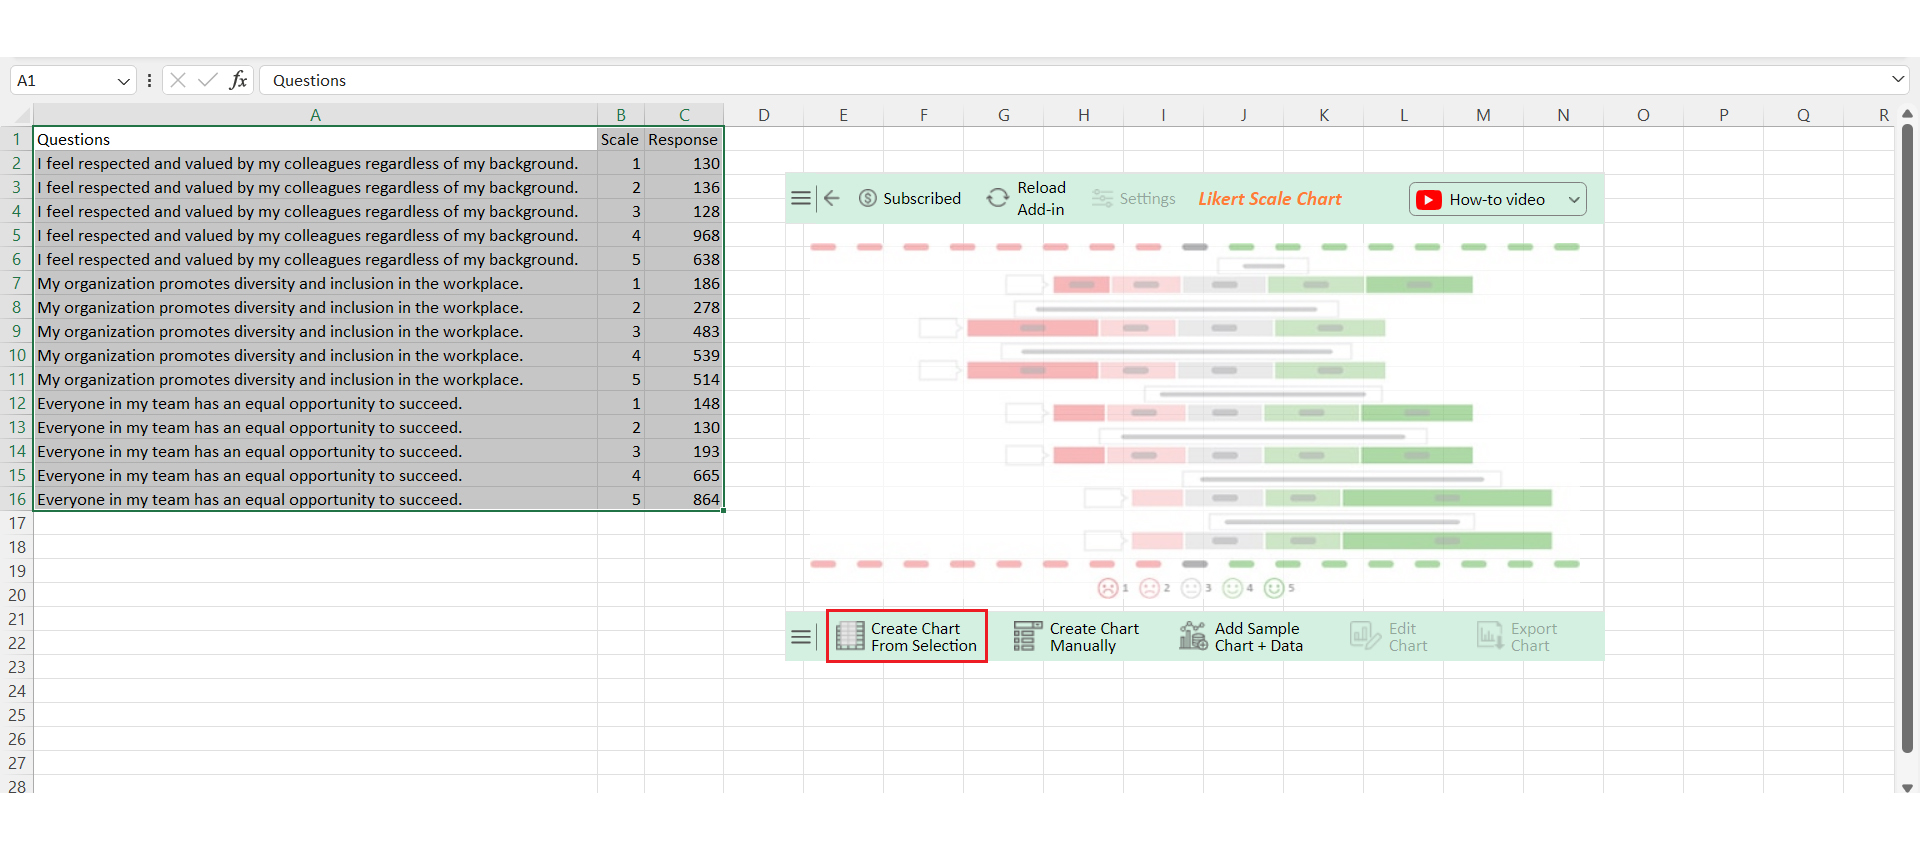
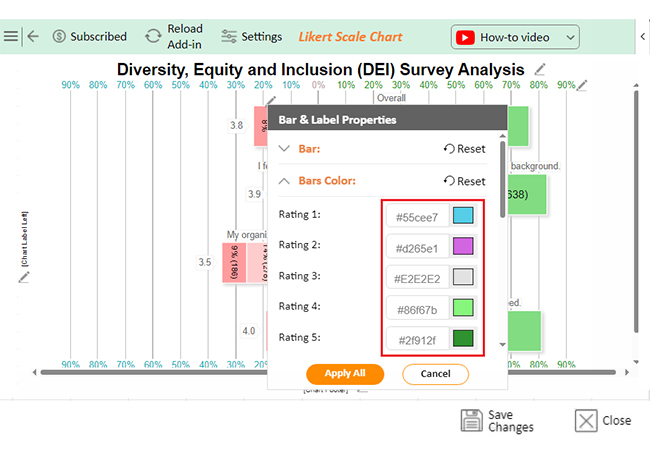
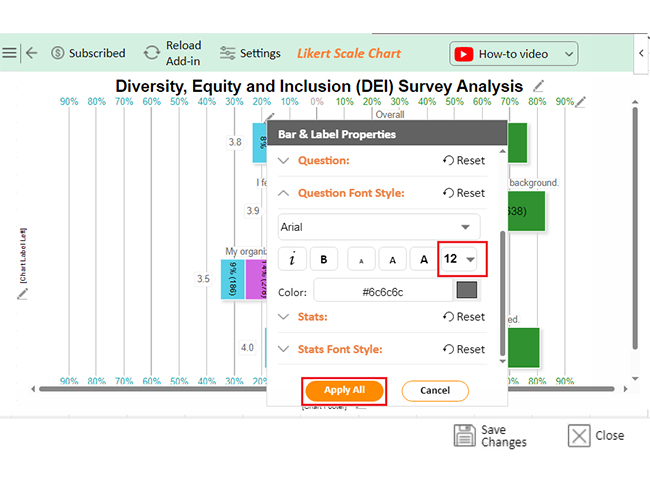
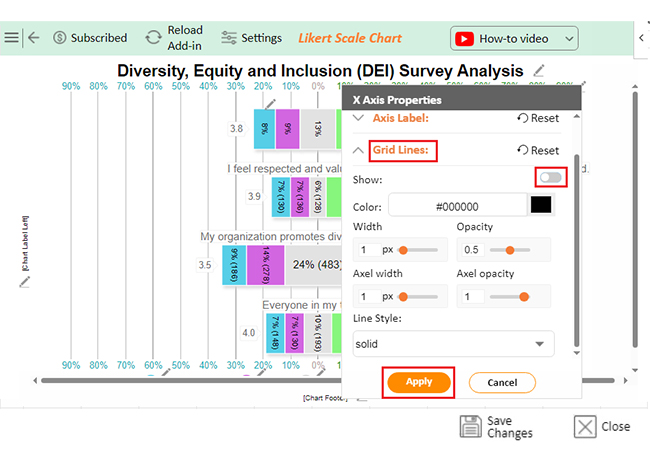
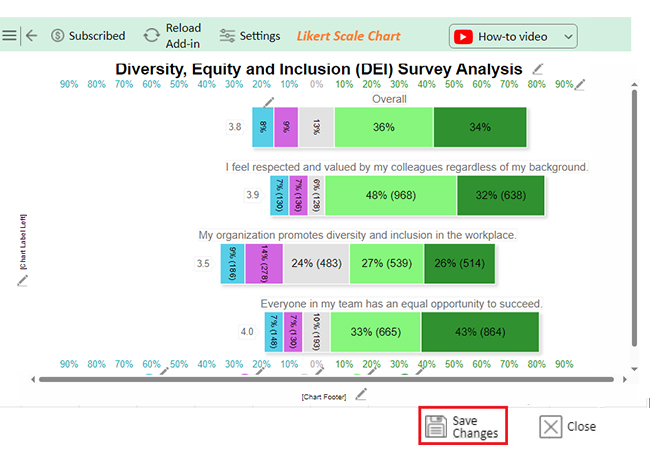
Let’s visualize the DEI sample data below using ChartExpo.

Questions Scale Response
I feel respected and valued by my colleagues regardless of my background. 1 130
I feel respected and valued by my colleagues regardless of my background. 2 136
I feel respected and valued by my colleagues regardless of my background. 3 128
I feel respected and valued by my colleagues regardless of my background. 4 968
I feel respected and valued by my colleagues regardless of my background. 5 638
My organization promotes diversity and inclusion in the workplace. 1 186
My organization promotes diversity and inclusion in the workplace. 2 278
My organization promotes diversity and inclusion in the workplace. 3 483
My organization promotes diversity and inclusion in the workplace. 4 539
My organization promotes diversity and inclusion in the workplace. 5 514
Everyone in my team has an equal opportunity to succeed. 1 148
Everyone in my team has an equal opportunity to succeed. 2 130
Everyone in my team has an equal opportunity to succeed. 3 193
Everyone in my team has an equal opportunity to succeed. 4 665
Everyone in my team has an equal opportunity to succeed. 5 864
  • To get started with ChartExpo, install ChartExpo in Excel.
  • Now Click on My Apps from the INSERT menu.
insert chartexpo in excel
  • Choose ChartExpo from My Apps, then click Insert.
open chartexpo in excel
  • Once it loads, choose the “Likert Scale Chart” from the charts list.
search likert scale chart in excel
  • Click the “Create Chart From Selection” button after selecting the data from the sheet, as shown.
Click Creaet Chart From Selection After Learning What Does DEI Stand For
  • ChartExpo will generate the visualization below for you.
Initial Visual After Learning What Does DEI Stand For
  • If you want to have the chart’s title, click Edit Chart, as shown in the above image.
  • Click the pencil icon next to the Chart Header to change the title.
  • It will open the properties dialog. Under the Text section, you can add a heading in Line 1 and enable Show.
  • Give the appropriate title of your chart and click the Apply button.
Add Chart Header to Visual After Learning What Does DEI Stand For
  • You can change the colors of Axis values as follows:
Change Color of Axis Value After Learning What Does DEI Stand For
  • You can change the colors of Bars as follows:
Change Colors of Bars After Learning What Does DEI Stand For
  • You can change the font size of Questions as follows:
Change Font Size of Questions After Learning What Does DEI Stand For
  • You can change the scale number into words as follows: 1= Very dissatisfied, 2=Dissatisfied, 3=Neutral, 4=Satisfied, 5=Very satisfied
Change Scale Number into Words After Learning What Does DEI Stand For
  • You can disable the Grid lines as follows:
Disable Gird Lines After Learning What Does DEI Stand For
  • Click the “Save Changes” button to persist the changes.
Click Save Changes After Learning What Does DEI Stand For
  • Your final chart will appear below.
Final What Does DEI Stand For

Insights

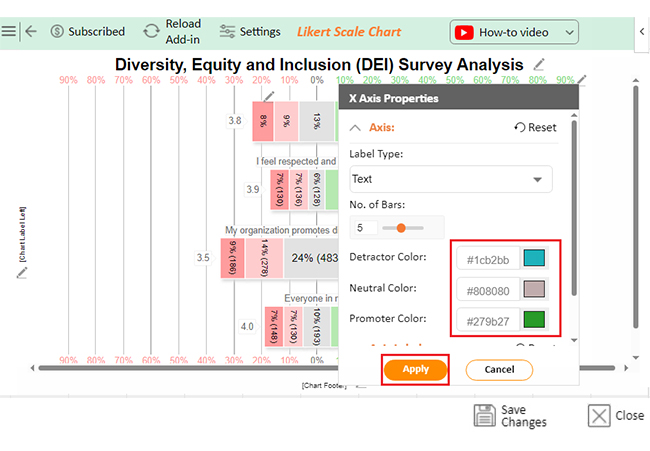
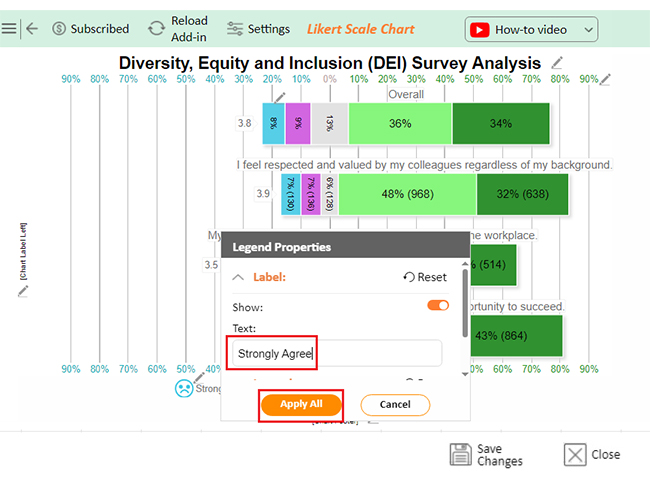
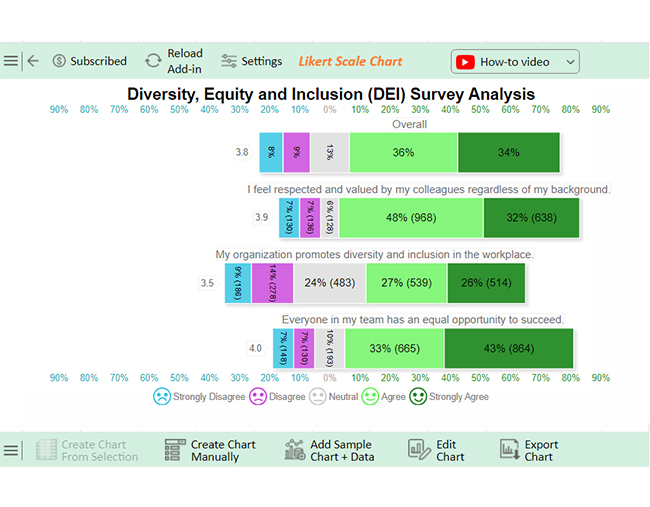
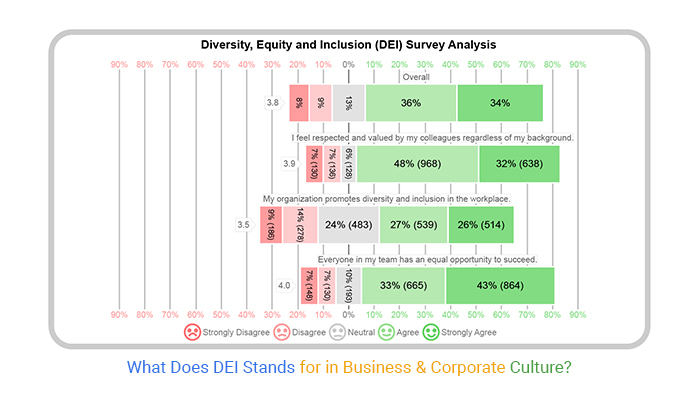
The data shows a strong overall positive sentiment, especially regarding respect, diversity, and equal opportunity. However, lower scores on scales 1-3 suggest some employees may still face challenges in inclusivity and equality.

What are the Advantages and Disadvantages of DEI?

Implementing Diversity, Equity, and Inclusion (DEI) initiatives can significantly impact an organization positively and negatively. Here’s a quick look at the advantages and disadvantages:

Advantages of DEI:

  • Enhanced innovation: Diverse teams bring different perspectives, leading to more creative solutions and innovative ideas.
  • Improved employee satisfaction: An inclusive environment where everyone feels valued boosts morale, employee engagement, and productivity.
  • Attracting top talent: A strong DEI culture makes your organization more appealing to top talent, helping you build a competitive workforce.

Disadvantages of DEI:

  • Resistance to change: Not everyone may be on board with DEI initiatives, leading to resistance and potential conflict within the organization.
  • Risk of tokenism: If not handled carefully, DEI efforts can result in tokenism, where diversity is superficial and doesn’t lead to meaningful change.

FAQs

What are some common DEI challenges faced by organizations?

Common DEI challenges include unconscious bias, lack of diverse leadership, and resistance to change. Inadequate training, limited resources, and inconsistent policies also hinder progress. Moreover, ensuring genuine inclusion and equal opportunities for all employees remains a persistent struggle for many organizations.

What role do leaders play in advancing DEI?

Leaders drive DEI by setting the tone and leading by example. They create inclusive policies, promote diverse hiring, and ensure accountability. By fostering an open culture and addressing biases, leaders empower teams and advance organizational DEI goals.

What are some examples of DEI metrics?

Examples of DEI metrics include diversity in hiring, employee retention rates by demographic, and representation in leadership roles. Other metrics are pay equity, employee engagement scores, and the frequency of DEI training participation. Tracking these helps measure progress.

Wrap Up

Diversity, Equity, and Inclusion (DEI) are crucial principles today. They shape how organizations create welcoming and fair environments. DEI goes beyond just policies; it fosters a culture where everyone feels valued.

Diversity means embracing differences. It’s about recognizing and appreciating each person’s unique backgrounds, perspectives, and experiences. A diverse environment is richer and more innovative.

Equity is about fairness. It ensures everyone has equal access to opportunities and resources. Equity addresses systemic barriers and seeks to level the playing field for all individuals.

Inclusion is creating spaces where everyone feels they belong. It involves actively engaging and empowering diverse individuals in decision-making processes. Inclusion is key to building a cohesive and supportive community.

DEI efforts benefit everyone. They lead to better ideas, stronger teams, and more effective organizations. When people feel respected and included, they are more motivated and productive.

In conclusion, DEI is not just a trend; it’s a necessary approach for success in any organization. By embracing diversity, equity, and inclusion, we build stronger, more innovative, and fairer communities. DEI ensures everyone has a voice and a place at the table.

How much did you enjoy this article?

GSAd1
Start Free Trial!
140799

Related articles

next previous
Data Analytics10 min read

SEO Analytics Report: Analyze, Visualize, Improve

An SEO analytics report tracks traffic, rankings, and conversions to measure success. This blog helps you create, improve, and visualize SEO reports easily.

Data Analytics10 min read

Business Management KPIs for Driving Clearer Insights

Business management KPIs track key performance areas to drive success. Click here to learn how to analyze, use, and measure them effectively and more.

Data Analytics11 min read

Business Development Plan Template: A Complete Guide

A business development plan template helps to structure your growth strategy. This blog will guide you on how to write, visualize, and download your template.

Data Analytics22 min read

80-20 Rule: The Math Is Simple. The Impact Isn’t.

80-20 rule missteps can cost growth and alignment. Are you focusing on the right 20% or missing what matters? Learn more and rethink your strategy today!

Data Analytics8 min read

Benchmarking Dashboard: Tips for Better Insights

This guide dives deep into what benchmarking dashboards are. The guide also reveals easy ways and steps to create a benchmarking dashboard in Power BI.

ChartExpo logo

Turn Data into Visual
Stories

CHARTEXPO

  • Home
  • Gallery
  • Videos
  • Services
  • Pricing
  • Contact us
  • FAQs
  • Privacy policy
  • Terms of Service
  • Sitemap

TOOLS

  • ChartExpo for Google Sheets
  • ChartExpo for Microsoft Excel
  • Power BI Custom Visuals by ChartExpo
  • Word Cloud

CATEGORIES

  • Bar Charts
  • Circle Graphs
  • Column Charts
  • Combo Charts
  • Comparison Charts
  • Line Graphs
  • PPC Charts
  • Sentiment Analysis Charts
  • Survey Charts

TOP CHARTS

  • Sankey Diagram
  • Likert Scale Chart
  • Comparison Bar Chart
  • Pareto Chart
  • Funnel Chart
  • Gauge Chart
  • Radar Chart
  • Radial Bar Chart
  • Sunburst Chart
  • see more
  • Scatter Plot Chart
  • CSAT Survey Bar Chart
  • CSAT Survey Chart
  • Dot Plot Chart
  • Double Bar Graph
  • Matrix Chart
  • Multi Axis Line Chart
  • Overlapping Bar Chart
  • Control Chart
  • Slope Chart
  • Clustered Bar Chart
  • Clustered Column Chart
  • Box and Whisker Plot
  • Tornado Chart
  • Waterfall Chart
  • Word Cloud
  • see less

RESOURCES

  • Blog
  • Resources
  • YouTube
SIGN UP FOR UPDATES

We wouldn't dream of spamming you or selling your info.

© 2025 ChartExpo, all rights reserved.