• Home
  • Tools dropdown img
    • Spreadsheet Charts

      • ChartExpo for Google Sheets
      • ChartExpo for Microsoft Excel
    • Power BI Charts

      • Power BI Custom Visuals by ChartExpo
    • Word Cloud

  • Charts dropdown img
    • Chart Category

      • Bar Charts
      • Circle Graphs
      • Column Charts
      • Combo Charts
      • Comparison Charts
      • Line Graphs
      • PPC Charts
      • Sentiment Analysis Charts
      • Survey Charts
    • Chart Type

      • Box and Whisker Plot
      • Clustered Bar Chart
      • Clustered Column Chart
      • Comparison Bar Chart
      • Control Chart
      • CSAT Survey Bar Chart
      • CSAT Survey Chart
      • Dot Plot Chart
      • Double Bar Graph
      • Funnel Chart
      • Gauge Chart
      • Likert Scale Chart
      • Matrix Chart
      • Multi Axis Line Chart
      • Overlapping Bar Chart
      • Pareto Chart
      • Radar Chart
      • Radial Bar Chart
      • Sankey Diagram
      • Scatter Plot Chart
      • Slope Chart
      • Sunburst Chart
      • Tornado Chart
      • Waterfall Chart
      • Word Cloud
    • Google Sheets
      Microsoft Excel
  • Services
  • Pricing
  • Contact us
  • Blog
  • Support dropdown img
      • Gallery
      • Videos
      • Contact us
      • FAQs
      • Resources
    • Please feel free to contact us

      atsupport@chartexpo.com

Categories
All Data Visualizations Data Analytics Surveys
Add-ons/
  • Google Sheets
  • Microsoft Excel
  • Power BI
All Data Visualizations Data Analytics Surveys
Add-ons
  • Google Sheets
  • Microsoft Excel
  • Power BI

We use cookies

This website uses cookies to provide better user experience and user's session management.
By continuing visiting this website you consent the use of these cookies.

Ok

ChartExpo Survey


Home > Blog > Microsoft Excel

Decoding Key Insights in Average Survey Response Rates

I know you want high response rates. But what is considered “average” in this fickle world of surveys?

Let me enlighten you.

Average survey response rates are like the weather. Everyone talks about them, but few know what they truly are.

Average Survey Response Rates

Imagine you send out a bunch of surveys to gather data for your groundbreaking research. You eagerly wait for the responses to pour in like a waterfall, only to be met with a trickle.

Disappointing, isn’t it? Well, my friend, you are not alone.

On average, survey response rates hover around the 10-30% mark. Yes, you heard that right. A measly 10-30%.

But don’t let that discourage you. There are ways to boost those numbers and get the responses flowing like a river. From catchy subject lines to irresistible incentives – there’s a whole arsenal of tricks at your disposal.

It’s a wild ride, but together, we can conquer this challenge and emerge victorious.

Let’s get started.

Table of Contents:

  1. What is the Average Survey Response Rate?
  2. Why Do We  Average Survey Response Rate?
  3. Benefits of Average Response Rate
  4. Deciphering Insights of Average Response Rate
  5. Wrap Up

What is the Average Survey Response Rate?

Average survey response rate is a vital metric in data collection and research. It tells us how many individuals, out of the total invited, participate in a survey. A higher average response rate for online surveys indicates a more representative dataset. Researchers, marketers, and policymakers rely on it to assess data validity and survey effectiveness. Low response rates can undermine the quality of collected information, impacting the effectiveness of your survey ideas.

Response rates measure a survey’s success in engaging its target audience. High rates lead to more reliable results and better generalizability. Low rates, on the other hand, can introduce bias and limit the findings’ applicability.

Factors like survey length, timing, incentives, and contact method impact response rates. Understanding these factors is crucial for improving response rates. Moreover, researchers aim to increase these rates through personalized outreach, clear communication, and appealing incentives.

The formula to calculate the survey response rate is as follows:

Response Rate =(Number of Completed Surveys )/(Number of Eligible Respondents)×100

Why Do We Need an Average Survey Response Rate?

Average survey response rates are essential for ensuring survey data quality, reliability, and generalizability. They have wide-reaching implications for research, policy, and decision-making across various domains.

  • Sample Representation

Average survey response rates are crucial for achieving representative samples. A high response rate means the survey includes a more comprehensive cross-section of the target population. This representation enhances the accuracy of findings and helps to draw meaningful conclusions.

  • Reliability

Response rates play a significant role in ensuring the reliability of survey data. High response rates reduce the risk of non-response bias, making the collected information more dependable and trustworthy.

  • Validity

The validity of survey results is intimately tied to response rates. When a greater segment of the population participates, the chances of acquiring accurate responses are higher. This is indispensable for researchers aiming to assess their intended variables precisely.

  • Statistical Power

Adequate response rates enhance the statistical power of a survey. Larger sample sizes help to detect smaller effects or differences, making analyses more robust and informative.

  • Generalizability

High response rates contribute to the generalizability of survey findings. The results apply to the broader population, making them more relevant for decision-making and policy formulation.

  • Cost-Efficiency

Efforts to achieve higher response rates can lead to cost savings in the long run. Obtaining a representative sample early on reduces the need for follow-up surveys or corrections due to skewed data.

  • Reduced Bias

Low response rates can introduce non-response bias. This is because those who choose not to respond may differ systematically from those who do. High response rates minimize this bias, ensuring a more accurate reflection of the population.

  • Ethical Considerations

Ethically, it’s essential to maximize response rates. Low response rates can result in underrepresenting certain groups, potentially perpetuating inequalities or hindering research on marginalized populations.

  • Survey Improvement

Monitoring response rates allows for ongoing assessment and improvement of survey design and administration. You can identify weaknesses and make necessary adjustments to enhance data collection.

  • Comparative Analysis

Comparing response rates across different surveys or study populations provides valuable insights into the effectiveness of survey methods. This allows you to learn from best practices and improve where necessary.

What are the Benefits of Average Survey Response Rate?

The benefits of a high average survey response rate are far-reaching:

  1. Accurate representation: A high average survey response rate ensures the sample closely mirrors the target population’s characteristics. This accuracy in representation allows for more reliable and trustworthy findings.
  2. Data quality: Response rates are directly linked to data quality. A higher response rate translates to complete and comprehensive data, reducing the risk of missing information. This, in turn, leads to higher data quality and fewer data errors.
  3. Enhanced confidence: You can have greater confidence in the results when response rates are high. You can trust that the data is a faithful reflection of the population. Consequently, this leads to more confident conclusions and actions based on survey findings.
  4. Effective decision-making: High response rates enable more informed and effective decision-making. The data accurately represents the views and preferences of the surveyed population, leading to better decisions.
  5. Improved survey design: Monitoring and analyzing response rates can provide valuable insights into the effectiveness of survey design and administration. You can identify improvement areas such as question-wording, survey length, or data collection methods. This continuous feedback loop leads to refinement, resulting in better surveys and higher response rates in the future.

Deciphering Insights from Average Survey Response Rate Data

Taming the data beast in Excel can sometimes feel like herding cats at a dog show.

It’s tricky but not impossible.

However, Excel has limitations in unleashing the visual storytelling power your numbers deserve. That’s where ChartExpo strides in like a caped crusader. ChartExpo tames the Excel beast, turning data into dazzling visual narratives everyone can decipher.

Benefits of Using ChartExpo

  • ChartExpo offers an impressive array of visualizations, allowing you to handpick the perfect one for your data. This means your data analysis and presentation become as smooth as a silk tie slide.
  • ChartExpo doesn’t play hard to get. Its user interface is so intuitive that creating insightful data visualizations is as easy as ordering takeout. No coding experience is required.
  • With ChartExpo, you’re the master chef of your data kitchen, customizing visuals with finesse. Tweak colors, fonts, and styles to your heart’s content, serving up visuals as unique as your thumbprint.
  • When it comes to value, ChartExpo doesn’t break the bank. It has a 7-day free trial and a pocket-friendly $10 monthly plan.

How to Install ChartExpo in Excel?

  1. Open your Excel application.
  2. Open the worksheet and click the “Insert” menu.
  3. You’ll see the “My Apps” option.
  4. In the office Add-ins window, click “Store” and search for ChartExpo on my Apps Store.
  5. Click the “Add” button to install ChartExpo in your Excel.

ChartExpo charts are available both in Google Sheets and Microsoft Excel. Please use the following CTA’s to install the tool of your choice and create beautiful visualizations in a few clicks in your favorite tool.

Example

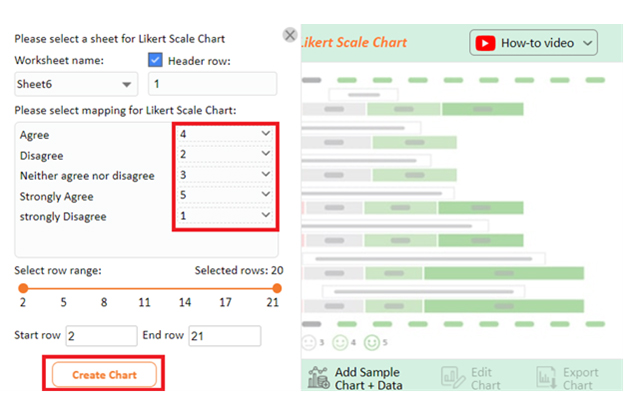
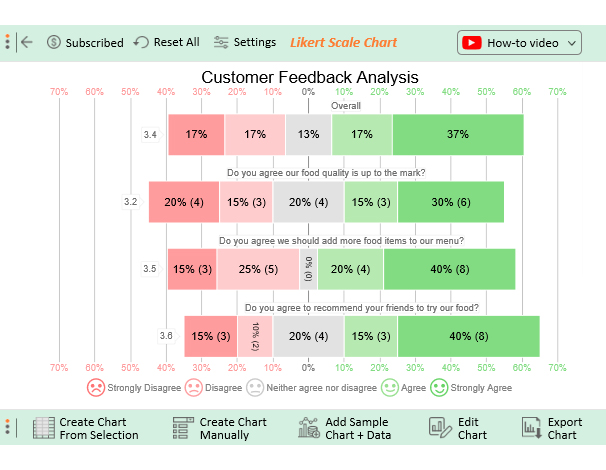
Let’s say you own a restaurant. You want to conduct a customer satisfaction survey consisting of the following questions;

  • Do you agree our food quality is up to the mark?
  • Should we add more food items to our menu?
  • Do you agree to recommend your friends to try our food?

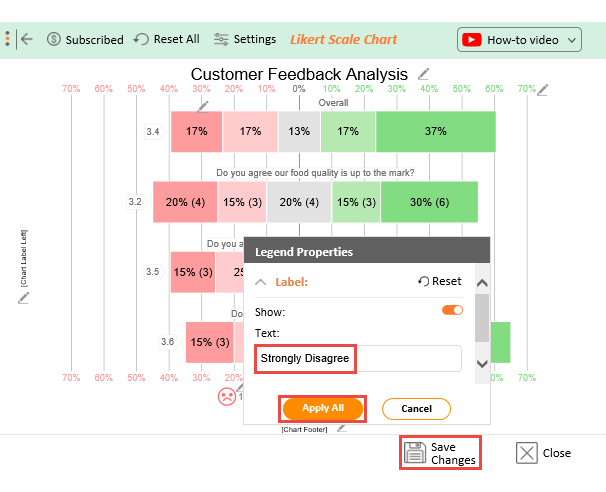
Your customers give feedback to each question using the response scale below.

  1. Strongly Disagree
  2. Disagree
  3. Neither agree nor disagree
  4. Agree
  5. Strongly Agree

Assume your survey yields the data table below.

Do you agree our food quality is up to the mark? Should we add more food items to our menu? Do you agree to recommend your friends to try our food?
Neither agree nor disagree Strongly Disagree Strongly Agree
Strongly Agree Agree Neither agree nor disagree
Neither agree nor disagree Strongly Agree Strongly Agree
Disagree Agree Neither agree nor disagree
Strongly Disagree Strongly Disagree Disagree
Agree Strongly Agree Strongly Agree
Strongly Disagree Agree Agree
Agree Disagree Neither agree nor disagree
Strongly Agree Strongly Agree Agree
Strongly Agree Strongly Agree Strongly Agree
Neither agree nor disagree Disagree Strongly Disagree
Strongly Agree Strongly Disagree Strongly Agree
Strongly Disagree Disagree Neither agree nor disagree
Strongly Agree Strongly Agree Strongly Agree
Agree Agree Agree
Neither agree nor disagree Disagree Strongly Disagree
Strongly Agree Strongly Agree Strongly Agree
Disagree Strongly Agree Strongly Agree
Strongly Disagree Strongly Agree Disagree
Disagree Disagree Strongly Disagree

This table contains example data. Expect many responses and questions in real life.

  • To get started with ChartExpo, install ChartExpo in Excel.
  • Now Click on My Apps from the INSERT menu.
insert chartexpo in excel
  • Choose ChartExpo from My Apps, then click Insert.
open chartexpo in excel
  • Once it loads, choose the “Likert Scale Chart” from the charts list.
search likert scale chart in excel
  • Click the “Create Chart From Selection” button after selecting the data from the sheet, as shown.
Create Chart From Selection ce456
  • When you click the “Create Chart From Selection” button, you have to map responses with numbers manually. The Likert scale has this arrangement:
    • Strongly Disagree=1
    • Disagree=2
    • Neither agree nor disagree=3
    • Agree=4
    • Strongly Agree=5
  • Once all is set, click the “Create Chart” button.
Free Survey Platforms Design Template
  • ChartExpo will generate the visualization below for you.
Average Survey Response Rates Template Design
  • If you want to have the chart’s title, click Edit Chart, as shown in the above image.
  • Click the pencil icon next to the Chart Header to change the title.
  • It will open the properties dialog. Under the Text section, you can add a heading in Line 1 and enable Show.
  • Give the appropriate title of your chart and click the Apply button.
Apply Tittle on Chart ce456
  • Let’s say you want to add text responses instead of numbers against every emoji.
  • Click the pencil icon next to the respective emoji. Expand the “Label” properties and write the required text. Then click the “Apply All” button.
  • Click the “Save Changes” button to persist the changes.
Apply Label on Chat ce456
  • Your final chart will appear below.
Final Average Survey Response Rates

Insights

  • 55% of customers agree to recommend your food to their friends, while 25% do not agree, and 20% remain neutral.
  • When asked about adding more food items to the menu, 60% of customers desire this change, while 40% do not agree.
  • Regarding the food quality, 45% agree your food is of good quality, 35% do not agree, and 20% are neutral.
  • Overall, 54% of respondents gave positive feedback, 34% gave negative feedback, and 13% remained neutral.

FAQs

What is considered a good response rate for a survey?

Typically, a good survey response rate is above 30%. However, it can vary depending on the survey’s purpose, audience, and distribution method. A higher response rate usually yields more reliable data.

How do you average survey responses?

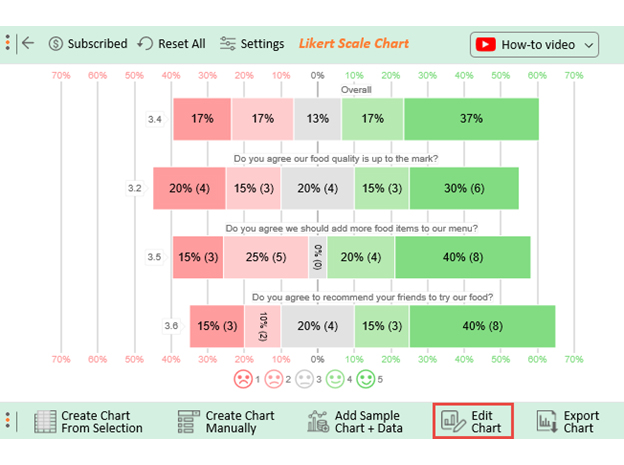
Add all the individual responses for a specific question and divide the total by the number of respondents. This calculation provides that particular survey question’s average or mean value.

What is the Standard Response Rate for Surveys?

A standard response rate for surveys varies by industry and context but often falls between 20% and 30%. However, a higher response rate is generally preferred for more accurate and representative data.

Wrap Up

In today’s data-driven landscape, where information is king, understanding and optimizing average survey response rates is key. It unlocks the doors of knowledge, ensuring the data truly mirrors the reality we seek to understand.

Adequate response rates ensure an accurate representation of the target population, bolstering the validity and reliability of survey results. This, in turn, builds confidence in the data, enabling effective decision-making.

Moreover, response rates have far-reaching implications, from improving survey design to minimizing bias and enhancing ethical considerations. They form the foundation upon which robust research and informed choices stand.

On the flip side, low response rates can jeopardize the validity and generalizability of survey results. They may lead to incomplete datasets, skewed perspectives, and missed opportunities for valuable insights.

Average survey response rates, while a seemingly simple metric, underpins the entire survey process’s success. ChartExpo, with its versatile visualization options, streamlines the process of comprehending this critical metric. It offers insightful visualizations, empowering you to transform complex survey response rate data into clear, engaging narratives.

Don’t let your data sit in the corner – Join the ChartExpo movement and bring it to life.

How much did you enjoy this article?

ExcelAd2
Start Free Trial!
130318

Related articles

next previous
Microsoft Excel12 min read

Artificial Intelligence in Excel for Clear Insights

Discover how AI elevates Excel, from automation to advanced data analysis. This blog covers benefits, limitations, and examples to enhance your productivity.

Microsoft Excel8 min read

Excel Task Tracker Template for Smarter Task Insights

Task tracker template in Excel organizes tasks, tracks deadlines, and boosts efficiency. Learn its benefits, and explore expert tips to simplify task management.

Microsoft Excel10 min read

Invoice Tracker Template in Excel for Better Insights

An invoice tracker Excel template helps track invoices, due dates, and payments. Learn how to use this template for better financial management.

Microsoft Excel12 min read

Key Performance Indicators in Healthcare for Better Insights

Key Performance Indicators in healthcare track patient care and efficiency. Learn about these KPIs, top examples, and how to use them to improve outcomes.

Microsoft Excel10 min read

BMI Calculation Formula in Excel for Better Fitness Insights

The BMI calculation formula in Excel helps track and analyze body mass index. Explore step-by-step instructions and tips to simplify BMI tracking in Excel.

ChartExpo logo

Turn Data into Visual
Stories

CHARTEXPO

  • Home
  • Gallery
  • Videos
  • Services
  • Pricing
  • Contact us
  • FAQs
  • Privacy policy
  • Terms of Service
  • Sitemap

TOOLS

  • ChartExpo for Google Sheets
  • ChartExpo for Microsoft Excel
  • Power BI Custom Visuals by ChartExpo
  • Word Cloud

CATEGORIES

  • Bar Charts
  • Circle Graphs
  • Column Charts
  • Combo Charts
  • Comparison Charts
  • Line Graphs
  • PPC Charts
  • Sentiment Analysis Charts
  • Survey Charts

TOP CHARTS

  • Sankey Diagram
  • Likert Scale Chart
  • Comparison Bar Chart
  • Pareto Chart
  • Funnel Chart
  • Gauge Chart
  • Radar Chart
  • Radial Bar Chart
  • Sunburst Chart
  • see more
  • Scatter Plot Chart
  • CSAT Survey Bar Chart
  • CSAT Survey Chart
  • Dot Plot Chart
  • Double Bar Graph
  • Matrix Chart
  • Multi Axis Line Chart
  • Overlapping Bar Chart
  • Control Chart
  • Slope Chart
  • Clustered Bar Chart
  • Clustered Column Chart
  • Box and Whisker Plot
  • Tornado Chart
  • Waterfall Chart
  • Word Cloud
  • see less

RESOURCES

  • Blog
  • Resources
  • YouTube
SIGN UP FOR UPDATES

We wouldn't dream of spamming you or selling your info.

© 2025 ChartExpo, all rights reserved.