

A running total means the cumulative sum of values over time. It continuously adds each new entry to the previous total, helping track growth, progress, or changes in data.
Categories
What is a running total in Excel?
If you’ve worked with data, you’ve likely encountered moments when you needed to track cumulative numbers. Such numbers include daily sales, expenses, or performance metrics. This feature in Excel helps you add values progressively, providing clear insights into how they build over time.
Businesses worldwide depend on Excel for data management, with over 750 million users worldwide. The ability to analyze trends is critical in both small startups and global corporations. A running total Excel transforms raw data into meaningful insights, helping you easily spot patterns and monitor progress.


Imagine tracking monthly sales. Instead of calculating totals manually for each new entry, Excel does the heavy lifting for you. For instance, global e-commerce sales grew by over 14% in 2022. Keeping up such numbers requires efficient and reliable tools, and running totals are essential to this process.
Running Total Excel is easy to learn and apply, no matter the size or complexity of your dataset. Once you understand it, you can easily transform how you work with data. You can track progress, identify trends, and present information clearly while keeping your processes efficient.
Are you ready to make your data work smarter for you?
First…
Definition: A running total in Excel is the cumulative sum of values added sequentially. It shows how data builds over time, row by row.
This feature enables you to track progress, conduct trend analysis in Excel, and monitor changes within your dataset. Businesses often leverage running totals to measure sales growth or expense accumulation effectively.
Running Totals in Excel are easy to create using formulas or built-in tools. They provide a clear overview of cumulative performance, making them essential for data analysis and decision-making.
A cumulative sum in Excel adds values over time, turning raw data into clear insights. It helps you track progress, analyze trends, and present information design effectively. Let’s explore why this feature matters:
A running total in Excel is a game-changer for organizing and understanding data. It gives you a live, cumulative view of your numbers, making tracking progress and spotting trends easier. Let’s see how this feature can make your work smarter:
How to do a running total in Excel?
There are several ways to calculate a cumulative sum in Excel. Below are three of the most common methods explained with simple steps:
There are several ways to calculate a running total in Excel. The ideal one depends on your data structure and the version of Excel you’re using. Here is the most common formula:
=SUM($A$1:A1)
Here’s how it functions:
Want to track numbers that grow as you go? Calculating a running total in Excel is the way to do it. It’s quick, easy, and works perfectly for everything from tracking sales to monitoring expenses. Let’s break it down into three simple steps.
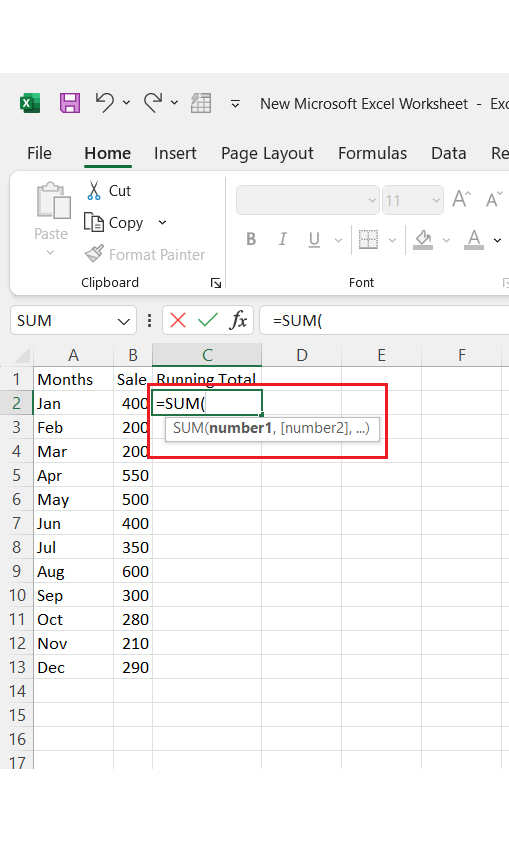
First, open your Excel sheet with the dataset you want to use. Then, type the formula =SUM. This directs Excel that you want to add numbers together.
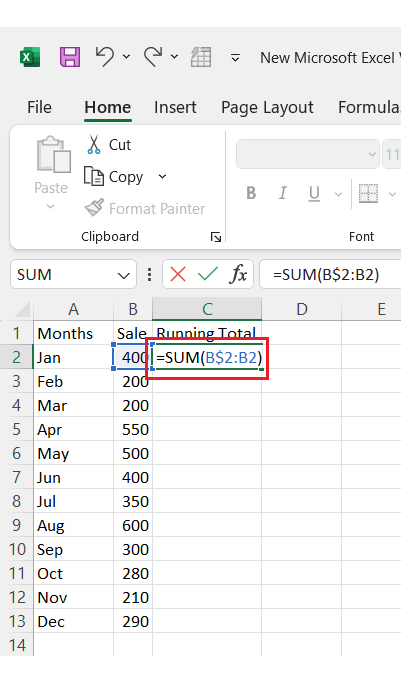
In the first cell of your running total column, reference the first value directly (e.g., =B2). In the second cell, build your running total formula. Use =SUM($B$2:B2) to include all rows from the first to the current row. The dollar sign locks the starting cell, ensuring the sum always begins there.
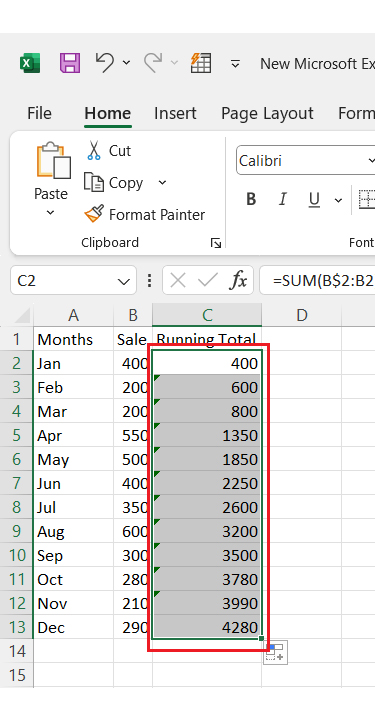
Drag the formula down the column. Excel will calculate the cumulative total for each row automatically. Watch your data come to life as totals grow with each entry.
Want to turn your data into a story? A cumulative graph in Excel can do just that. It’s the perfect way to visualize progress, trends, or growth over time.
Yet, Excel’s built-in chart tools often fall flat. They lack the finesse to create visually stunning, clear graphs that grab attention.
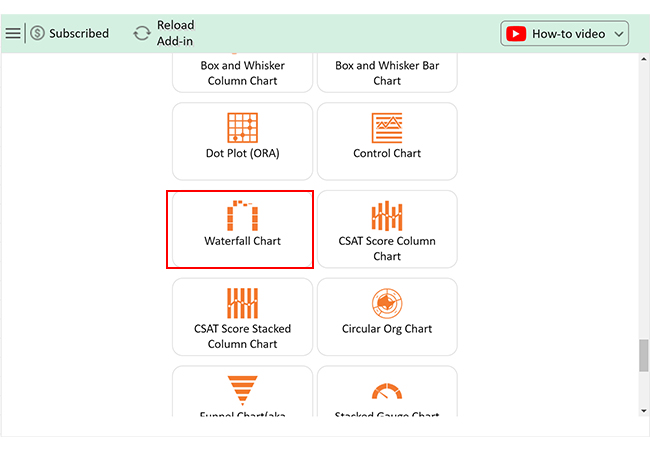
Enter ChartExpo, a game-changer for creating powerful, eye-catching visuals for analyzing running total Excel templates. It bridges the gap where Excel falls short, making your data compelling and easy to understand.
Here are the top 5 charts we can use to visualize the running total Excel templates using ChartExpo:
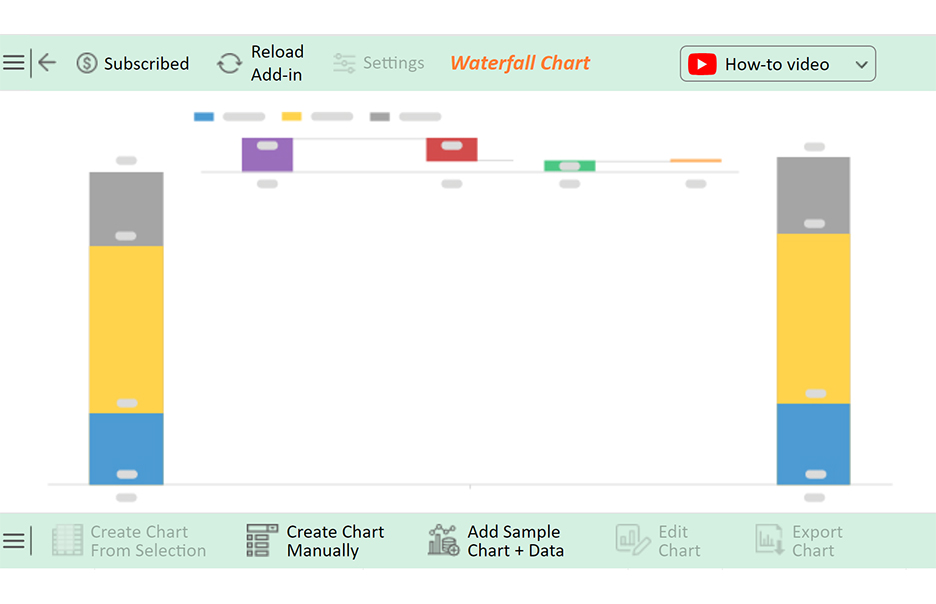
Let’s learn how to install ChartExpo in Excel.
ChartExpo charts are available both in Google Sheets and Microsoft Excel. Please use the following CTAs to install the tool of your choice and create beautiful visualizations with a few clicks in your favorite tool.


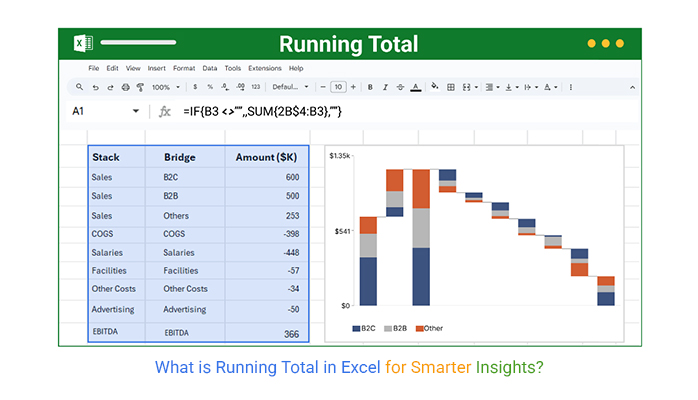
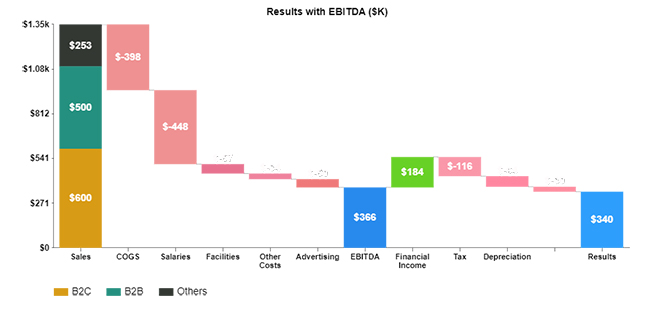
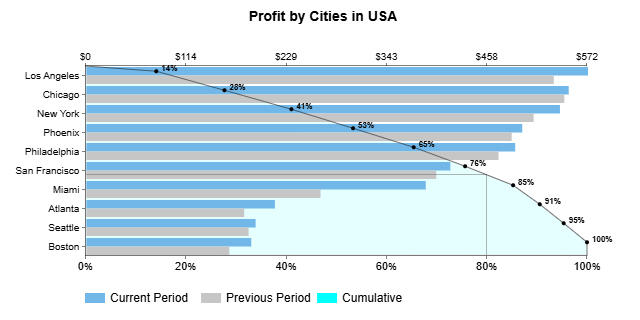
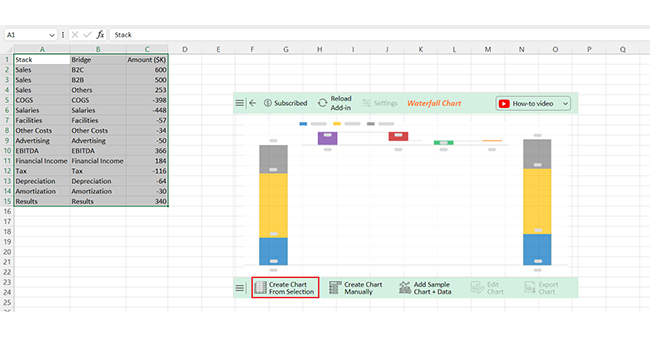
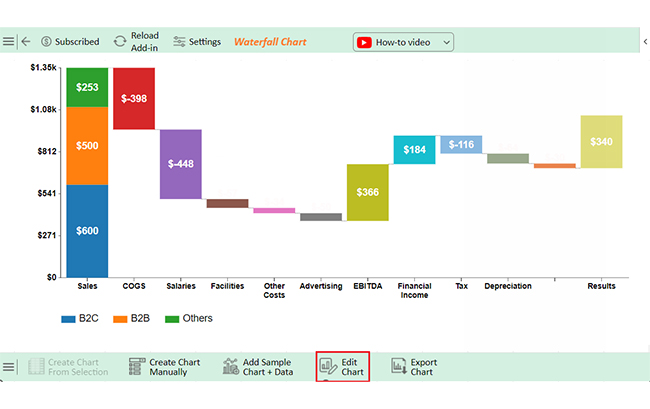
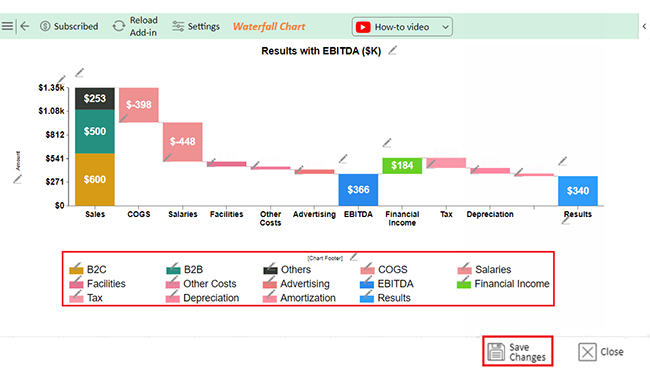
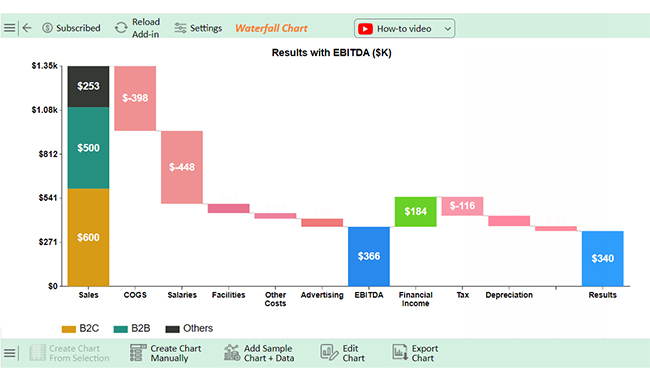
Let’s dive into analyzing and interpreting data in this sample set using ChartExpo in Excel.
| Stack | Bridge | Amount ($K) |
| Sales | B2C | 600 |
| Sales | B2B | 500 |
| Sales | Others | 253 |
| COGS | COGS | -398 |
| Salaries | Salaries | -448 |
| Facilities | Facilities | -57 |
| Other Costs | Other Costs | -34 |
| Advertising | Advertising | -50 |
| EBITDA | EBITDA | 366 |
| Financial Income | Financial Income | 184 |
| Tax | Tax | -116 |
| Depreciation | Depreciation | -64 |
| Amortization | Amortization | -30 |
| Results | Results | 340 |


Make sure your formula locks the starting cell with $ (e.g., $B$2) to avoid errors when copying down.
Running totals may break if the source column has empty cells or text values. Use functions like IFERROR to handle them.
Check calculation mode (Formulas > Calculation Options) and set it to Automatic.
Verify that the selected range includes all rows you want in the running total, especially when new data is added.
A sum calculates the total of selected values and shows a single result. Conversely, a running total continuously adds values row by row, displaying a cumulative total. It tracks the progressive addition of data.
To create a running total across sheets, use a formula like =SUM(Sheet1!A1, Sheet2!A1) and extend it row by row. Update the cell references for each sheet and link data consistently to avoid errors.
An Excel running total is a simple yet powerful tool. It helps track cumulative values over time. Whether analyzing trends or monitoring progress, it provides clarity.
Businesses use this feature to monitor sales and expenses, and project managers track milestones and tasks. It’s versatile and easy to apply.
Creating a running total requires basic formulas. Excel’s built-in tools, like Tables or Pivot Tables, simplify the process, and dynamic arrays offer even more flexibility.
Excel running totals save time and reduce errors. They eliminate repetitive calculations and make data analysis more efficient. Moreover, visualizing running totals enhances understanding. Charts and graphs make trends clear, aiding in better decision-making.
Mastering this function unlocks Excel’s potential. It’s a must-have skill for professionals and students. Running totals turn data into insights.
How much did you enjoy this article?


Learn how to use sparklines in Excel to quickly visualize trends inside cells. Discover types, creation steps, customization, use cases, benefits, and best practices.

Learn what a confidence interval graph is, how to create it in Excel, and how to interpret results to make more reliable, data-driven decisions.

A correlation matrix in Excel helps identify relationships between variables. Learn how to create, read, and use it for effective data analysis.


