• Home
  • Tools dropdown img
    • Spreadsheet Charts

      • ChartExpo for Google Sheets
      • ChartExpo for Microsoft Excel
    • Power BI Charts

      • Power BI Custom Visuals by ChartExpo
    • Word Cloud

  • Charts dropdown img
    • Chart Category

      • Bar Charts
      • Circle Graphs
      • Column Charts
      • Combo Charts
      • Comparison Charts
      • Line Graphs
      • PPC Charts
      • Sentiment Analysis Charts
      • Survey Charts
    • Chart Type

      • Box and Whisker Plot
      • Clustered Bar Chart
      • Clustered Column Chart
      • Comparison Bar Chart
      • Control Chart
      • CSAT Survey Bar Chart
      • CSAT Survey Chart
      • Dot Plot Chart
      • Double Bar Graph
      • Funnel Chart
      • Gauge Chart
      • Likert Scale Chart
      • Matrix Chart
      • Multi Axis Line Chart
      • Overlapping Bar Chart
      • Pareto Chart
      • Radar Chart
      • Radial Bar Chart
      • Sankey Diagram
      • Scatter Plot Chart
      • Slope Chart
      • Sunburst Chart
      • Tornado Chart
      • Waterfall Chart
      • Word Cloud
    • Google Sheets
      Microsoft Excel
  • Services
  • Pricing
  • Contact us
  • Blog
  • Support dropdown img
      • Gallery
      • Videos
      • Contact us
      • FAQs
      • Resources
    • Please feel free to contact us

      atsupport@chartexpo.com

Categories
All Data Visualizations Data Analytics Surveys
Add-ons/
  • Google Sheets
  • Microsoft Excel
  • Power BI
All Data Visualizations Data Analytics Surveys
Add-ons
  • Google Sheets
  • Microsoft Excel
  • Power BI

We use cookies

This website uses cookies to provide better user experience and user's session management.
By continuing visiting this website you consent the use of these cookies.

Ok

ChartExpo Survey


Home > Blog > Microsoft Excel

What Does Microsoft Office 365 Include in Its Tools?

What does Microsoft Office 365 include?

Have you ever wondered what’s in this subscription service? You’re not alone. Microsoft Office 365 has become an essential tool for millions of businesses and individuals worldwide. Over 1.2 billion people use Office apps, making it one of the most popular productivity suites available today.

What does Microsoft Office 365 include? It offers more than just the classic Word, Excel, and PowerPoint. The service provides access to cloud storage, collaboration tools, and advanced security features.

What Does Microsoft Office 365 Include

Office 365 combines essential software with services that allow you to work from anywhere, anytime. With features like OneDrive for file storage and Microsoft Teams for communication, you have everything you need in one package.

Whether collaborating on a project, creating documents, or analyzing data, Microsoft Office 365 covers it all. The subscription model ensures you’re always updated with the latest features and updates.

So, let’s explore what Microsoft Office 365 includes in detail. This comprehensive suite is designed to simplify tasks and boost productivity, all while supporting flexibility and collaboration across devices.

Table of Contents:

  1. What is Microsoft Office 365?
  2. Why Use Microsoft Office 365?
  3. What Does Microsoft Office 365 Include?
  4. How to Use Microsoft Excel 365 to Visualize Data?
  5. Wrap Up

First…

What is Microsoft Office 365?

Definition: Microsoft Office 365 is a cloud-based subscription service that includes essential apps like Word, Excel, PowerPoint, and Outlook. With Office 365, you can access these tools from any device with an internet connection. It also offers OneDrive for cloud storage and Teams for seamless collaboration. Additionally, Office 365 allows you to easily integrate and share data, such as inserting an Excel graph into PowerPoint for enhanced data presentations.

The subscription ensures you have the latest updates and features. Office 365 is widely used by businesses, students, and individuals for productivity and communication. Overall, it makes working from anywhere easier and more efficient.

Why Use Microsoft Office 365?

Microsoft Office makes work easier. With Office 365, you can access your files and apps anywhere on any device. Regardless of whether you’re working from home, on the go, or in the office, everything you need is available:

  • Access anywhere, anytime: With Office 365, your apps and files are always with you. You can access everything from any device if you’re at home, in the office, or on the go.
  • Collaboration features: Office 365 enhances working together in real-time. You can share documents, chat in Microsoft Teams, and hold virtual meetings. It makes teamwork smoother and more efficient.
  • Regular updates: Forget about manual updates or waiting for the next release. Office 365 automatically updates the latest features and security patches up to date.
  • Cost-effective for businesses: Office 365 offers flexible pricing plans. Businesses can scale as needed, paying only for the licenses they need. It’s an affordable way to get powerful software and a cloud-based data warehouse.
  • Improved security: Office 365 comes with built-in security features like data encryption and multi-factor authentication. This helps to keep your data safe and secure.

What Does Microsoft Office 365 Include?

It’s more than just Word, Excel, and PowerPoint. Office 365 is packed with a variety of apps and features that help you work smarter:

  • Access to Microsoft 365 apps: Of course, you get the core apps—Word, Excel, PowerPoint, Outlook, and more. These are the tools you rely on daily. But with Office 365, they’re always up to date and ready to use on any device.
  • Other features included in Microsoft 365: It includes tools for email, calendar management, and document editing, all synchronized and connected across platforms. You can seamlessly switch from your desktop to your phone without missing a beat.
  • OneDrive: It lets you save files online, access them from anywhere, and share them with others. OneDrive ensures you do not lose a document, even if you forget your laptop.
  • Microsoft Teams: You can chat, hold meetings, share files, and collaborate concurrently. Whether you’re working in a team or hosting a virtual meeting, Teams keeps everything organized in one place.
  • SharePoint: This tool is perfect for sharing files across teams and working on documents together. You can create internal websites and keep everyone connected, no matter where they are.

How to Use Microsoft Excel 365 to Visualize Data?

Have you ever wondered what Microsoft Office 365 includes? In addition to the usual suspects like Word and Excel, it packs a punch with tools that boost productivity.

Excel is great for number crunching but with data visualization? It’s like using a butter knife to carve a turkey.

Enter ChartExpo—your secret weapon to turn those boring spreadsheets into stunning, easy-to-understand visuals. With ChartExpo, you can break free from Excel’s limitations and make data analysis a breeze!

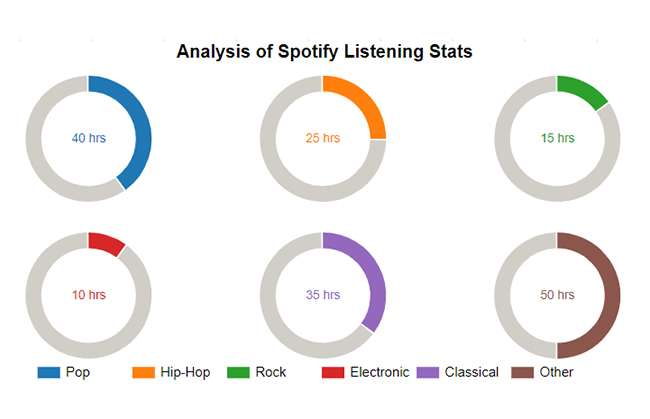
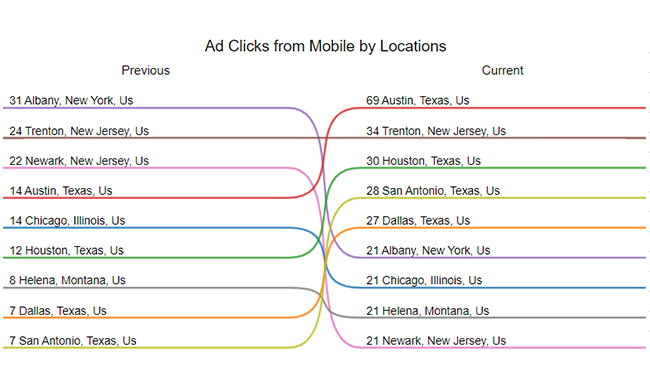
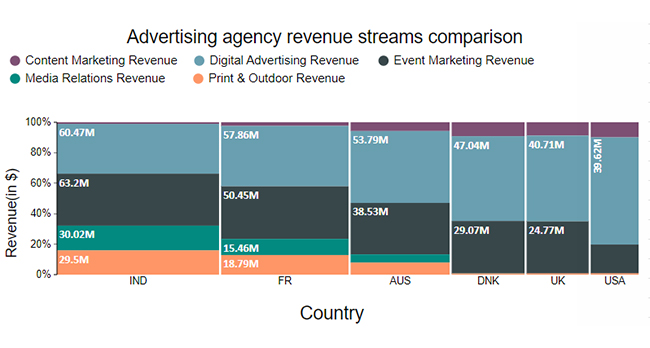
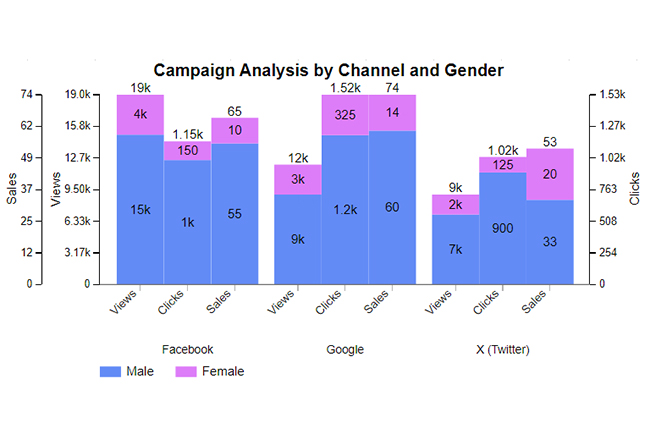
Here are some of the top types of charts and graphs created in Excel using ChartExpo, showcasing the versatility and power of visualization:

Progress Circle Chart

Progress Circle Chart After Learning What Does Microsoft Office 365 Include

Slope Chart

Slope Chart After Learning What Does Microsoft Office 365 Include

Mosaic Plot

Mosaic Plot After Learning What Does Microsoft Office 365 Include

Clustered Stacked Bar Chart

Clustered Stacked Bar Chart After Learning What Does Microsoft Office 365 Include

Multi Axis Line Chart

Multi Axis Line Chart After Learning What Does Microsoft Office 365 Include

Example

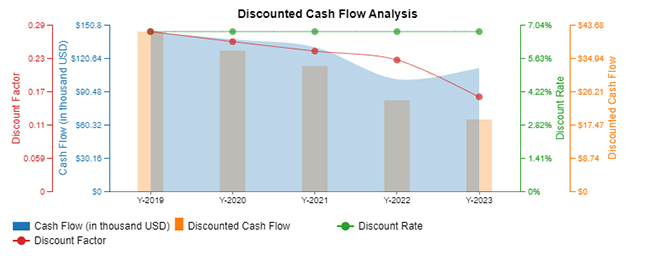
Let’s analyze this sample data in Excel using ChartExpo.

Period Cash Flow (in thousand USD) Discount Rate Discount Factor Discounted Cash Flow
Y-2019 145 6.77 0.288 42
Y-2020 138 6.77 0.27 37
Y-2021 131 6.77 0.253 33
Y-2022 102 6.77 0.237 24
Y-2023 112 6.77 0.171 19

Let’s learn how to install ChartExpo in Excel.

  • Open your Excel application.
  • Open the worksheet and click the “Insert” menu.
  • You’ll see the “My Apps” option.
  • In the Office Add-ins window, click “Store” and search for ChartExpo on my Apps Store.
  • Click the “Add” button to install ChartExpo in your Excel.

ChartExpo charts are available both in Google Sheets and Microsoft Excel. Please use the following CTAs to install the tool of your choice and create beautiful visualizations with a few clicks in your favorite tool.

  • To get started with ChartExpo, install ChartExpo in Excel.
  • Now Click on My Apps from the INSERT menu.
insert chartexpo in excel
  • Choose ChartExpo from My Apps, then click Insert.
open chartexpo in excel
  • Once it loads, scroll through the charts list to locate and choose the “Multi Axis Line Chart”.
search multi axis line chart in excel
  • After clicking on the chart, you will see the Multi Axis Line Chart on the screen.
Multi Axis Line Chart Page on Screen After Learning What Does Microsoft Office 365 Include
  • Click the “Create Chart From Selection” button after selecting the data from the sheet, as shown.
Click Create Chart From Selection After Learning What Does Microsoft Office 365 Include
  • ChartExpo will generate the visualization below for you.
Initial Visual After Learning What Does Microsoft Office 365 Include
  • Click on Settings and change the “Data Representation” as follows.
Change Data Representation After Learning What Does Microsoft Office 365 Include
  • If you want to add anything to the chart, click the Edit Chart button:
Click Edit Chart Button After Learning What Does Microsoft Office 365 Include
  • Click the pencil icon next to the Chart Header to change the title.
  • It will open the properties dialog. Under the Text section, you can add a heading in Line 1 and enable Show.
  • Give the appropriate title of your chart and click the Apply button.
Add Chart Header After Learning What Does Microsoft Office 365 Include
  • You can add the dollar sign with discounted cash flow value as follows:
Add Prefix with Discounted Cash Flow After Learning What Does Microsoft Office 365 Include
  • You can add the percentage sign with “Discounted Rate” values as follows:
Add Percentage SIgn with Discounted Rate After Learning What Does Microsoft Office 365 Include
  • You can add the dollar sign with “Cash Flow” values as follows:
Add Prefix with Cash Flow After Learning What Does Microsoft Office 365 Include
  • First, you can enable the Legend Show button as follows:
Enable Legend Show Button After Learning What Does Microsoft Office 365 Include
  • Change the Legend shape of “Discounted Cash Flow” to Column and click the “Apply” button.
Change Legend Shape of Discounted Cash Flow After Learning What Does Microsoft Office 365 Include
  • Change the Legend shape of “Discount Rate” into a Line and Circle and click the “Apply” button.
Change Legend Shape of Discounted Rate After Learning What Does Microsoft Office 365 Include
  • Change the Legend shape of “Discount Factor” into a Line and Circle and click the “Apply” button.
Change Legend Shape of Discount Factor After Learning What Does Microsoft Office 365 Include
  • Click the “Save Changes” button to persist the changes made to the chart.
Click Save Changes After Learning What Does Microsoft Office 365 Include
  • Your final Multi Axis Line Chart will look like the one below.
Final What Does Microsoft Office 365 Include

Insights

  • Cash flows declined from 2019 to 2021.
  • A slight recovery in cash flows occurred in 2022-2023.
  • Discounted cash flows decreased steadily over time.
  • The consistent discount rate of 6.77% contributed to the time value erosion.

Uncover Relationships in Microsoft Office 365 Include Using Multi Axis Line Chart in Microsoft Excel:

  1. Open your Excel Application.
  2. Install ChartExpo Add-in for Excel from Microsoft AppSource to create interactive visualizations.
  3. Select the Multi-Axis Line Chart from the list of charts.
  4. Select your data.
  5. Click on the “Create Chart from Selection” button.
  6. Customize your chart properties to add header, axis, legends, and other required information.

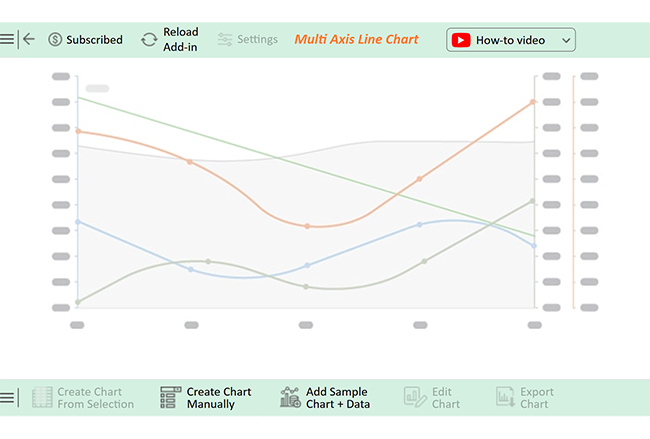
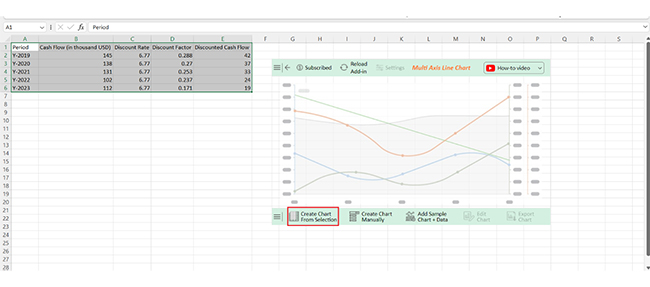
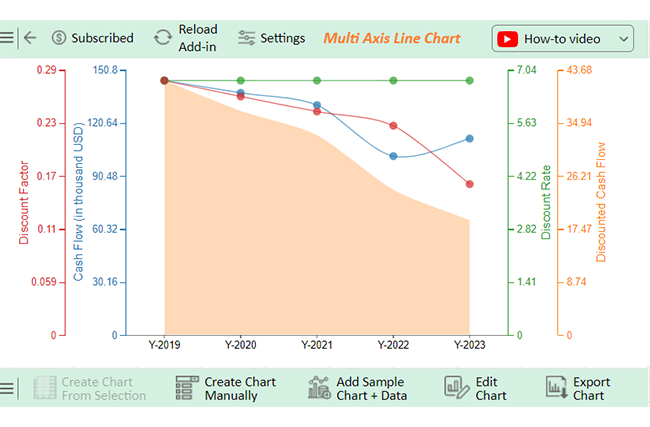
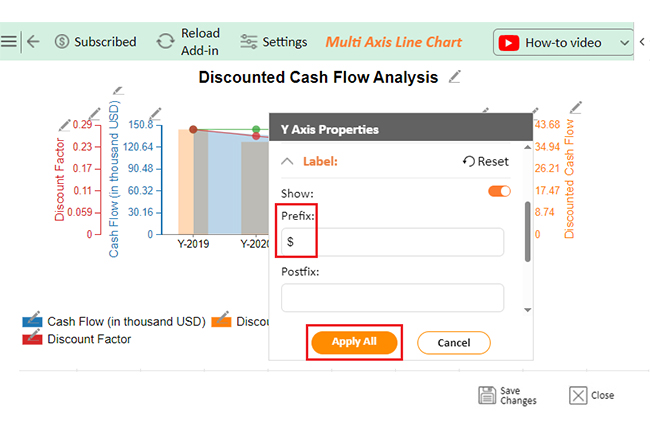
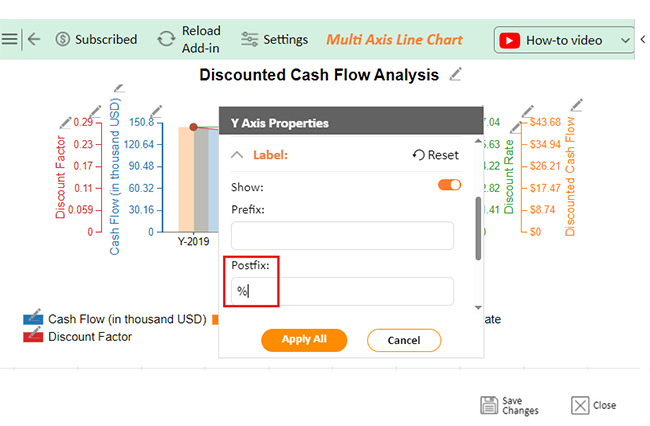
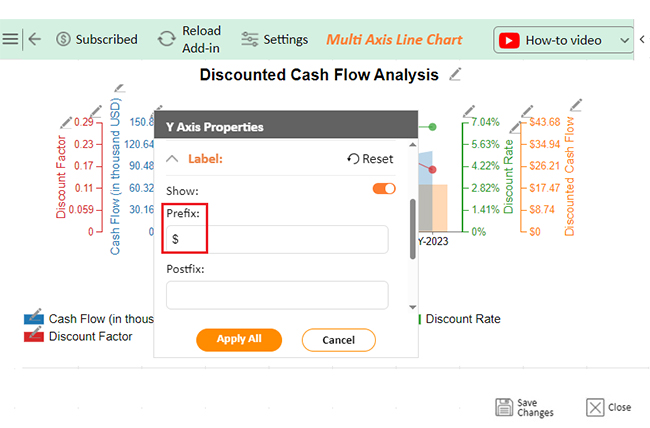
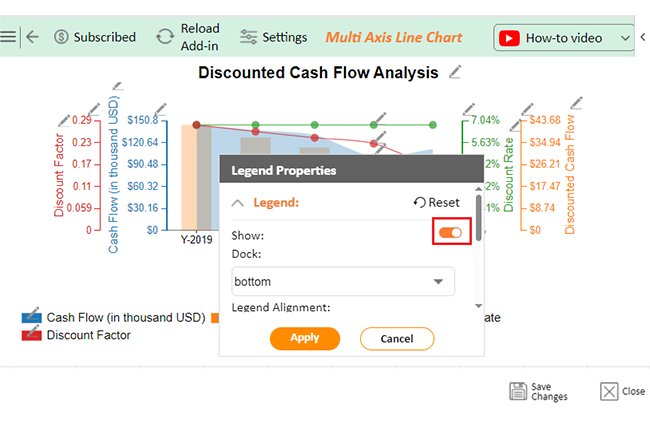
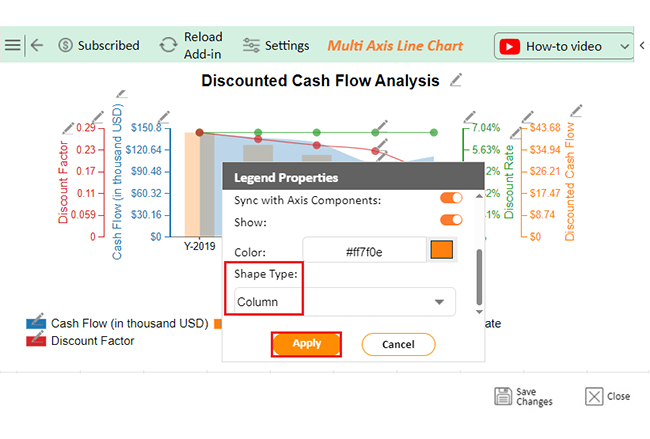
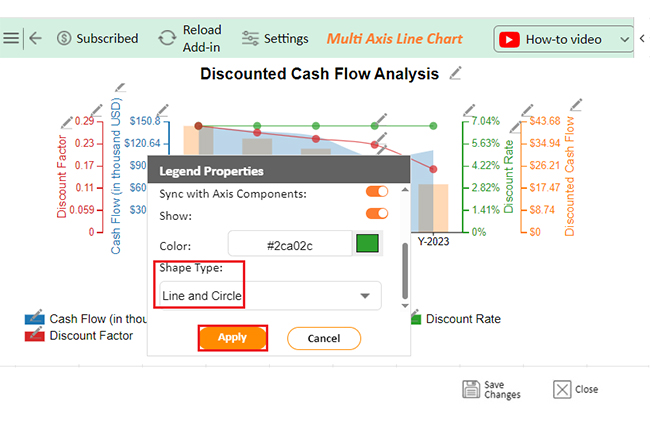
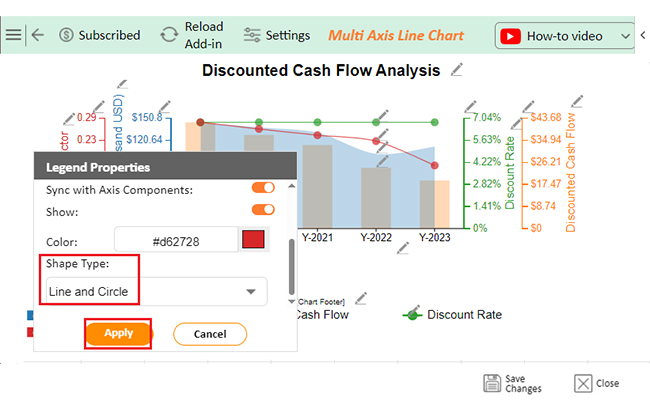
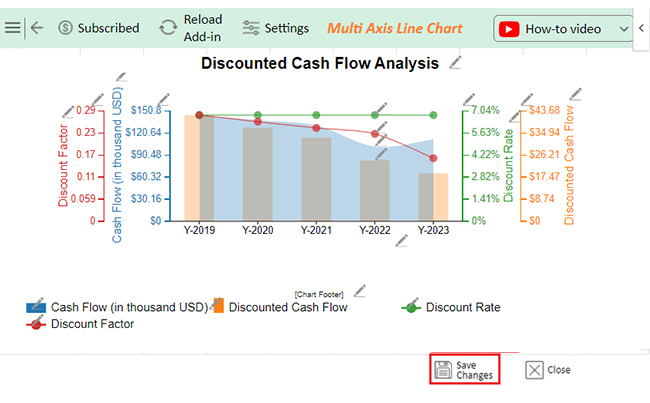
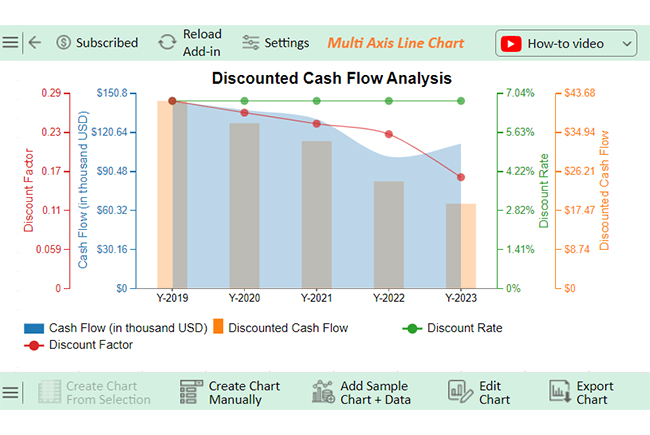
The following video will help you create a Multi-Axis Line Chart in Microsoft Excel.

FAQs

Does Microsoft 365 Basic include Word and Excel?

Microsoft 365 provides web-based versions of these apps. You can access them through a browser, but they lack some advanced features that are available in the desktop versions.

Is Microsoft 365 Office free?

Microsoft 365 requires a subscription to access its full features. However, it offers a limited free version of Office apps like Word and Excel, available online.

What is the difference between Microsoft 365 and Office 365?

Microsoft 365 includes Office apps, cloud storage, and additional tools like security features. Office 365 focuses mainly on Office apps and collaboration tools. Microsoft 365 offers a broader suite, including Windows, while Office 365 centers on productivity software.

Wrap Up

Microsoft Office 365 is a powerful tool designed to boost productivity and collaboration. It includes core applications like Word, Excel, PowerPoint, and Outlook. These are the essential tools for creating documents, spreadsheets, presentations, and managing emails.

It offers cloud-based services through OneDrive and Teams. OneDrive allows you to store files securely in the cloud and access them anywhere. Teams provide a platform for communication, collaboration, and meetings.

Office 365 includes an exchange for email hosting and SharePoint for document management and team collaboration. These services help to streamline workflows and stay connected. Moreover, Office 365 offers more advanced features and premium plans with additional tools, such as advanced security and compliance features.

With regular updates, Office 365 ensures you have the latest versions of its apps and features. This keeps your business and personal productivity up to date.

Do not hesitate.

Start using Office 365 with ChartExpo. This all-in-one productivity solution meets the needs of individuals and organizations alike.

How much did you enjoy this article?

ExcelAd2
Start Free Trial!
144675

Related articles

next previous
Microsoft Excel10 min read

Invoice Tracker Template in Excel for Better Insights

An invoice tracker Excel template helps track invoices, due dates, and payments. Learn how to use this template for better financial management.

Microsoft Excel12 min read

Key Performance Indicators in Healthcare for Better Insights

Key Performance Indicators in healthcare track patient care and efficiency. Learn about these KPIs, top examples, and how to use them to improve outcomes.

Microsoft Excel10 min read

BMI Calculation Formula in Excel for Better Fitness Insights

The BMI calculation formula in Excel helps track and analyze body mass index. Explore step-by-step instructions and tips to simplify BMI tracking in Excel.

Microsoft Excel29 min read

How to Create a Tornado Chart in Excel? A Complete Guide

Click to learn how to plot a Tornado Chart in Excel using easy-to-follow steps. Also, we’ll address the following question: what is a Tornado Diagram?

Microsoft Excel14 min read

How to Create a Scatter Plot in Excel with 3 Variables?

Click to discover how to create a Scatter Plot in Excel with 3 variables. We’ll also address the following question: why do we use Scatter Plot Graph?

ChartExpo logo

Turn Data into Visual
Stories

CHARTEXPO

  • Home
  • Gallery
  • Videos
  • Services
  • Pricing
  • Contact us
  • FAQs
  • Privacy policy
  • Terms of Service
  • Sitemap

TOOLS

  • ChartExpo for Google Sheets
  • ChartExpo for Microsoft Excel
  • Power BI Custom Visuals by ChartExpo
  • Word Cloud

CATEGORIES

  • Bar Charts
  • Circle Graphs
  • Column Charts
  • Combo Charts
  • Comparison Charts
  • Line Graphs
  • PPC Charts
  • Sentiment Analysis Charts
  • Survey Charts

TOP CHARTS

  • Sankey Diagram
  • Likert Scale Chart
  • Comparison Bar Chart
  • Pareto Chart
  • Funnel Chart
  • Gauge Chart
  • Radar Chart
  • Radial Bar Chart
  • Sunburst Chart
  • see more
  • Scatter Plot Chart
  • CSAT Survey Bar Chart
  • CSAT Survey Chart
  • Dot Plot Chart
  • Double Bar Graph
  • Matrix Chart
  • Multi Axis Line Chart
  • Overlapping Bar Chart
  • Control Chart
  • Slope Chart
  • Clustered Bar Chart
  • Clustered Column Chart
  • Box and Whisker Plot
  • Tornado Chart
  • Waterfall Chart
  • Word Cloud
  • see less

RESOURCES

  • Blog
  • Resources
  • YouTube
SIGN UP FOR UPDATES

We wouldn't dream of spamming you or selling your info.

© 2025 ChartExpo, all rights reserved.