Categories
Data insights are the backbone of any survey results presentation.


People want data before making a decision. But they want it in a form that’s appealing to their emotions.
So, how do you serve data in a compelling and easy-to-understand form?
Let’s imagine you’ve just gathered survey responses. But you’re stuck in the trenches. You don’t know how to turn these responses into compelling data stories.
How do you jump over this obstacle?
Survey responses are complex and may have textual and numerical data. This requires you to change your strategy during the analysis phase.
We recommend you try these charts, namely:
These survey-based charts and graphs are tailor-made specifically to help extract in-depth insights into your survey responses.
Yes, you read that right.
Excel lacks ready-to-go, easy-to-read, and insightful survey results presentation graphs.
We’re not recommending you dispose of your Microsoft Excel.
Installing third-party apps (add-ins) to access ready-made and easy-to-decode survey results presentation charts.
In this blog, you’ll learn:
Definition: Survey result presentation is the information collected from target respondents. This data is usually about a specific topic to conduct research, such as in a longitudinal survey, which tracks changes over time.
You have multiple methods at your disposal if your goal is to gather survey results for further analysis. You can use a diverse number of mediums to gather feedback and opinions from the desired sample of your niche market.
Seasoned data visualization experts use freemium tools like Google Forms and Microsoft Forms to collect survey data faster. These tools are free, easy to use, and, most importantly, shareable via email, social media, or website embeds.
Once you have gathered responses, what’s the next step?
This is what we seek to address in this blog.
In the coming section, we’ll address the following question: what are the best graphs to use for survey result presentation?
Some of the tested and recommended charts for visualizing survey data include the following:
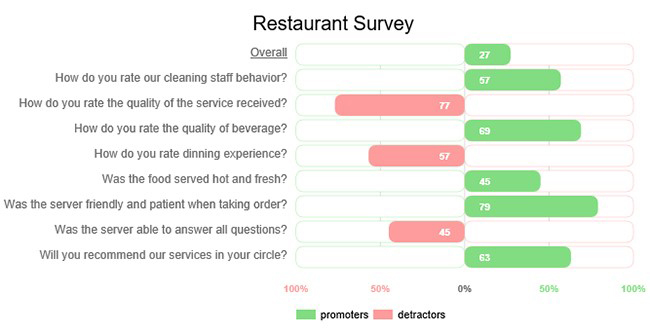
A CSAT Score Bar Chart is one of the survey results presentation-oriented visualizations you can use to display insights into your data.
The chart shows a Net Promoter Score– a customer experience-based metric.
The resulting insights are displayed along a Y-axis between -100 and +100. Use this graph to measure your customers’ level of loyalty.
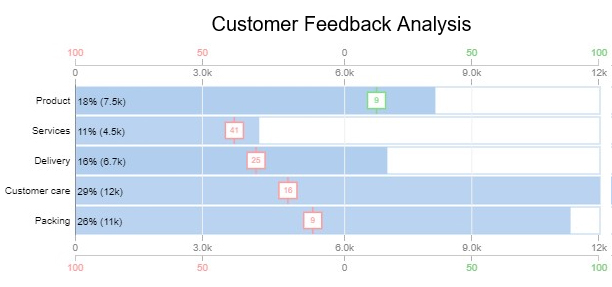
A Customer Satisfaction Chart is a survey result presentation-based graph you can use to display insights into close-ended questionnaire data.
The visualization shows the respondents agree or disagree with topics related to your brand. The easy-to-interpret chart is segmented into red and green, representing YES and NO.
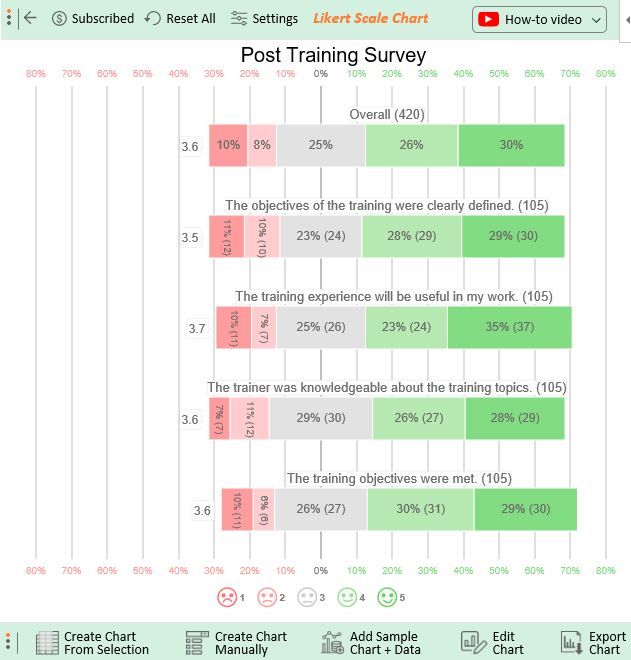
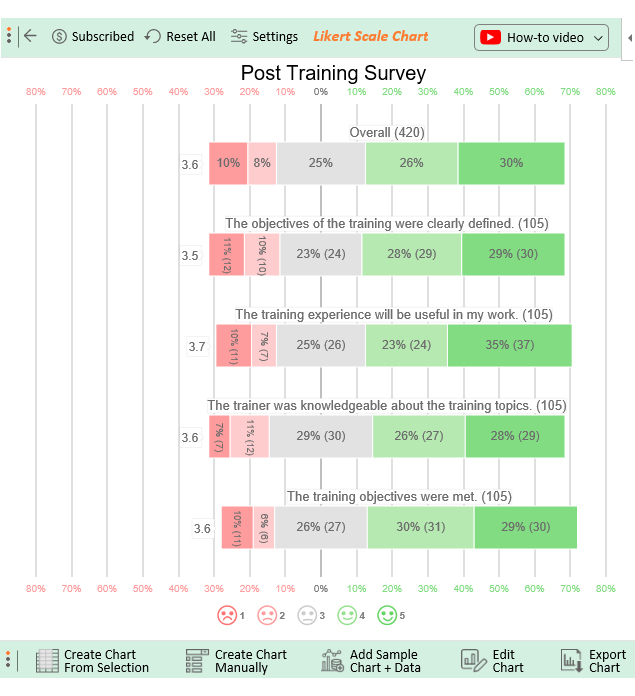
A Likert Chart is one of the survey results presentation-based visualizations you can use to showcase insights into the sentiments of your target respondents.
This psychometric scale-based visualization is best suited for displaying insights into survey data.
There are many Likert scale types, depending on agreement/disagreement levels. For instance, a 7-point Likert Scale has up to 7 options for each question.
In the coming section, we’ll show you how to present survey results using the Likert Scale.
Also, we’ll unveil the tested and recommended add-ins you can install in Excel to access survey result presentation-based visualizations, such as Likert and CSAT Score Bar Charts.
You don’t want to miss this.


Excel is one of the most popular visualization tools among business owners, offering various options such as the Mosaic plot to help analyze and present data effectively.
However, it lacks ready-made survey results presentation-based visualizations, such as the Likert Scale.
We’re not advising you to do away with Excel.
There’s an amazingly affordable tool that comes as an add-in you can easily install in Excel to access ready-to-go and easy-to-read survey results presentation-based visualizations, such as Likert.
The tool is called ChartExpo.
ChartExpo is an add-in you can easily install in your Excel to access ready-made and visually appealing survey results presentation-based visualizations, such as CSAT Score Bar Charts.
ChartExpo’s Features and Benefits
In the coming section, we’ll show you how to install ChartExpo and visualize your data using easy-to-follow steps.
Let’s get started.
In this section, we’ll show you how to visualize your survey responses using a 5-point Likert scale (one of the tested and proven survey result presentation visualizations).
Let’s get on with it.
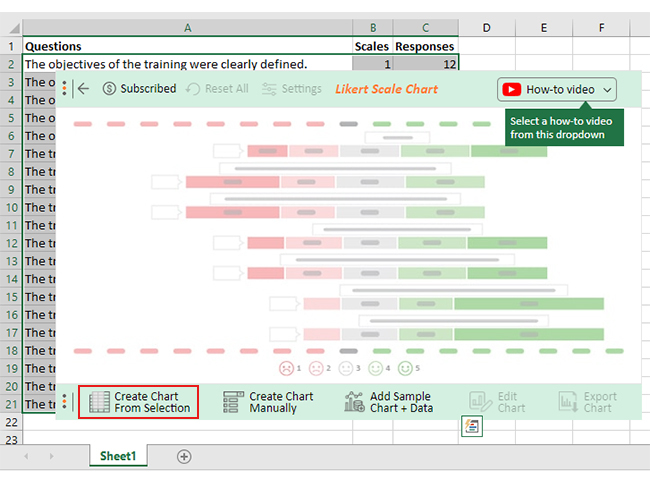
| Questions | Scales | Responses |
| The objectives of the training were clearly defined. | 1 | 12 |
| The objectives of the training were clearly defined. | 2 | 10 |
| The objectives of the training were clearly defined. | 3 | 24 |
| The objectives of the training were clearly defined. | 4 | 29 |
| The objectives of the training were clearly defined. | 5 | 30 |
| The training experience will be useful in my work. | 1 | 11 |
| The training experience will be useful in my work. | 2 | 7 |
| The training experience will be useful in my work. | 3 | 26 |
| The training experience will be useful in my work. | 4 | 24 |
| The training experience will be useful in my work. | 5 | 37 |
| The trainer was knowledgeable about the training topics. | 1 | 7 |
| The trainer was knowledgeable about the training topics. | 2 | 12 |
| The trainer was knowledgeable about the training topics. | 3 | 30 |
| The trainer was knowledgeable about the training topics. | 4 | 27 |
| The trainer was knowledgeable about the training topics. | 5 | 29 |
| The training objectives were met. | 1 | 11 |
| The training objectives were met. | 2 | 6 |
| The training objectives were met. | 3 | 27 |
| The training objectives were met. | 4 | 31 |
| The training objectives were met. | 5 | 30 |
To get started with ChartExpo in Excel, follow the steps below:


Survey data is the information collected from target respondents.
You have multiple methods at your disposal if your goal is to gather survey data for further analysis.
You can use diverse mediums to gather feedback and opinions from the desired sample of your niche market.
Surveys can help you gauge the representativeness of your target market’s views and opinions.
When done well, they provide reliable insights into people’s opinions and sentiments that can be used to make crucial decisions.
Visualize survey responses using charts and graphs, such as the CSAT Score Bar and Likert Charts.


Data insights are the backbone of any survey results presentation.
People want data before deciding. But they want it in a form that’s appealing to their emotions.
How do you serve data in a compelling and easy-to-understand form?
Assume you’ve just gathered survey responses. But you’re stuck in the trenches. You don’t know how to turn these responses into compelling data stories.
Survey responses are complex and may have qualitative and numerical data. This requires you to change your strategy during the analysis phase.
We recommend you try these charts, namely CSAT Score Bar, Customer Satisfaction, and Likert Scale Charts.
These survey-based charts and graphs are tailor-made to help extract in-depth insights into your responses.
How much did you enjoy this article?


Google Forms to Google Sheets keeps your data organized and current with every submission. Learn the steps, methods, and tips now!

Product survey questions reveal what customers truly think. Learn how to ask the right ones and act on the survey results. Read on!

Learn how the 5-Point Performance Rating Scale improves employee evaluations with clear, consistent, and fair performance reviews across teams.


