Categories
There must be a reason why so many homeowners miscalculate a renovation budget. And that’s what this blog is about.


Money slips away fast during renovations. Without a clear house renovation budget, even the most exciting project can spiral out of control. You start with fresh paint and new flooring, then suddenly you’re replacing pipes or reinforcing beams. Renovation budgeting is the tool that keeps the dream from becoming a financial nightmare.
A survey by HomeAdvisor found that over 75% of people end up overspending during a home remodeling project. That’s not pocket change. Kitchens alone can run over $25,000, and unexpected costs often sneak in, from hidden water damage to wiring upgrades. Numbers like these show why planning is more than guesswork.
The good news? You don’t need to be a financial analyst. Tools exist to simplify the process. An operating budget spreadsheet can give you clarity on where every dollar flows. Moreover, a construction budget spreadsheet helps you track material costs against labor expenses. These aren’t complicated. They’re practical guides that put control back in your hands.
Renovation budgeting isn’t about cutting corners. It’s about making informed choices. With the right plan, you’ll know where to splurge and where to save. You’ll see the difference between a dream project and a debt trap. And when the last nail is hammered, you’ll enjoy the results knowing the numbers worked in your favor.
With the groundwork set, it’s time to explore how to structure and analyze a renovation budget.
First…
Definition: Renovation budgeting is the process of planning and tracking the money you spend on a home project. It shows what you can afford and where your money will go. Without it, costs rise quickly and projects stall.
A clear plan helps you avoid overspending and make smarter choices. Many homeowners use tools to stay organized. For example, a construction budget spreadsheet can separate labor, materials, and extra costs. This provides a clear picture of your spending.
Renovation budgeting is not about cutting dreams short. It is about ensuring your vision aligns with your budget.
Calculating a budget for renovation helps keep your vision realistic and your finances secure. It helps you see the difference between what you want and what you can actually achieve. Here are reasons why knowing your numbers matters from day one:
Templates make budgeting simple. They help you plan, track, and adjust without guessing. Using them turns chaos into clarity and keeps your project on course.
Here are some templates to help you get started:
Creating a house renovation budget does not have to be stressful. With a simple Excel sheet, you can plan and track every expense. It provides a clear view of your spending, allowing you to stay in full control and avoid surprises.
Here’s how to create one:
Numbers on a spreadsheet can feel overwhelming, especially when managing performance-based budgeting. Charts turn them into stories you can quickly grasp. They highlight trends, spot issues, and guide decisions. Whether you are tracking expenses or project progress, the right chart changes everything.
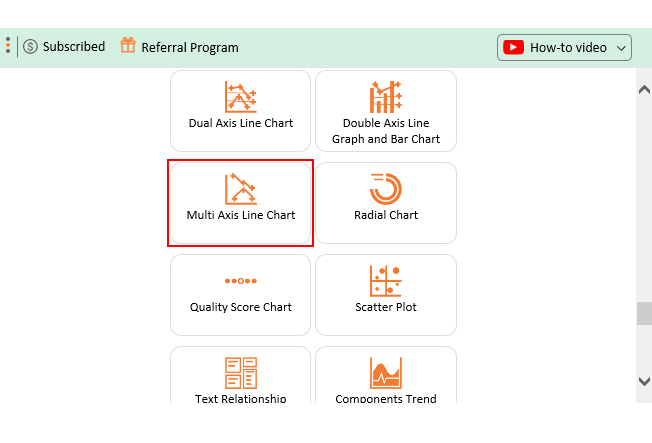
Here are the top ChartExpo visuals in Excel that can transform how you interpret data:
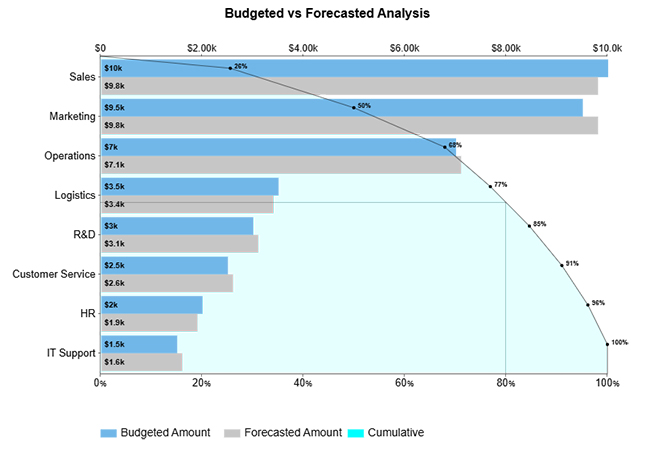
Pareto Bar Chart
This chart highlights the 20 percent of items causing 80 percent of the impact. For a renovation, it can show which materials or tasks are driving most of the costs. You immediately see where to focus and control spending.
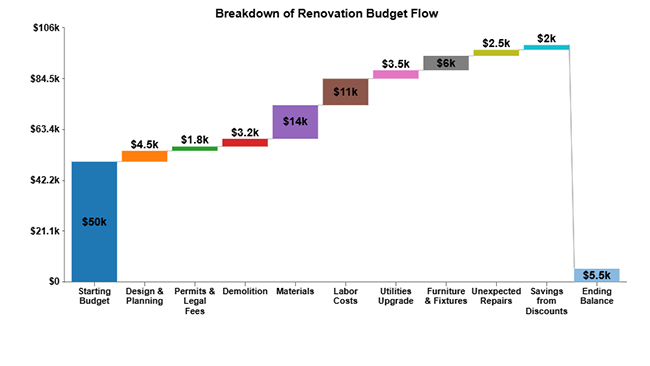
Waterfall Chart
It shows how individual costs accumulate or reduce your budget. You can track expenses from initial estimates to actual bills. It is perfect for spotting overspending before it becomes a problem.
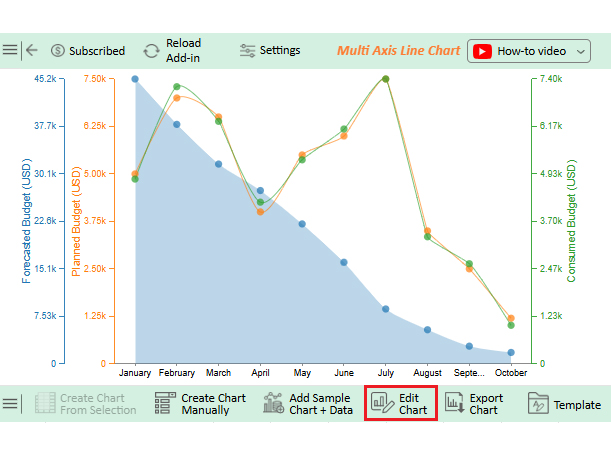
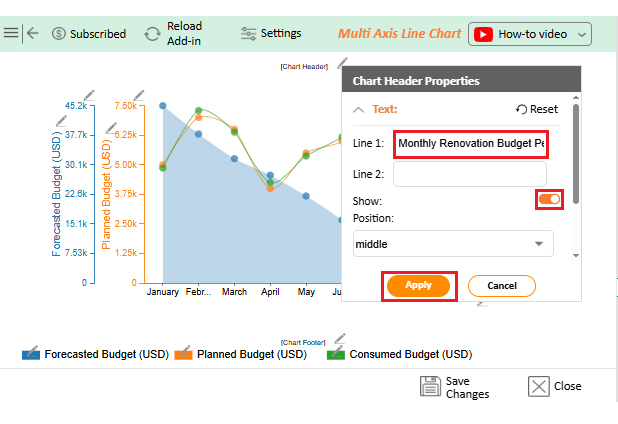
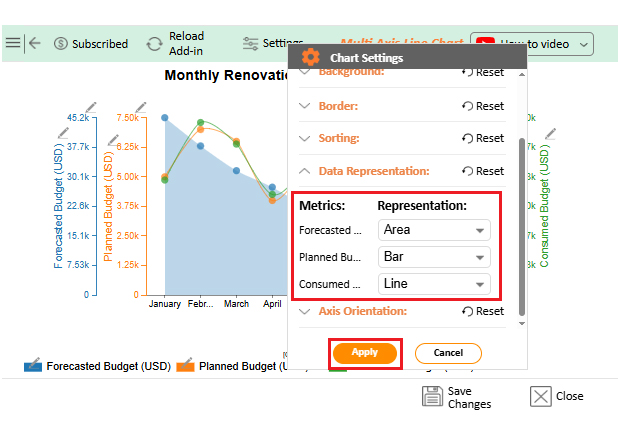
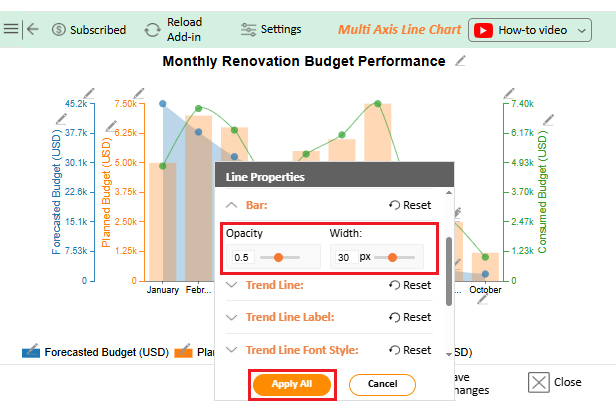
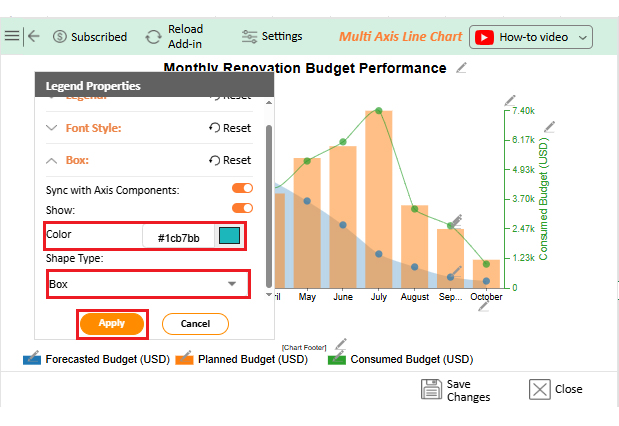
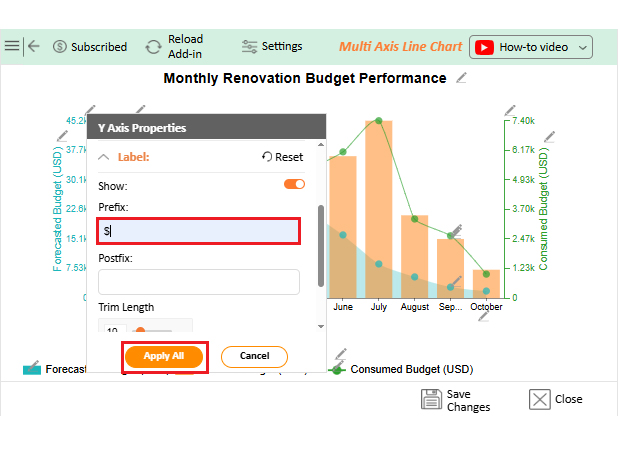
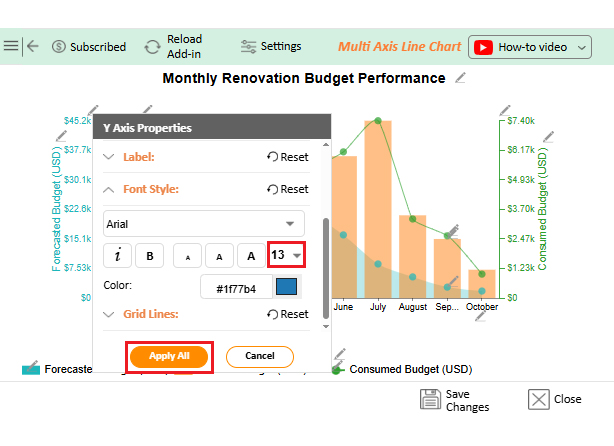
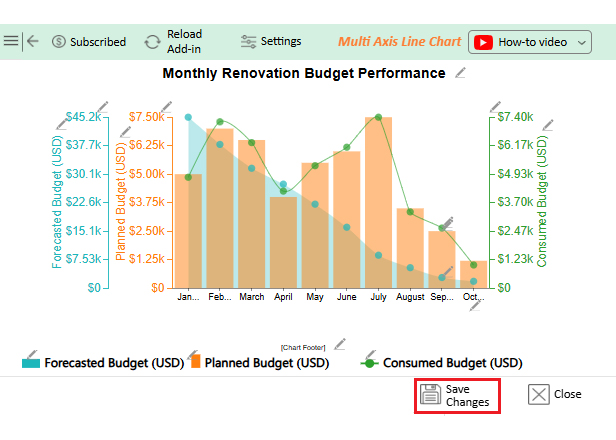
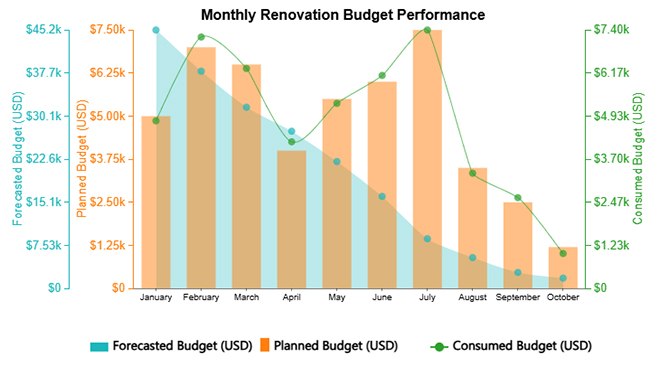
Multi-Axis Line Chart
Use this chart to compare trends that have different scales. For example, you can monitor labor hours against material costs in one view. It makes project adjustments easier.

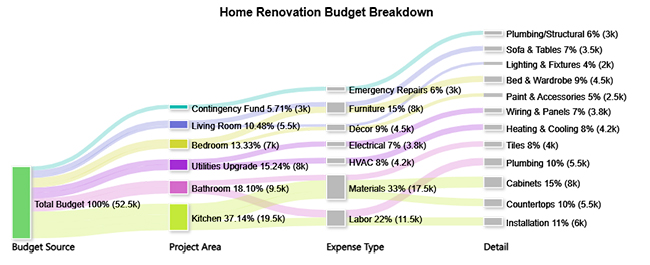
Sankey Chart
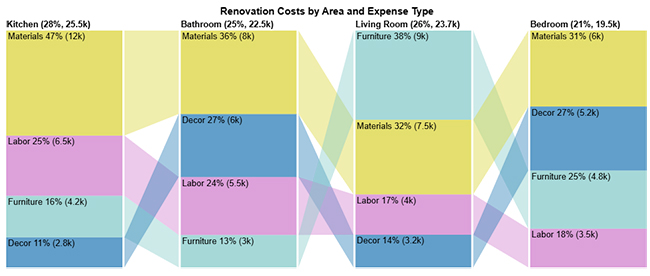
A Sankey diagram is perfect for visualizing how money flows in a project. It shows the path of funds from one category to another, making it easy to see where your renovation budget is going. For example, you can track how a total budget splits between labor, materials, permits, and unexpected costs.
Comparison bar chart
This chart clearly shows differences between categories. You can compare room-by-room expenses or monthly budgets side by side. Patterns emerge instantly, helping you make smarter choices.
Crunching numbers can feel like staring at a maze. Spreadsheets are full of rows and columns, making it easy to miss the big picture. You need clarity to understand how each cost impacts the total renovation budget.
Traditional Excel charts can show trends, but they often fail at revealing relationships and flows. Colors and shapes are limited, and insights hide in plain sight. That is where ChartExpo comes in.
Why ChartExpo? It transforms raw numbers into clear, visual representations. Sankey charts, Pareto charts, and multi-axis lines become easy to read. Suddenly, analyzing your renovation budget becomes fast, precise, and even enjoyable.
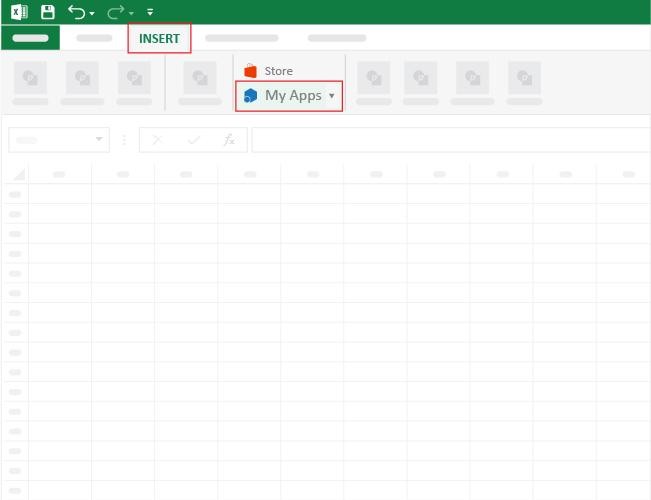
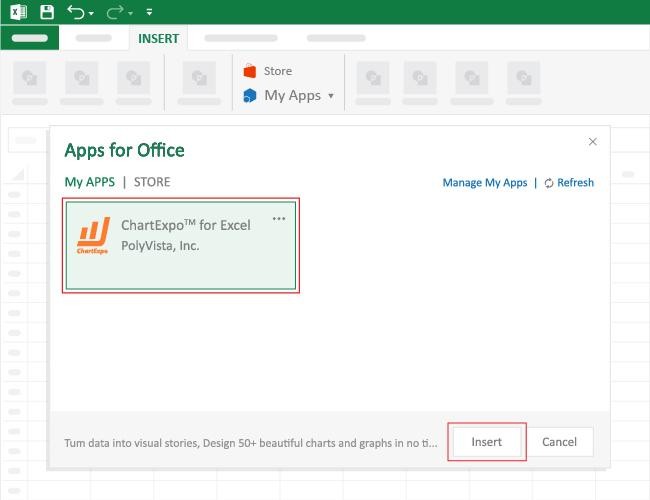
How to Install ChartExpo in Excel?
ChartExpo charts are available both in Google Sheets and Microsoft Excel. Please use the following CTAs to install the tool of your choice and create beautiful visualizations with a few clicks in your favorite tool.
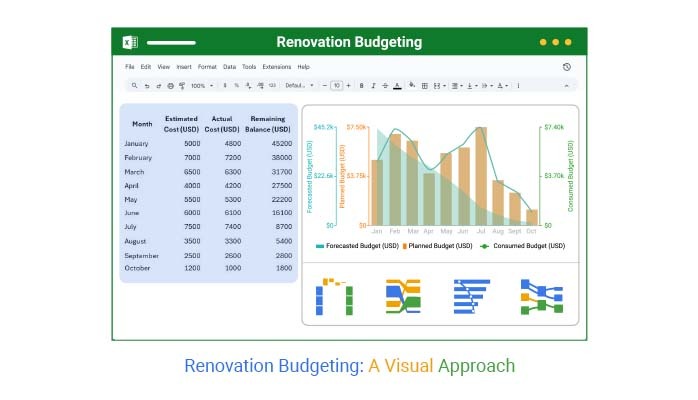
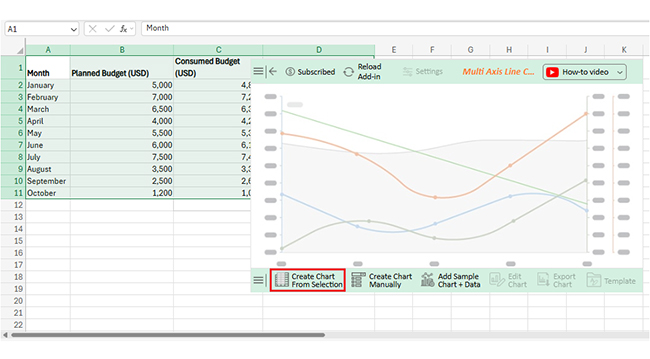
Assume you have the data below. You want to glean insights from it. How do you go about it? Follow the steps below to create a chart in Excel using ChartExpo and analyze it:
|
Month |
Estimated Cost (USD) | Actual Cost (USD) |
Remaining Balance (USD) |
| January | 5,000 | 4,800 | 45,200 |
| February | 7,000 | 7,200 | 38,000 |
| March | 6,500 | 6,300 | 31,700 |
| April | 4,000 | 4,200 | 27,500 |
| May | 5,500 | 5,300 | 22,200 |
| June | 6,000 | 6,100 | 16,100 |
| July | 7,500 | 7,400 | 8,700 |
| August | 3,500 | 3,300 | 5,400 |
| September | 2,500 | 2,600 | 2,800 |
| October | 1,200 | 1,000 | 1,800 |
Renovation budgeting turns uncertainty into control. It ensures your dream project stays on track and within reach.
How?
Creating a home remodel budget sounds simple on paper. However, in reality, it can be quite challenging. Costs can change without warning, and market prices fluctuate.
Planning takes time and patience, and here are key limitations to keep in mind:
A smart approach keeps your spending under control and your project on track. Small habits and practical tools can make a big difference. Here are some tips and tricks to succeed in renovation budgeting.
ROI = (Increase in Property Value – Renovation Cost) ÷ Renovation Cost × 100. This formula shows the percentage gain from your renovation spending.
Creating a home renovation budget may seem overwhelming at first. Numbers, estimates, and unexpected costs can feel confusing. But with a clear plan, it becomes manageable. A well-structured budget keeps your project on track and reduces stress.
Begin by listing all categories and carefully estimating costs. Include labor, materials, permits, and extra expenses. Pro tip: Always add a contingency fund. Using monthly budget examples can help guide your allocations and keep your plan realistic.
Input all data into Excel or a business budget template in Excel. Apply formulas to calculate totals and percentages. This makes it easy to see where your money is going and spot areas that may need adjustment.
Track expenses regularly and update your spreadsheet on a weekly basis. Consider an investment tracking spreadsheet approach to visualize spending patterns. This helps prevent overspending and keeps priorities clear.
Charts and visuals make analysis much easier. Traditional Excel charts are useful but limited. Installing ChartExpo enhances Excel’s capabilities, giving you clarity and control.
Don’t wait for costs to spiral out of control. Grab your Excel sheet and start building your renovation budget today. Install ChartExpo to visualize your spending and track every dollar with ease.
How much did you enjoy this article?


Calculate accounts receivable turnover ratio to measure credit collection speed, improve cash flow, and strengthen your financial strategy. Read on!

Change Management KPIs are the key to tracking adoption, performance, and ROI during transitions. Find out which metrics matter. Read on!

Data collection methods and techniques determine the quality of every insight you act on. Explore key approaches for gathering reliable data. Read on!


