• Home
  • Tools dropdown img
    • Spreadsheet Charts

      • ChartExpo for Google Sheets
      • ChartExpo for Microsoft Excel
    • Power BI Charts

      • Power BI Custom Visuals by ChartExpo
    • Word Cloud

  • Charts dropdown img
    • Chart Category

      • Bar Charts
      • Circle Graphs
      • Column Charts
      • Combo Charts
      • Comparison Charts
      • Line Graphs
      • PPC Charts
      • Sentiment Analysis Charts
      • Survey Charts
    • Chart Type

      • Box and Whisker Plot
      • Clustered Bar Chart
      • Clustered Column Chart
      • Comparison Bar Chart
      • Control Chart
      • CSAT Survey Bar Chart
      • CSAT Survey Chart
      • Dot Plot Chart
      • Double Bar Graph
      • Funnel Chart
      • Gauge Chart
      • Likert Scale Chart
      • Matrix Chart
      • Multi Axis Line Chart
      • Overlapping Bar Chart
      • Pareto Chart
      • Radar Chart
      • Radial Bar Chart
      • Sankey Diagram
      • Scatter Plot Chart
      • Slope Chart
      • Sunburst Chart
      • Tornado Chart
      • Waterfall Chart
      • Word Cloud
    • Google Sheets
      Microsoft Excel
  • Services
  • Pricing
  • Contact us
  • Blog
  • Support dropdown img
      • Gallery
      • Videos
      • Contact us
      • FAQs
      • Resources
    • Please feel free to contact us

      atsupport@chartexpo.com

Categories
All Data Visualizations Data Analytics Surveys
Add-ons/
  • Google Sheets
  • Microsoft Excel
  • Power BI
All Data Visualizations Data Analytics Surveys
Add-ons
  • Google Sheets
  • Microsoft Excel
  • Power BI

We use cookies

This website uses cookies to provide better user experience and user's session management.
By continuing visiting this website you consent the use of these cookies.

Ok

ChartExpo Survey


Home > Blog > Data Analytics

Inventory Management KPIs for Better Visual Insights

Key Performance Indicators for inventory—why do they matter? Every business handling products needs a straightforward way to track efficiency—strong metrics balance inventory, preventing excess stock or shortages that lead to revenue loss.

Key Performance Indicators for Inventory

Key Performance Indicators for inventory help businesses adjust. Metrics like turnover, accuracy, and order cycle time highlight issues before they escalate. If accuracy is off, warehouse errors grow. If the order cycle time is slow, customers get impatient. KPIs for accounting also play a role here. How? They track costs, margins, and financial efficiency in inventory management.

Every industry benefits. Restaurants track food waste, retailers monitor sell-through rates, and manufacturers measure production efficiency. Retail industry KPIs focus on stock turnover, customer demand, and seasonal trends to maximize profitability. Every industry relies on clear performance indicators to improve operations.

Ignoring the numbers is costly. Inaccurate inventory leads to lost sales, higher costs, and wasted space. Companies using strong Key Performance Indicators for Inventory reduce inefficiencies and boost profits. Using them with Key Performance Indicators for operations ensures seamless workflows and prevents costly inefficiencies.

Let’s get started.

Table of Contents:

  1. What are KPIs in Inventory Management?
  2. Why are KPIs Important in Inventory Management?
  3. Top 11 Inventory Management KPIs
  4. How to Analyze KPIs for Inventory in Excel?
  5. How to Use Inventory Key Performance Indicators?
  6. How to Choose the Right Inventory Management KPIs?
  7. FAQs
  8. Wrap Up

What are KPIs in Inventory Management?

Definition: KPIs in inventory management measure efficiency and accuracy. They track stock levels, turnover, and order fulfillment. High turnover means products sell quickly, while low turnover signals slow sales or excess stock.

Inventory accuracy ensures records match actual stock. Order cycle time measures how fast products move. Stockout rates show lost sales due to shortages, and carrying costs track storage expenses.

These KPIs help businesses reduce waste, improve cash flow, and meet customer demand. You can track SMART KPIs, for example, like setting a goal to maintain 95% inventory accuracy. Or reduce order cycle time by 10% in six months. This strong tracking leads to better decisions and higher profits.

Why are KPIs Important in Inventory Management?

Managing inventory without KPIs is like flying blind. Guesswork leads to lost sales, wasted space, and frustrated customers. Tracking the correct numbers helps businesses stay efficient, profitable, and competitive.

Here’s why inventory performance metrics & KPIs matter:

  • Prevents overstocking and stockouts: Too much inventory ties up cash and increases storage costs. Too little stock leads to missed sales and unhappy customers.
  • Improves order accuracy and customer satisfaction: Wrong shipments lead to frustrations and additional costs. Keeping accurate inventory ensures the right products arrive at the right time.
  • Enhances cost efficiency: Too much inventory increases storage, insurance, and maintenance costs. Waste reduction and optimal stock levels promote profitability.
  • Streamlines supply chain operations: Inefficient processes slow down deliveries and disrupt sales. Tracking KPIs helps identify and fix bottlenecks before they impact the business.
  • Supports data-driven decision-making: Relying on guesswork leads to costly mistakes. KPIs provide fundamental insights that help businesses make more intelligent, profitable choices.

Top 11 Inventory Management KPIs

Tracking the right inventory KPIs keeps businesses running smoothly. Too much stock? Cash gets tied up. Too little? Customers leave. The right balance boosts profits and efficiency.

Here are 11 key inventory management KPIs that drive success:

  1. Inventory Turnover Rate: Measures how often stock is sold and replaced. A high rate means strong demand, while a low rate signals slow-moving products.
  2. Days Sales of Inventory (DSI): This shows how long inventory stays before selling. A lower DSI means faster movement, while a higher DSI can indicate overstocking.
  3. Stock Accuracy: This KPI for inventory management compares recorded inventory to actual stock. Inaccurate records cause lost sales and wasted space.
  4. Order Accuracy: Tracks how often customers receive correct orders. Mistakes increase costs and damage customer trust.
  5. Stockout Rate: Measures how often items are unavailable when needed. High rates lead to lost sales and frustrated customers.
  6. Carrying Cost of Inventory: Tracks expenses like storage, insurance, and depreciation. Lower costs improve cash flow and profitability.
  7. Fill Rate: Shows the percentage of customer orders shipped on time. A high fill rate means better service and happier customers.
  8. Gross Margin Return on Investment (GMROI): Calculates profit earned for every dollar spent on inventory. A higher GMROI means better returns and efficiency.
  9. Backorder Rate: Measures the percentage of delayed orders due to low stock. Frequent backorders hurt reputation and customer satisfaction.
  10. Lead Time: Tracks the time between ordering and receiving stock. Shorter lead times improve efficiency and reduce stockouts.
  11. Return Rate: Shows how often customers send products back. High return rates may indicate quality issues or incorrect shipments.

How to Analyze KPIs for Inventory in Excel?

Inventory management isn’t just about counting stock. It’s about making smart decisions using the correct data. Key Performance Indicators (KPIs) help track efficiency, reduce waste, and improve cash flow.

But raw data alone isn’t enough. Visualizing trends makes analysis faster and easier. However, Excel struggles with clear, insightful visuals. Its charts can be clunky and limited.

That’s where ChartExpo comes in. It turns complex inventory data into easy-to-read visual stories, making smarter decisions simple.

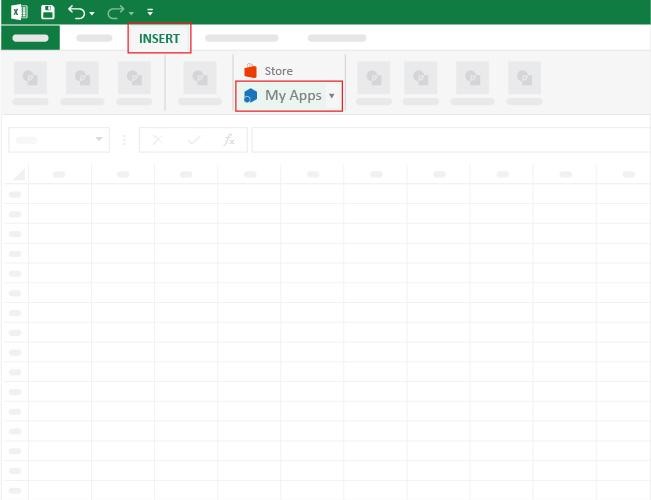
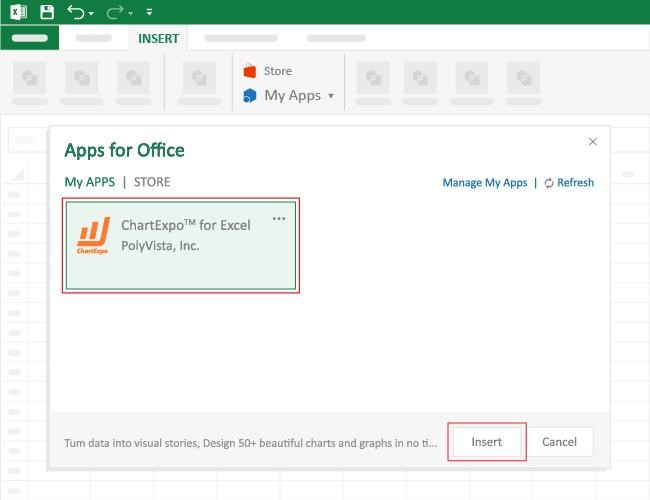
How to Install ChartExpo in Excel?

  1. Open your Excel application.
  2. Open the worksheet and click the “Insert” menu.
  3. You’ll see the “My Apps” option.
  4. In the Office Add-ins window, click “Store” and search for ChartExpo on the My Apps Store.
  5. Click the “Add” button to install ChartExpo in your Excel.

ChartExpo charts are available both in Google Sheets and Microsoft Excel. Please use the following CTAs to install the tool of your choice and create beautiful visualizations with a few clicks in your favorite tool.

Example

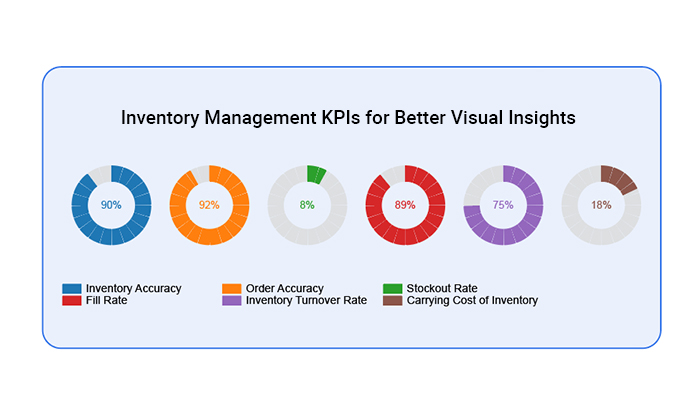
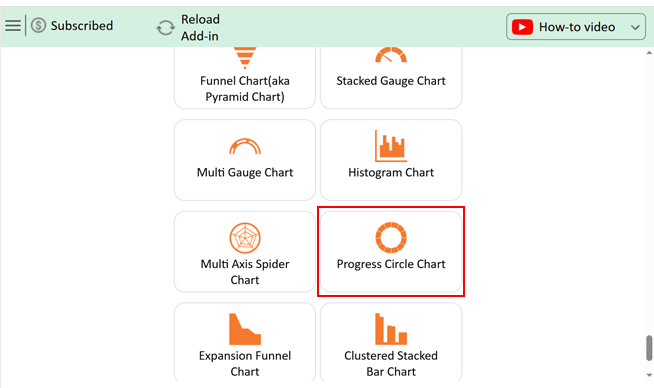
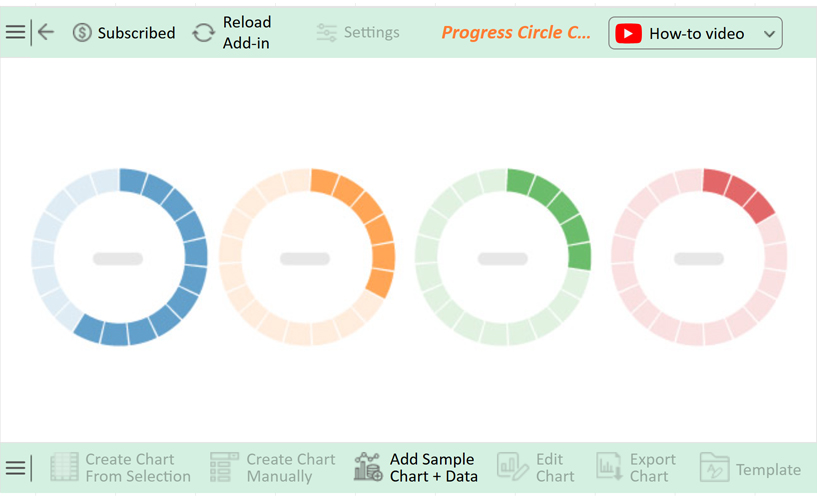
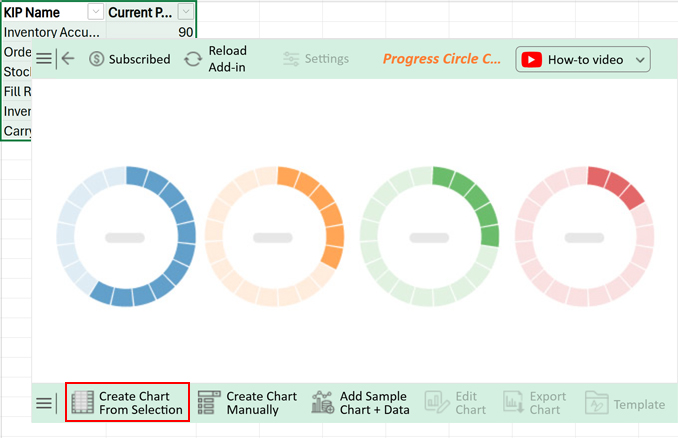
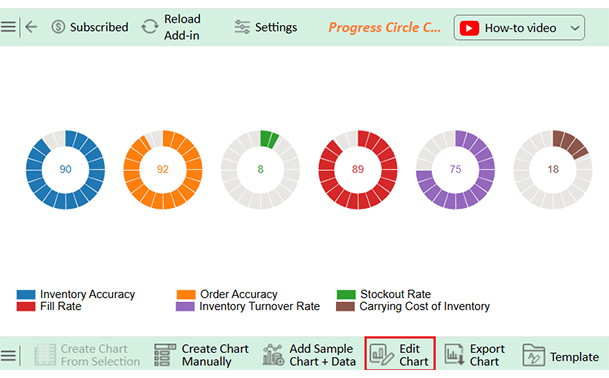
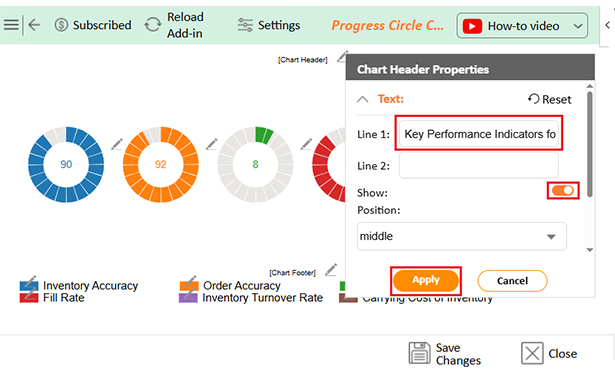
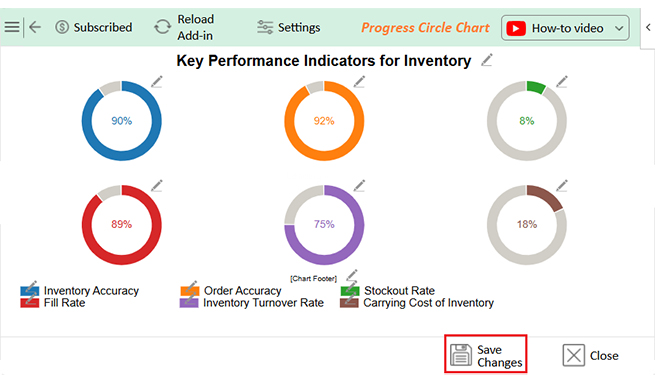
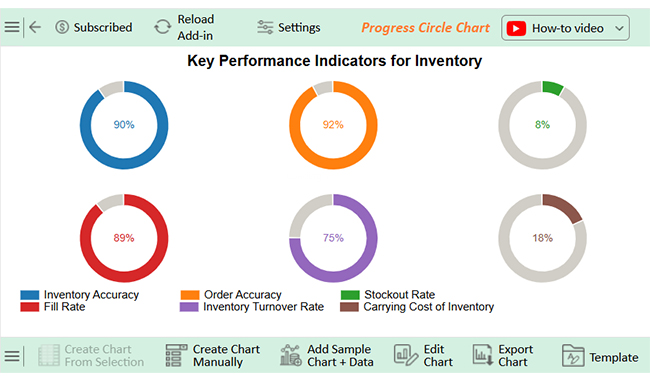
Let’s visualize the Key Performance Indicators data below and analyze it using ChartExpo for Excel.

KPI Name Current Performance (%)
Inventory Accuracy 90
Order Accuracy 92
Stockout Rate 8
Fill Rate 89
Inventory Turnover Rate 75
Carrying Cost of Inventory 18
  • To get started with ChartExpo, install ChartExpo in Excel.
  • Now, click on My Apps from the INSERT menu.
Key Performance Indicators for Inventory
  • Choose ChartExpo from My Apps, then click Insert.
Key Performance Indicators for Inventory
  • Once it loads, scroll through the charts list to locate and choose the “Progress Circle Chart”.
Key Performance Indicators for Inventory
  • The Progress Circle Chart will appear as below.
Key Performance Indicators for Inventory
  • Click the “Create Chart From Selection” button after selecting the data from the sheet, as shown.
Key Performance Indicators for Inventory
  • ChartExpo will generate the visualization below for you.
Key Performance Indicators for Inventory
  • If you want to add anything to the chart, click the Edit Chart button:
  • Click the pencil icon next to the Chart Header to change the title.
  • It will open the properties dialog. Under the Text section, you can add a heading in Line 1 and enable Show.
  • Give the appropriate title of your chart and click the Apply button.
Key Performance Indicators for Inventory
  • You can add the (%) with all values:
Key Performance Indicators for Inventory
  • You can change the Data Representation by clicking on Settings as follows:
Key Performance Indicators for Inventory
  • Click the “Save Changes” button to persist the changes made to the chart.
Key Performance Indicators for Inventory
  • Your final Progress Circle Chart will look like the one below.
Key Performance Indicators for Inventory

Insights

  • Accuracy Rates: Strong performance (90-92%).
  • Stockout Rate: Needs improvement (8%).
  • Carrying Cost: High and requires optimization (18%).
  • Fill Rate: Good but can be improved (89%).
  • Turnover Rate: Healthy (75%) but suggests stock level adjustments.

How to Use Inventory Key Performance Indicators?

Tracking KPIs isn’t enough. The real value comes from using them to improve operations. Numbers reveal problems, but action solves them. Here’s how to make inventory KPIs work for you:

  1. Identify relevant KPIs: Every business has different inventory challenges. Focus on metrics directly impacting efficiency, costs, and customer satisfaction.
  2. Set clear targets: Tracking numbers without goals won’t drive improvement. Establish measurable benchmarks to gauge performance and identify areas for growth.
  3. Track and analyze data: Regular monitoring helps uncover trends and inefficiencies. Consistently reviewing KPI data ensures quick adjustments and more intelligent decision-making.
  4. Take data-driven actions: Insights are only helpful if they lead to change. Use KPI results to optimize stock levels, improve accuracy, and streamline operations.
  5. Continuously improve processes: Inventory management requires ongoing adjustments to ensure optimal performance. Refining strategies over time helps maintain efficiency and stay competitive.

How to Choose the Right Inventory Management KPIs?

Choosing the right inventory KPIs doesn’t involve tracking everything. Why? Too many metrics create confusion. The key is selecting the ones that drive real improvements.

Here’s how to find the right fit:

  1. Align KPIs with business goals: KPIs should match your business’s goals. Whether reducing costs, improving efficiency, or increasing customer satisfaction, focus on areas and metrics that spur real progress.
  2. Consider industry standards: Each industry has its own rubrics for success. By comparing your KPIs against industry averages, you can keep up with your competition while uncovering areas for improvement.
  3. Focus on actionable metrics: Data serves no purpose if it doesn’t result in change. Tip: Use KPIs that identify some problems and offer insights on improvement.
  4. Balance between financial and operational KPIs: Profitability and efficiency are essential. A mix of financial and operational KPIs ensures a well-rounded view of inventory performance.
  5. Use real-time tracking: Outdated data can lead to costly mistakes. Real-time tracking helps you respond quickly to stock fluctuations, demand changes, and supply chain disruptions.
  6. Regularly review and adjust KPIs: Business evolves – so should your KPIs. Periodically analyzing and updating your metrics ensures they remain relevant and practical.

FAQs

What are the 3 key measures of inventory?

The 3 key inventory measures are turnover rate, accuracy, and carrying cost:

  • The turnover rate tracks how fast stock sells and is replenished.
  • Accuracy ensures that the recorded inventory matches the actual stock.
  • Carrying cost measures expenses like storage, insurance, and depreciation.

How do you measure inventory performance?

Inventory performance is measured using turnover rate, accuracy, and stockout rate. The turnover rate tracks how often stock is sold and replaced. Accuracy ensures inventory records match actual stock, while the stockout rate measures lost sales due to shortages. Tracking these metrics improves efficiency.

What is the efficient way to track inventory?

The efficient way to track inventory is by using real-time data and automation. Barcode scanning reduces errors, as Inventory management software updates stock levels instantly. Strong inventory KPI tracking prevents stock issues and improves efficiency.

Wrap Up

Tracking the right KPIs prevents stock issues. Overstocking ties up cash, while stockouts drive customers away. Balanced inventory ensures smooth operations and steady profits.

Data accuracy is essential. Errors in stock records lead to delays and lost sales. High accuracy rates improve order fulfillment and customer satisfaction. With SaaS, key performance indicators can help you monitor inventory trends efficiently.

What are sales KPIs in inventory management used for? They measure sales performance and ensure inventory aligns with demand.

Cost control matters. Carrying costs, turnover rates, and fill rates impact profitability. Monitoring these KPIs helps cut unnecessary expenses and optimize stock levels. Key performance indicators for the manufacturing industry focus on production efficiency and inventory flow.

Excel works for basic tracking but falls short in data visualization. Complex trends need clear, insightful visuals, and tools like ChartExpo turn raw data into actionable insights.

Strong inventory management relies on intelligent data use. KPIs highlight problems before they escalate. With the right tools, you can make faster, better inventory management decisions.

For better analysis and insights? Install ChartExpo to transform complex inventory data into clear, actionable insights.

How much did you enjoy this article?

PBIAd1
Start Free Trial!
151253

Related articles

next previous
Data Analytics11 min read

How to Increase Efficiency in a Business?

How to increase efficiency in the business is key to boosting performance. Click here to learn the strategies to use to increase your business efficiency.

Data Analytics9 min read

Moving Annual Total for Insightful Reports

The Moving Annual Total (MAT) tracks 12 months of data for clearer trends. Discover its importance, formula, and Excel analysis for better sales forecasting.

Data Analytics9 min read

Marketing Spend Template for Smarter Insights

Learn everything about the marketing spend template. You'll also learn how to create a marketing budget plan and tips for using one, and many more.

Data Analytics12 min read

Business Intelligence in Healthcare Industry: A Visual Approach

Business Intelligence in the healthcare industry improves patient care and streamlines operations. Learn how BI works and benefits healthcare providers.

Data Analytics10 min read

Analytics in Telecom Industry for Better Insights

Analytics in the telecom industry optimizes networks, enhances customer experience, and detect fraud. Learn its key benefits, challenges, and use cases.

ChartExpo logo

Turn Data into Visual
Stories

CHARTEXPO

  • Home
  • Gallery
  • Videos
  • Services
  • Pricing
  • Contact us
  • FAQs
  • Privacy policy
  • Terms of Service
  • Sitemap

TOOLS

  • ChartExpo for Google Sheets
  • ChartExpo for Microsoft Excel
  • Power BI Custom Visuals by ChartExpo
  • Word Cloud

CATEGORIES

  • Bar Charts
  • Circle Graphs
  • Column Charts
  • Combo Charts
  • Comparison Charts
  • Line Graphs
  • PPC Charts
  • Sentiment Analysis Charts
  • Survey Charts

TOP CHARTS

  • Sankey Diagram
  • Likert Scale Chart
  • Comparison Bar Chart
  • Pareto Chart
  • Funnel Chart
  • Gauge Chart
  • Radar Chart
  • Radial Bar Chart
  • Sunburst Chart
  • see more
  • Scatter Plot Chart
  • CSAT Survey Bar Chart
  • CSAT Survey Chart
  • Dot Plot Chart
  • Double Bar Graph
  • Matrix Chart
  • Multi Axis Line Chart
  • Overlapping Bar Chart
  • Control Chart
  • Slope Chart
  • Clustered Bar Chart
  • Clustered Column Chart
  • Box and Whisker Plot
  • Tornado Chart
  • Waterfall Chart
  • Word Cloud
  • see less

RESOURCES

  • Blog
  • Resources
  • YouTube
SIGN UP FOR UPDATES

We wouldn't dream of spamming you or selling your info.

© 2025 ChartExpo, all rights reserved.