Categories
Tracking portfolio performance without a structured framework often leads to missed risks, poor timing, and costly financial surprises that could have been avoided.
Investment performance reporting gives investors, analysts, and fund managers a consistent, repeatable approach to measuring returns, assessing risk exposure, and evaluating progress against clearly defined financial goals.
This guide covers the core concepts: what investment performance reporting means, why it matters, the key components and metrics involved, common report types, step-by-step Excel examples, and best practices for analysis.
Whether you manage personal savings or institutional capital, the methods here will sharpen how you read and produce financial reports.
Definition: Investment performance reporting is a structured process for measuring, analyzing, and presenting investment results across a defined time period. It shows how assets perform, what return they generate, and how those results compare against established benchmarks.
The core purpose of investment reporting is to give investors, financial analysts, and portfolio managers the data they need to evaluate outcomes and make sound decisions. Individuals, asset managers, corporations, and financial institutions rely on these reports to monitor growth, control risk, and maintain accountability.
The scope of investment reporting and performance spans return tracking, asset allocation review, risk measurement, and compliance monitoring across relevant financial standards.
Good financial management requires knowing exactly how your investments are performing, not just assuming they are on track. The following are the core reasons it matters:
A well-designed investment performance report format draws together several key data points that, taken together, reveal the full state of a portfolio. Main components include:
The form of investment reporting used depends on who needs the data, the decisions being made, and the level of detail the situation calls for. Common report types include:
Reliable investment performance reports are built on a defined set of financial metrics. Important metrics include:
Real examples make investment performance reporting easier to absorb because they show how data types come together in a structured view. These examples focus on performance, risk, and portfolio comparison.
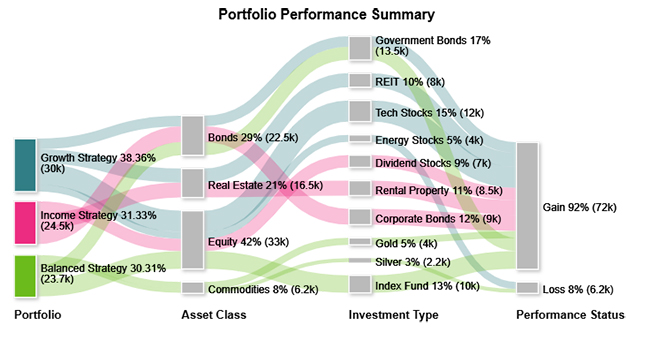
The Portfolio Performance Summary example shows how assets are spread across classes and investment types to represent the portfolio’s overall composition.
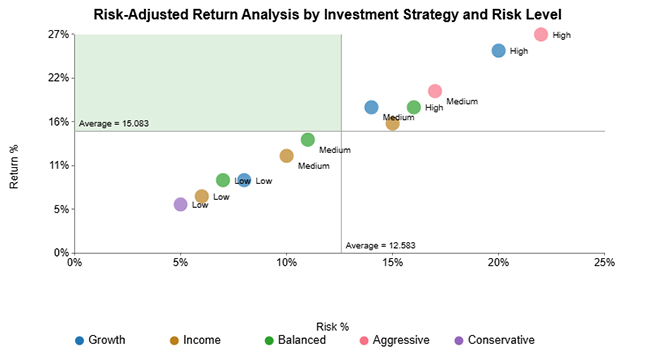
The Risk-Adjusted Return Analysis example illustrates the relationship between risk and return, showing that conservative positions carry lower risk alongside lower returns.
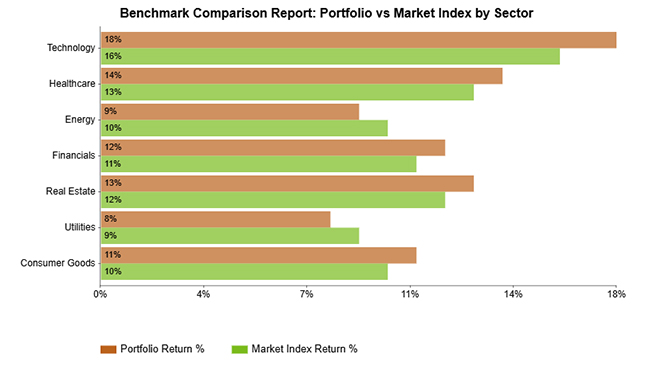
The Benchmark Comparison Report example provides a sector-level view comparing portfolio returns to a market index, revealing where the portfolio outperforms or falls short.
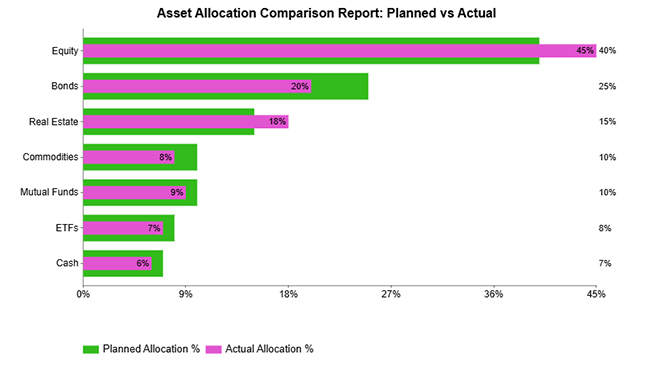
The Asset Allocation Comparison Report example sets planned allocation against actual allocation to show how the portfolio has shifted during the reporting period.
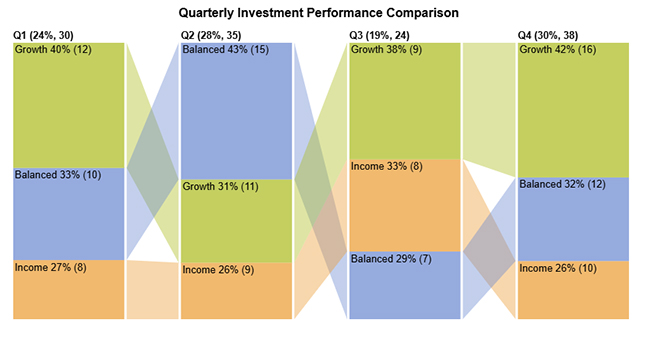
The Quarterly Investment Performance Comparison example tracks portfolio results across consecutive quarters to identify performance trends in investment reporting and performance over time.
Building investment performance reports in Excel makes it straightforward to track portfolio holdings, compute returns, and present results in a repeatable, organized format. The following steps walk through the complete process:
Collect transaction history, prices, dividends, and expenses to ensure the report includes complete investment performance records.
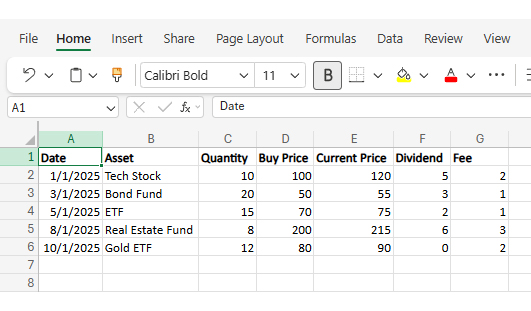
Create columns for date, asset name, quantity, cost, current value, and profit/loss to keep the data organized.
=Quantity * Buy Price
=Quantity * Current Price
Enter all buy, sell, income, and expense details carefully so the investment performance reporting remains accurate.
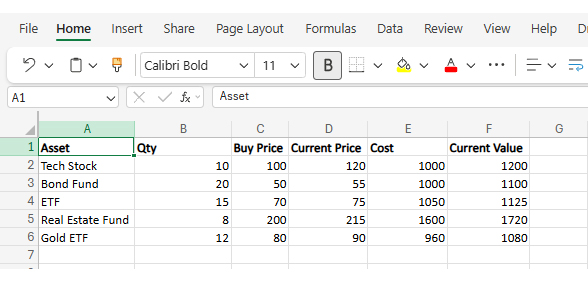
Use formulas to calculate ROI, total return, and other key performance indicators to evaluate results.
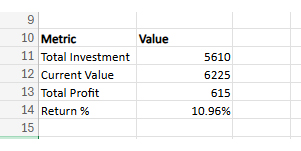
=SUM(E2:E6)
=SUM(F2:F6)
=Total Value – Total Investment
=Profit / Total Investment
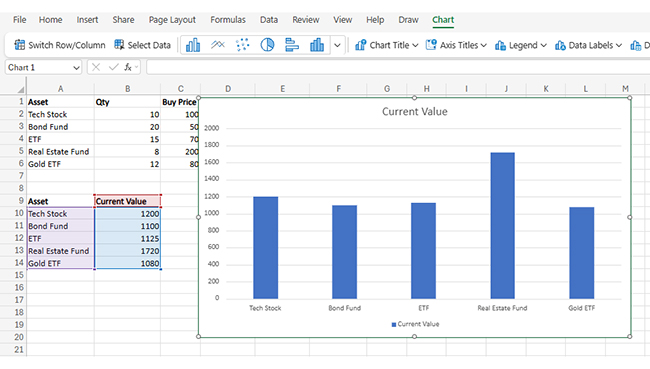
Insert charts to visualize growth, asset allocation, and return trends for better understanding. Select data, go to Insert > charts, and choose relevant charts.
Prepare a final summary showing total investment, total return, and key insights for quick analysis.
Analyzing investment performance reporting in Excel helps you evaluate returns, track portfolio allocation, and understand how different strategies contribute to overall growth. By organizing and visualizing your data effectively, you can make smarter financial decisions. Follow these steps to perform a comprehensive analysis:
Begin by structuring your dataset with key fields such as investment type, strategy, asset class, returns, and value. Ensure the data is clean, consistent, and properly labeled for accurate analysis.
Group your data into meaningful categories like growth, income, or balanced strategies, and further into asset classes such as stocks, bonds, or real estate. This helps in comparing performance across segments.
Use Excel formulas to compute returns, percentage contributions, and growth rates. These metrics provide a clear view of how each investment performs within the portfolio.
Create Pivot Tables to summarize investment performance across strategies and asset classes. This allows you to identify top-performing areas and underperforming segments quickly.
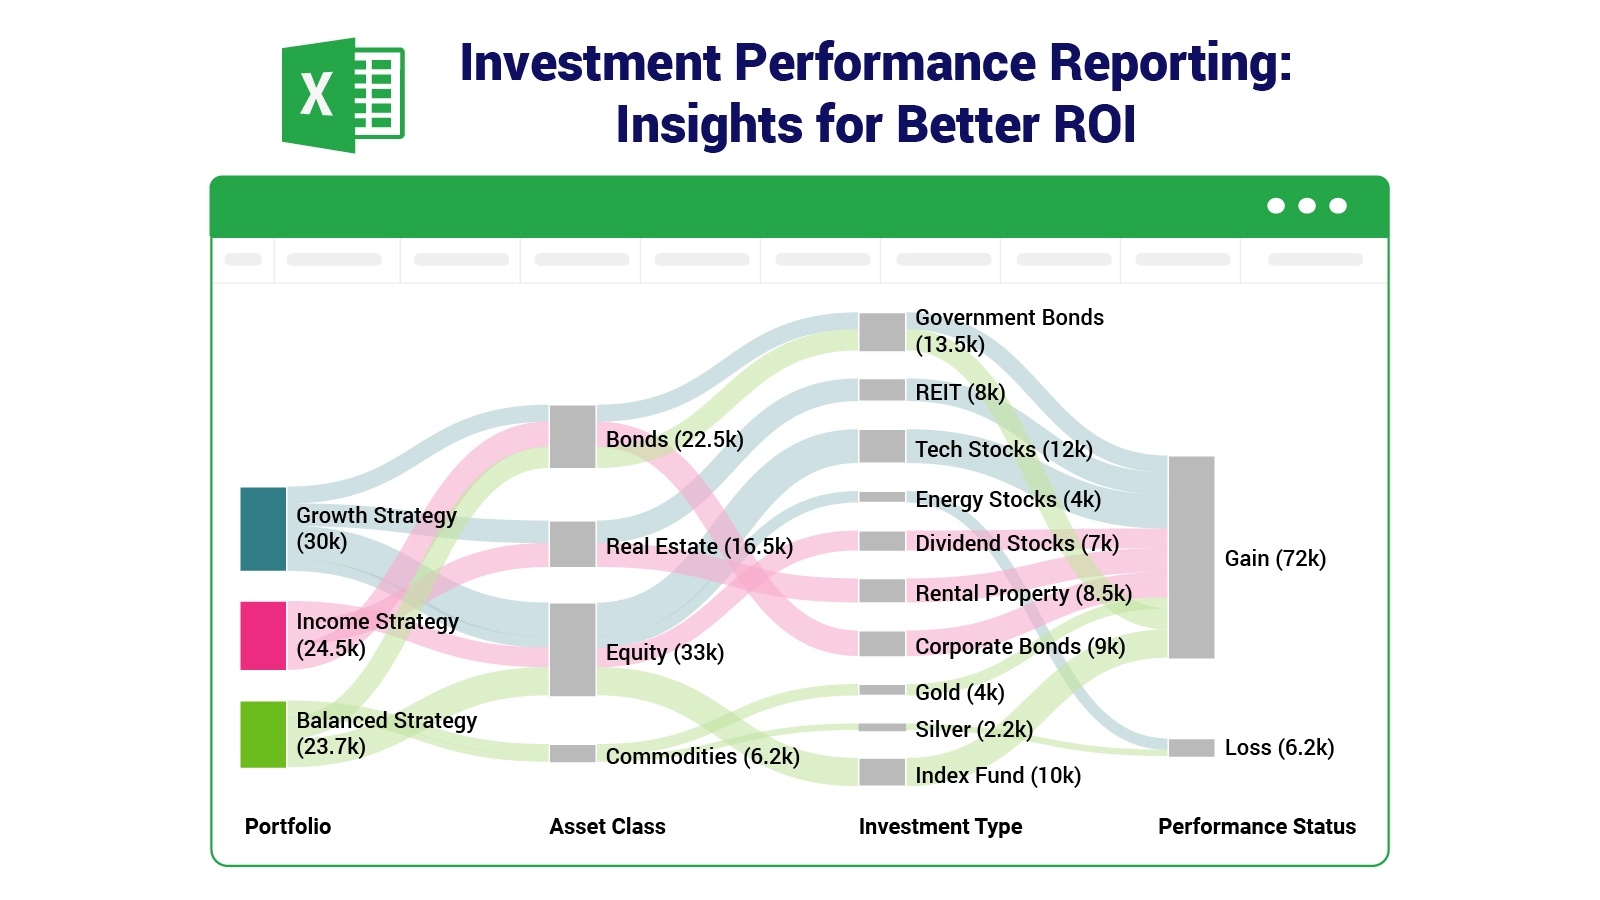
Use charts such as bar charts or flow-based visuals to represent investment distribution and performance. For more advanced and interactive visuals, you can use ChartExpo to simplify complex data visualization.
Analyze your visuals to understand how funds flow between strategies and assets, and identify which investments drive the most value or risk.
Include a final visualization, such as a flow-based investment chart that shows how funds move from strategies to asset classes and outcomes. This makes it easier to understand allocation patterns and communicate insights clearly.

Structured investment performance reporting delivers practical advantages for investors, portfolio managers, and businesses alike, grounding every financial decision in verified data rather than assumption or guesswork. Key benefits include:
For investment performance reports to serve their purpose, they need to be consistent, readable, and grounded in accurate data. Best practices include:
Even with reliable tools in place, tracking financial data and portfolio outcomes can become challenging when information is complex, and market conditions shift frequently. Common issues include:
A solid investment report includes portfolio value, asset allocation, return metrics, benchmark comparisons, risk indicators, and a brief section of performance analysis.
Reporting frequency should be set at monthly, quarterly, or annual intervals to track shifts and keep portfolio performance data current and accurate.
Investment performance reporting should use consistent calculation methods, appropriate benchmarks, and a clear layout so returns, risks, and comparisons can be properly evaluated.
Consistent investment performance reporting is what separates reactive guesswork from disciplined, data-driven portfolio management.
Measuring returns systematically, benchmarking results against relevant indexes, and tracking risk at every stage gives investors the clarity they need to act on real evidence rather than assumptions or gut instinct.
The methods in this guide walk through each layer of the reporting process, from building an Excel tracker to reading portfolio charts.
Apply these practices on a regular schedule, monthly or quarterly at a minimum, and your financial decisions will reflect a far more accurate picture of where your investments currently stand and where they are realistically headed.
How much did you enjoy this article?


Calculate accounts receivable turnover ratio to measure credit collection speed, improve cash flow, and strengthen your financial strategy. Read on!

Change Management KPIs are the key to tracking adoption, performance, and ROI during transitions. Find out which metrics matter. Read on!

Data collection methods and techniques determine the quality of every insight you act on. Explore key approaches for gathering reliable data. Read on!


