How to convert XML to Excel? You’re not alone if you’ve ever wrestled with messy XML files. XML is everywhere—from e-commerce product feeds to government datasets. But turning that data into something useful can be frustrating.
XML files are structured, but they’re not easy to read. Excel, on the other hand, is familiar and user-friendly. That’s why many turn to solutions on how to convert XML to Excel. Whether analyzing sales data or building dashboards, Excel gives you a cleaner, faster way to work.
Big businesses rely on accurate data transformation. A minor formatting issue can derail reports. If you work in finance, clean data isn’t optional. It’s essential. And with functions like trend analysis in Excel, your reporting doesn’t have to stop at tables. It can lead to better decisions.
There’s another benefit. Once your XML is in Excel, you can use a month-to-month comparison Excel chart to monitor growth or spot issues. This makes trends more visible and helps avoid blind spots.
So, how can you convert XML to Excel without losing structure or detail? This guide will show you how to bring structured data into Excel smartly.
No technical background needed. You only need a straightforward process, a little patience, and Excel’s built-in tools.
Ready? Let’s get rolling…
Are you tired of squinting at lines of XML code? Converting that data into Excel doesn’t just clean up the mess—it transforms how you work with it. Let’s break down why converting XML to Excel is more than convenience:
The charts below were created in Excel using ChartExpo:
Have you ever opened an XML file and felt lost? You’re not alone. XML is great for machines, not so much for humans. But Excel can fix that, and there’s more than one way to bring structure to that chaos.
Here are the most effective ways to convert XML into clean, workable spreadsheets.
You’ve got an XML file and you need it in Excel—fast. Let’s make it practical – no guesswork, no stress.
Your XML file data looks something like this:
Data analysis needs more than tables and basic bar charts – it needs clear, insightful visuals. XML is structured, but not visual, and Excel helps make sense of that data. But let’s be honest—Excel charts can be underwhelming. It requires clear, compelling visuals that tell a story.
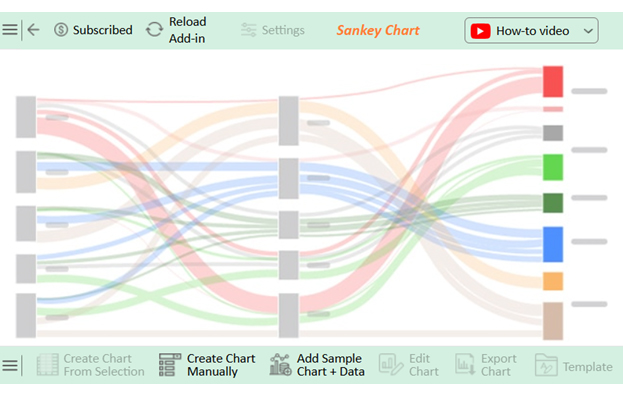
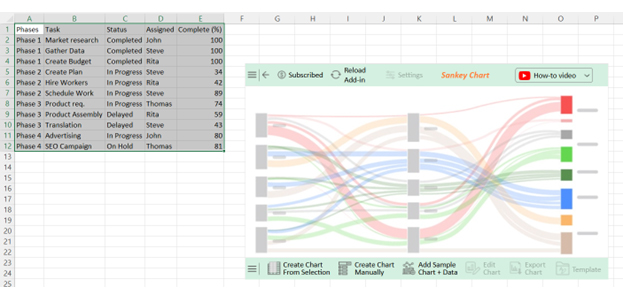
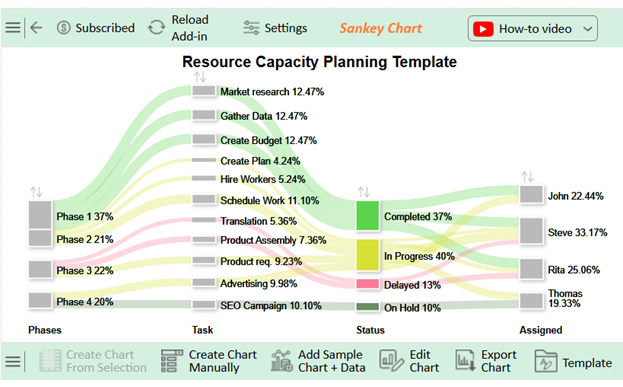
That’s where ChartExpo—a powerful chart add-in for Excel steps in. It takes your converted XML data into stunning, insightful visuals. This tool is fast, flexible, and requires no coding.
How to Install ChartExpo in Excel?
ChartExpo charts are available both in Google Sheets and Microsoft Excel. Please use the following CTAs to install the tool of your choice and create beautiful visualizations with a few clicks in your favorite tool.
Let’s visualize and analyze this sample data in Excel using ChartExpo.
Phases | Task | Status | Assigned | Complete (%) |
Phase 1 | Market research | Completed | John | 100 |
Phase 1 | Gather Data | Completed | Steve | 100 |
Phase 1 | Create Budget | Completed | Rita | 100 |
Phase 2 | Create Plan | In Progress | Steve | 34 |
Phase 2 | Hire Workers | In Progress | Rita | 42 |
Phase 2 | Schedule Work | In Progress | Steve | 89 |
Phase 3 | Product req. | In Progress | Thomas | 74 |
Phase 3 | Product Assembly | Delayed | Rita | 59 |
Phase 3 | Translation | Delayed | Steve | 43 |
Phase 4 | Advertising | In Progress | John | 80 |
Phase 4 | SEO Campaign | On Hold | Thomas | 81 |
Have you ever tried reading raw XML? It’s like staring at organized chaos—rows of tags, nested elements, and no clear formatting. But when you open that file in Excel, everything suddenly makes sense.
Excel doesn’t just clean it up. It gives your data a new life, and here’s how:
Turning an Excel sheet into XML without a mess is not as simple as hitting “Save As”. You need a plan to get clean, structured XML, and Excel gives you the tools. But how you use them matters. Follow these tips to achieve a seamless conversion:
Yes, you can parse XML in Excel. Use the Developer tab or Power Query to import the file. Excel will break it into rows and columns, which helps with data analysis and reporting.
Yes, you can edit XML in Excel:
Converting XML to Excel makes your data usable. XML is great for structure, but hard to read. Excel turns that structure into something clear. Tables, rows, and filters make everything easier to understand.
Once in Excel, you can do more than read your data. You can sort, search, and apply formulas. This is key to making informed decisions and helps prepare for deeper analysis.
Want to visualize trends? Learn how to create a chart in Excel. Line charts, bar charts, and scatter plots are all a few clicks away. These help bring your data to life.
Need to present reports? Use financial graphs and charts in Excel. They show growth, losses, and forecasts. It’s how raw data turns into boardroom insights.
Got overlapping metrics? No problem. Excel can handle that, too. You can learn how to show overlapping data in Excel using combo charts and secondary axes.
Converting XML to Excel is the first step, but what comes after is even more powerful. With Excel’s tools, you can analyze, visualize, and communicate your data better – install ChartExpo for advanced charts.