• Home
  • Tools dropdown img
    • Spreadsheet Charts

      • ChartExpo for Google Sheets
      • ChartExpo for Microsoft Excel
    • Power BI Charts

      • Power BI Custom Visuals by ChartExpo
    • Word Cloud

  • Charts dropdown img
    • Chart Category

      • Bar Charts
      • Circle Graphs
      • Column Charts
      • Combo Charts
      • Comparison Charts
      • Line Graphs
      • PPC Charts
      • Sentiment Analysis Charts
      • Survey Charts
    • Chart Type

      • Box and Whisker Plot
      • Clustered Bar Chart
      • Clustered Column Chart
      • Comparison Bar Chart
      • Control Chart
      • CSAT Survey Bar Chart
      • CSAT Survey Chart
      • Dot Plot Chart
      • Double Bar Graph
      • Funnel Chart
      • Gauge Chart
      • Likert Scale Chart
      • Matrix Chart
      • Multi Axis Line Chart
      • Overlapping Bar Chart
      • Pareto Chart
      • Radar Chart
      • Radial Bar Chart
      • Sankey Diagram
      • Scatter Plot Chart
      • Slope Chart
      • Sunburst Chart
      • Tornado Chart
      • Waterfall Chart
      • Word Cloud
    • Google Sheets
      Microsoft Excel
  • Services
  • Pricing
  • Contact us
  • Blog
  • Support dropdown img
      • Gallery
      • Videos
      • Contact us
      • FAQs
      • Resources
    • Please feel free to contact us

      atsupport@chartexpo.com

Categories
All Data Visualizations Data Analytics Surveys
Add-ons/
  • Google Sheets
  • Microsoft Excel
  • Power BI
All Data Visualizations Data Analytics Surveys
Add-ons
  • Google Sheets
  • Microsoft Excel
  • Power BI

We use cookies

This website uses cookies to provide better user experience and user's session management.
By continuing visiting this website you consent the use of these cookies.

Ok

ChartExpo Survey


Home > Blog > Data Analytics

How to Calculate Contribution Margin: Strategic Insights

How to calculate contribution margin is a game changer. It reveals how much money is left after subtracting variable costs to cover fixed expenses.

How to Calculate Contribution Margin

Imagine this: you run a bakery business. You know your costs, selling price, and profit margin, but you’re unsure how to find the contribution margin.

How to calculate contribution margin might seem hard, but it’s simpler than you think. This important measure helps with pricing, product mix, and cost control decisions.

Imagine being able to assess the profitability of each product you sell. With the knowledge of contribution margin, you can do just that. It shows how much sales revenue will cover fixed costs and generate profit.

How to calculate contribution margin is a key managerial skill for any business. This doesn’t mean juggling complicated formulas and complex math. It means gaining a little bit of knowledge that can help improve your business in the long term.

Let’s learn how to calculate contribution margin in a simple, business-friendly way. You can use this knowledge to inform your pricing strategy and cost control.

Table of Contents:

  1. Define Contribution Margin.
  2. Why Does Contribution Margin Matter?
  3. What is the Difference between Contribution Margin vs. Gross Margin?
  4. What is the Contribution Margin Formula & Contribution Margin Ratio?
  5. How to Examine Contribution Margin?
  6. Wrap Up

First…

Define Contribution Margin.

Definition: Contribution margin is the revenue remaining after deducting variable costs associated with producing goods or services. It indicates the portion of sales revenue contributing to covering fixed costs and generating profit.

To calculate the contribution margin, subtract variable costs, such as materials and direct labor, from sales revenue. The resulting figure represents the amount available to cover fixed costs and contribute to profit.

Contribution margin is essential for assessing the profitability of individual products or services and making data-driven decisions. A higher contribution margin indicates greater profitability. Conversely, a lower margin suggests the need for cost reduction or pricing adjustments. By analyzing contribution margins, you can optimize your product mix, pricing strategies, and overall profitability.

Why Does Contribution Margin Matter?

In business, contribution margin is a crucial financial metric. It provides insight into profitability and guides strategic decision-making. Hence, it is vital to understand why it matters to optimize performance and achieve your financial goals.

So, why does the contribution margin matter?

  • Profitability assessment: You can use contribution margin to ascertain the profitability of individual products or services. This entails computing the contribution margin for each product. It shows the most profitable ones in terms of covering fixed costs and profit generation.
  • Pricing decisions: Pricing decisions are heavily influenced by the contribution margin. Products with higher contribution margins can support higher prices. Those with lower margins may require adjustments in pricing strategies or cost-cutting initiatives to sustain their profits.
  • Cost-Volume-Profit (CVP) analysis: The contribution margin is used in cost-volume-profit analysis. It helps determine the sales level necessary to cover the fixed costs and meet the targeted earnings. It is an essential tool for financial planning and forecasting.
  • Impact analysis: This is another way the contribution margin applies. It evaluates the effect of sales volume or pricing changes on profitability. The effect on overall profitability can be estimated by observing how the changes impact the contribution margin. This helps make informed decisions regarding company strategy or planning.
  • Optimization of operations: The contribution margin is useful in optimizing operations for a company’s long-term success and profitability. It guides how profitability can be maximized. The metric aids in decision-making regarding product mix, pricing strategy, and cost control.

What is the Difference between Contribution Margin vs. Gross Margin?

Contribution margin and gross margin are important financial metrics businesses use to assess profitability. While they share similarities, they have distinct characteristics and serve different purposes. Here are the differences between contribution margin vs. gross margin.

Aspect Contribution Margin Gross Margin
Definition Represents the portion of sales revenue that covers variable costs and contributes to covering fixed costs Represents the percentage of revenue remaining after deducting only the cost of goods sold (COGS)
Calculation Calculated by subtracting variable costs from sales revenue

(Contribution Margin=Revenueˆ’Variable Costs)

Calculated by subtracting only the COGS from sales revenue

(Contribution Margin Ratio= (Contribution Margin/Revenue) ×100%)

Components Includes all variable costs associated with producing and selling a product or service Includes only the direct costs of producing goods or services
Usefulness Helps assess the profitability of individual products or services and their contribution to covering fixed costs Provides insights into the profitability of the overall business operations and its ability to cover operating expenses
Decision-making Guides pricing decisions and product mix strategies Informs cost control measures and production optimization efforts

What is the Contribution Margin Formula & Contribution Margin Ratio?

The contribution margin helps to assess the profitability of individual products or services. Understanding the contribution margin formula and contribution margin ratio is essential for evaluating profitability and making informed business decisions.

  •     Contribution Margin Formula

This formula calculates the revenue remaining after deducting variable costs associated with producing and selling a product/service. The contribution margin formula is as follows:

Contribution Margin = Sales Revenue – Variable Costs

  •       Contribution Margin Ratio Formula

This formula calculates the percentage of sales revenue that contributes to covering fixed costs and generating profit. The contribution margin ratio formula is as follows:

How to Calculate Contribution Margin Formula

In both formulas:

  • Sales Revenue: The total revenue generated from selling products or services.
  • Variable Costs: The costs directly attributable to producing and selling a product or service. Such as materials, direct labor, and variable overhead expenses.

How to Examine Contribution Margin?

Data analysis can be as fun as a Rubik’s cube. But often as frustrating as trying to solve one blindfolded. Data visualization is your trusty sidekick when analyzing the contribution margin.

Excel, while reliable, can be like a bicycle in the world of sports cars when visualizing data. This is where ChartExpo swoops in, providing a dynamic solution to Excel’s limitations in sports analytics. With ChartExpo, you can transform your sports data into captivating visuals, making performance analysis a breeze.

Let’s learn how to install ChartExpo in Excel.

  1. Open your Excel application.
  2. Open the worksheet and click the “Insert” menu.
  3. You’ll see the “My Apps” option.
  4. In the Office Add-ins window, click “Store” and search for ChartExpo on my Apps Store.
  5. Click the “Add” button to install ChartExpo in your Excel.

ChartExpo charts are available both in Google Sheets and Microsoft Excel. Please use the following CTAs to install the tool of your choice and create beautiful visualizations with a few clicks in your favorite tool.

Contribution margin Examples

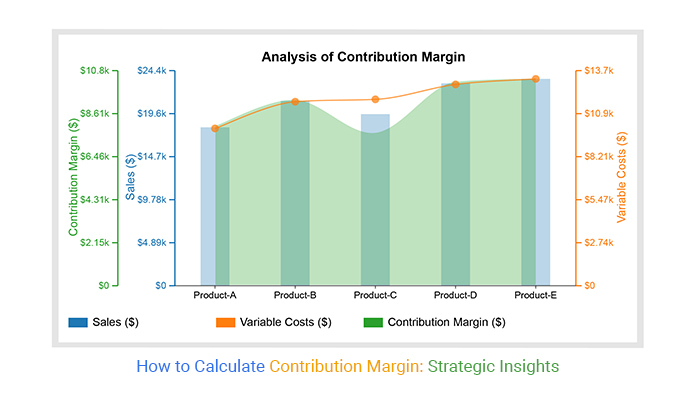
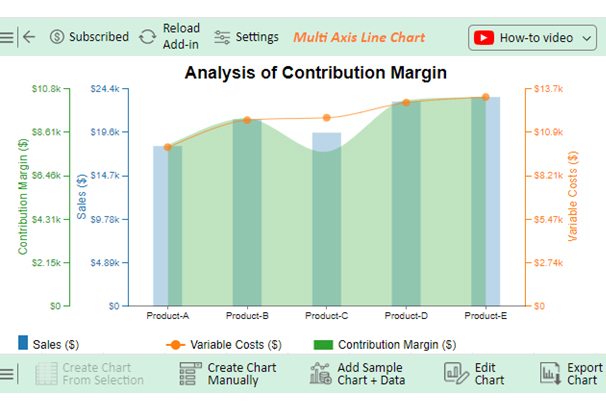
Let’s say you want to analyze the contribution margin sample data below.

Product Sales ($) Variable Costs ($) Contribution Margin ($)
Product-A 18,000 10,000 8,000
Product-B 21,000 11,700 9,300
Product-C 19,500 11,850 7,650
Product-D 23,000 12,800 10,200
Product-E 23,500 13,150 10,350

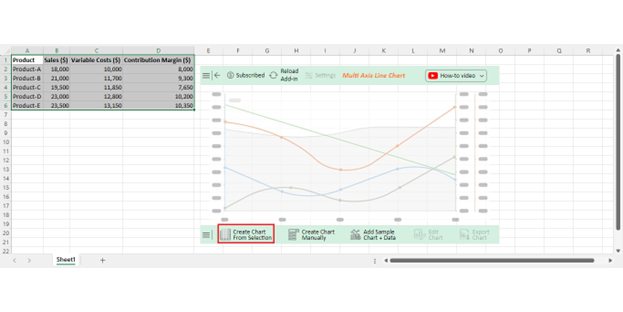
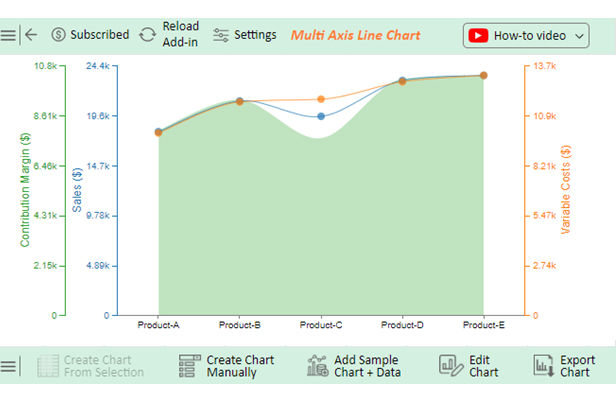
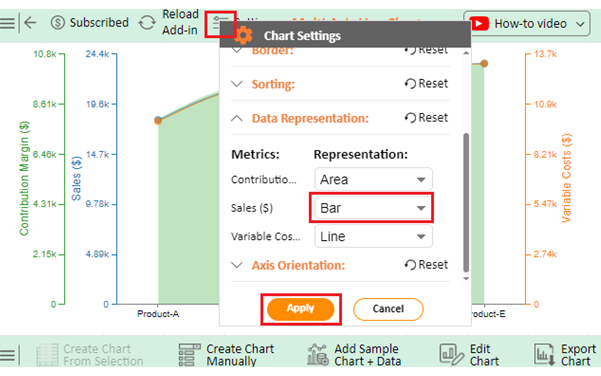
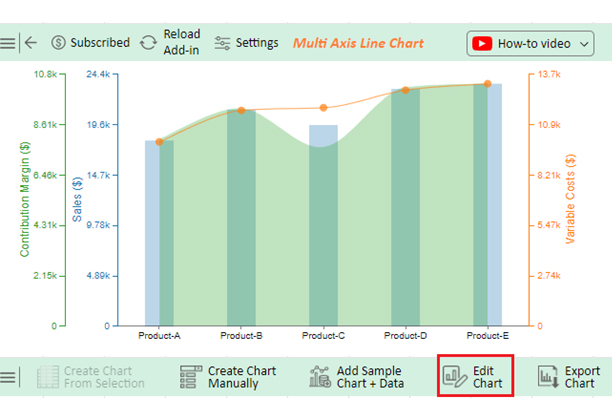
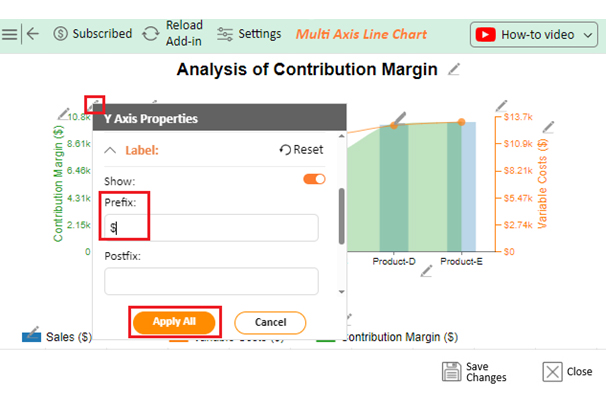
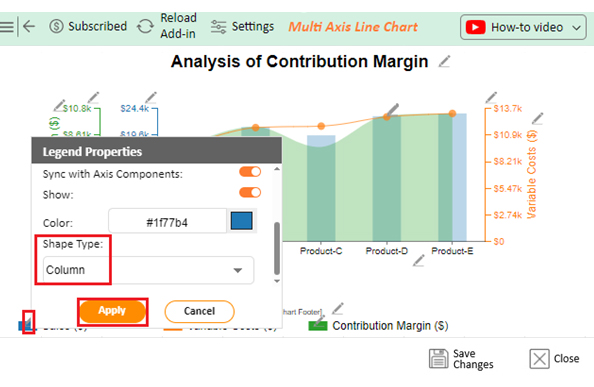
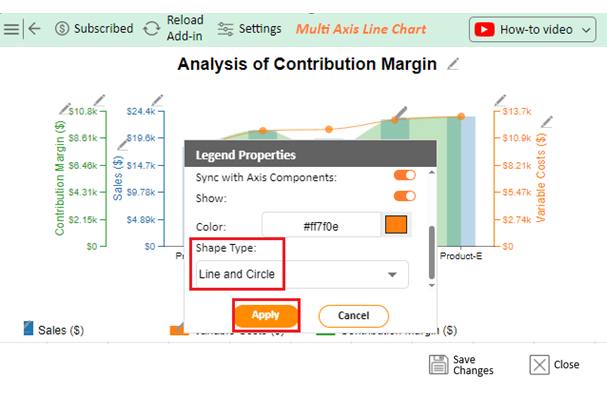
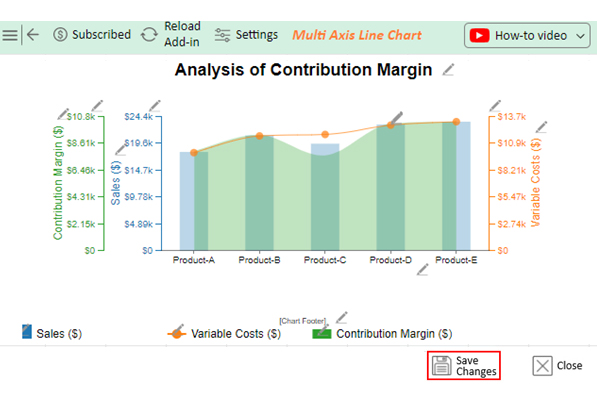
Follow these steps to visualize this data in Excel using ChartExpo and glean valuable insights.

  • To get started with ChartExpo, install ChartExpo in Excel.
  • Now Click on My Apps from the INSERT menu.
insert chartexpo in excel
  • Choose ChartExpo from My Apps, then click Insert.
open chartexpo in excel
  • Once it loads, scroll through the charts list to locate and choose the “Multi-Axis Line Chart”.
search multi axis line chart in excel
  • Click the “Create Chart From Selection” button after selecting the data from the sheet, as shown.
Create Chart From Selection After Learning How to Calculate Contribution Margin
  • ChartExpo will generate the visualization below for you.
Initial Visual After Learning How to Calculate Contribution Margin
  • Click on Settings and change the “Data Representation” of Profit Markup into Bar as follows.
Data Representation After Learning How to Calculate Contribution Margin
  • If you want to add anything to the chart, click the Edit Chart button:
Edit Chart After Learning How to Calculate Contribution Margin
  • Click the pencil icon next to the Chart Header to change the title.
  • It will open the properties dialog. Under the Text section, you can add a heading in Line 1 and enable Show.
  • Give the appropriate title of your chart and click the Apply button.
Add Chart Header After Learning How to Calculate Contribution Margin
  • Add dollar sign with Variable cost values:
Add Dollar Sign in Variable Costs After Learning How to Calculate Contribution Margin
  • Add dollar sign with Sales values:
Add Dollar Sign in Sales After Learning How to Calculate Contribution Margin
  • Add a dollar sign with Contribution Margin values:
Add Dollar Sign in Variable Contribution Margin After Learning How to Calculate Contribution Margin
  • Change the Legend shape of Sales to Column and click the Apply button.
Change Legend Shape of Sales After Learning How to Calculate Contribution Margin
  • Change the Legend shape of Variable Costs into a Line and Circle and click the Apply button.
Change Legend Shape of Varible Costs After Learning How to Calculate Contribution Margin
  • Click the Save Changes button to persist the changes made to the chart.
Save Change of Visuals After Learning How to Calculate Contribution Margin
  • Your final Multi Axis Line Chart will look like the one below.
Final How to Calculate Contribution Margin

Insights

  • Product E has the highest contribution margin.
  • Product C has the lowest contribution margin.
  • Sales revenues for products B, D, and E are higher than other products, suggesting stronger market demand.

FAQs

What is the contribution margin in simple words?

Contribution margin is what remains from revenue after subtracting the variable costs of producing a product or service. It is part of the sales revenue that covers the fixed costs and makes a profit.

What does the contribution margin ratio tell you?

The contribution margin ratio tells you the percentage of sales revenue covering fixed costs and making a profit. It helps assess the efficiency of cost structure and profitability of each unit sold.

What describes the contribution margin in a business?

The contribution margin describes the profitability of each unit sold in a business. It indicates how much revenue remains after deducting variable costs. This helps assess the profitability of products or services and their contribution to covering fixed costs and generating profit.

Wrap Up

Learning how to calculate contribution margin is crucial to assess your company’s profitability accurately. You can now follow the simple steps above to obtain useful information about your business’s financial results. Then, use it to make vital choices to enhance operations and increase profits.

Calculating contribution margin begins with identifying the revenue generated from sales. This revenue represents the total income derived from selling products or services.

Next, you subtract variable expenses linked to producing or selling goods or services. Variable costs change with the amount of production or sales. Generally, they include outlays like materials, direct labor, and variable overheads.

Once you subtract the variable costs from revenue, the resulting figure represents the contribution margin. It provides valuable insights into the profitability of each unit sold.

Contribution margin analysis helps assess cost structures and pricing strategies in a business. Higher contribution margins suggest better profitability per unit sold. Lower contribution margins are a call to action to consider cost-saving measures and revision of pricing strategies.

To sum up, how to calculate contribution margin helps you drive results, generate profits, and secure your financial future. With this information at your fingertips, you can employ a data-driven approach to make decisions. Ultimately, you can increase efficiency, boost profitability, and stay competitive in dynamic markets.

How much did you enjoy this article?

PBIAd1
Start Free Trial!
135069

Related articles

next previous
Data Analytics31 min read

Data Analysis Without Nonsense: Fix the Right Problem, Fast

Data analysis can mislead when metrics look right but outcomes fail. Learn how to spot red flags, fix failures, and make better decisions. Read on!

Data Analytics29 min read

Variance Analysis Isn’t a Math Problem, It’s a Trust Problem

Variance analysis helps identify what went wrong, who owns it, and what to do next. Use it to drive decisions, not just reports. Learn more!

Data Analytics10 min read

Supplier Comparison Template: Download It Now

A supplier comparison template streamlines vendor evaluation by comparing cost and quality. Click here to learn its benefits and how to analyze them.

Data Analytics32 min read

Ecommerce Analytics: How to Fix What It Often Gets Wrong

Ecommerce analytics often lead to mixed signals and costly misreads. Fix attribution gaps, align teams, and act on the right data. Get started now!

Data Analytics30 min read

When Sales Funnel Breaks: Failures, Fixes, & Funnel Debt

Is your sales funnel hiding costly gaps? Learn how pipeline stalls, false metrics, and handoff chaos could be draining revenue. Get started now!

ChartExpo logo

Turn Data into Visual
Stories

CHARTEXPO

  • Home
  • Gallery
  • Videos
  • Services
  • Pricing
  • Contact us
  • FAQs
  • Privacy policy
  • Terms of Service
  • Sitemap

TOOLS

  • ChartExpo for Google Sheets
  • ChartExpo for Microsoft Excel
  • Power BI Custom Visuals by ChartExpo
  • Word Cloud

CATEGORIES

  • Bar Charts
  • Circle Graphs
  • Column Charts
  • Combo Charts
  • Comparison Charts
  • Line Graphs
  • PPC Charts
  • Sentiment Analysis Charts
  • Survey Charts

TOP CHARTS

  • Sankey Diagram
  • Likert Scale Chart
  • Comparison Bar Chart
  • Pareto Chart
  • Funnel Chart
  • Gauge Chart
  • Radar Chart
  • Radial Bar Chart
  • Sunburst Chart
  • see more
  • Scatter Plot Chart
  • CSAT Survey Bar Chart
  • CSAT Survey Chart
  • Dot Plot Chart
  • Double Bar Graph
  • Matrix Chart
  • Multi Axis Line Chart
  • Overlapping Bar Chart
  • Control Chart
  • Slope Chart
  • Clustered Bar Chart
  • Clustered Column Chart
  • Box and Whisker Plot
  • Tornado Chart
  • Waterfall Chart
  • Word Cloud
  • see less

RESOURCES

  • Blog
  • Resources
  • YouTube
SIGN UP FOR UPDATES

We wouldn't dream of spamming you or selling your info.

© 2025 ChartExpo, all rights reserved.