• Home
  • Tools dropdown img
    • Spreadsheet Charts

      • ChartExpo for Google Sheets
      • ChartExpo for Microsoft Excel
    • Power BI Charts

      • Power BI Custom Visuals by ChartExpo
    • Word Cloud

  • Charts dropdown img
    • Chart Category

      • Bar Charts
      • Circle Graphs
      • Column Charts
      • Combo Charts
      • Comparison Charts
      • Line Graphs
      • PPC Charts
      • Sentiment Analysis Charts
      • Survey Charts
    • Chart Type

      • Box and Whisker Plot
      • Clustered Bar Chart
      • Clustered Column Chart
      • Comparison Bar Chart
      • Control Chart
      • CSAT Survey Bar Chart
      • CSAT Survey Chart
      • Dot Plot Chart
      • Double Bar Graph
      • Funnel Chart
      • Gauge Chart
      • Likert Scale Chart
      • Matrix Chart
      • Multi Axis Line Chart
      • Overlapping Bar Chart
      • Pareto Chart
      • Radar Chart
      • Radial Bar Chart
      • Sankey Diagram
      • Scatter Plot Chart
      • Slope Chart
      • Sunburst Chart
      • Tornado Chart
      • Waterfall Chart
      • Word Cloud
    • Google Sheets
      Microsoft Excel
  • Services
  • Pricing
  • Contact us
  • Blog
  • Support dropdown img
      • Gallery
      • Videos
      • Contact us
      • FAQs
      • Resources
    • Please feel free to contact us

      atsupport@chartexpo.com

Categories
All Data Visualizations Data Analytics Surveys
Add-ons/
  • Google Sheets
  • Microsoft Excel
  • Power BI
All Data Visualizations Data Analytics Surveys
Add-ons
  • Google Sheets
  • Microsoft Excel
  • Power BI

We use cookies

This website uses cookies to provide better user experience and user's session management.
By continuing visiting this website you consent the use of these cookies.

Ok

ChartExpo Survey


Home > Blog > Google Sheets

Google Sheets Query Function: A Visual Approach

Google Sheets Query—Have you ever wondered how powerful it is?

Google Sheets Query Function

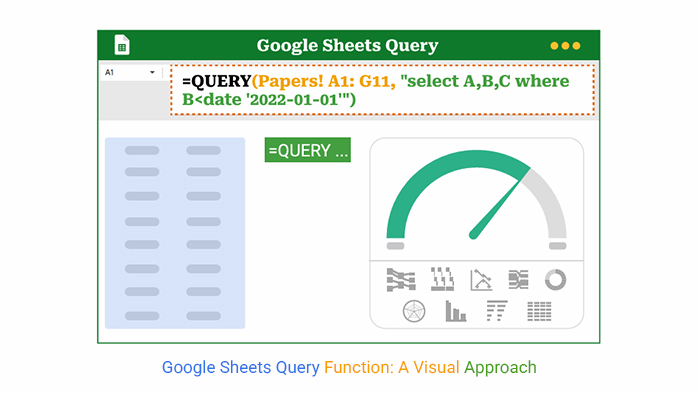
You’ve come to the right place. Every day, people use Google Sheets to manage sales, marketing, inventory, and budgets. However, once data accumulates, scrolling and filtering become insufficient. That’s where the Google Sheets query comes in. It enables you to extract insights from messy data using clean, SQL-style commands.

Let’s say you’re handling inventory tracking in Google Sheets. You’ve got hundreds of rows, and your boss needs a report now. With one Query, you can filter items by category, check stock levels, and even sort by supplier. There are no dragging formulas or manual tweaks.

Now, assume you’re using a Google Sheet to-do list template to manage a project. The list becomes lengthy, and you want to view only the pending tasks. Instead of searching row by row, a query can help grab what you need in seconds.

Most people never move past basic formulas. But those who do? They spot patterns more quickly, make more informed decisions, and stay ahead of the curve. And that’s where I came in. In this guide, I will help you learn how to turn raw data into insights.

Let’s dive in.

Table of Contents:

  1. What is the Google Sheets Query Function?
  2. Why Use the Query in Google Sheets?
  3. Google Sheets Query Syntax Explained
  4. Google Sheets Query Examples
  5. How to Use the Google Sheets Query Function?
  6. How to Use Google Sheets Query for Analysis?
  7. Benefits of Using the Google Sheets Query Function
  8. Best Practices of Google Sheet Query
  9. FAQs
  10. Wrap Up

What is the Google Sheets Query Function?

Definition: The Google Sheets query function lets you search, filter, and reshape your data using SQL-style commands. It’s powerful, flexible, and saves time. You can combine this function with tools like Google Sheets slicers for dynamic filtering. Also, you can use it to prep clean data for a budget on Google Sheets. It works great with large datasets and keeps your formulas simple.

It doesn’t matter whether you’re new to the field or an advanced practitioner. Query helps you analyze smarter and faster. All this with less frustration and more control.

Why Use the Query in Google Sheets?

Have you ever felt overwhelmed by endless rows in Google Sheets? You’re not alone. Many people spend hours filtering, copying, and correcting formulas. All this when a smarter option is waiting.

Here’s why the Google Sheets query function is worth using:

  • It simplifies complex lookups: Using VLOOKUP for Google Sheets works fine until your data grows or changes often. Query lets you search across columns, apply multiple filters, and update everything with one line of code.
  • It’s faster for scenario testing: Running what-if analysis in Google Sheets becomes easier with Query. You can change conditions and instantly see how totals or trends shift without writing multiple formulas.
  • It saves time on reports: Instead of building multiple tabs or dragging formulas, Query gives you dynamic views with fewer steps. You can group, sort, and filter data directly in your original sheet.
  • It works well with big data: Large datasets slow down formulas. Query runs faster and can handle more rows without breaking your sheet.
  • It plays nicely with filters: Pair it with Google Sheets slicers, and your reports become interactive. Viewers can explore different filters without editing the actual sheet.
  • It’s flexible and powerful: Query supports text, numbers, dates, and conditions in a clean format. Once you learn the syntax, you’ll use it almost every day.

Google Sheets Query Syntax Explained

Here’s a simple syntax of QUERY:

=QUERY(data, query, [ headers])

I know. Learning a new function can feel intimidating until someone breaks it down clearly and concisely. The Google Sheets query syntax might look complex, but it’s pretty friendly once you understand the basics:

  • data: The range of cells you want to pull information from (for example, A1:E20).
  • query: The instruction you give, written like an SQL command (for example, “SELECT A, B WHERE C > 100”).
  • headers: Optional. Tells Google Sheets how many header rows are at the top of your data range.

Here are the core keywords that power your queries:

  • SELECT: This is where you choose the columns you want to see. For example, SELECT A, B pulls only columns A and B from your data.
  • WHERE: Use this to filter the rows based on a condition. For instance, WHERE B > 100 will return only rows where the value in column B is more than 100.
  • ORDER BY: Want to sort your results? Use ORDER BY B DESC to sort by column B in descending order. This one is great for ranking values or dates.
  • LIMIT: Too much data? Add LIMIT 5 to show only the first five rows that match your Query. It’s a simple way to focus on what matters most.
  • LABEL: This feature allows you to rename columns in your results. Instead of showing ‘B’ at the top, you can write ‘LABEL B Total Sales’ and make it straightforward for others.

Google Sheets Query Examples

If you’ve made it this far, you’re ready for the fun part—real examples. This is where the Google Sheets query starts to click. Here, you’ll go from guessing to knowing and stop repeating tasks that a single line of code can do for you.

Let’s walk through some everyday use cases that make spreadsheets smarter and faster:

  • Select specific columns: Want to focus on names and emails only? Use: =QUERY(A2:D100, “SELECT A, C”). This shows columns A and C only, skipping the rest.
  • Filter by condition: Let’s say you want to see orders over $500. Easy: =QUERY(A2:D100, “SELECT * WHERE D > 500”). You get all columns, but only for rows where column D is greater than 500.
  • Sort results: Need to rank sales from highest to lowest? Try this: =QUERY(A2:D100, “SELECT A, D ORDER BY D DESC”). It sorts by column D in descending order, where your largest deals appear at the top.
  • Sum a column with a condition: Want total revenue from just one region? Done: =QUERY(A2:D100, “SELECT SUM(D) WHERE B = ‘East'”). This adds up sales (column D) for rows where region (column B) is “East”.
  • Group and aggregate: Trying to get totals by department? Use: =QUERY(A2:D100, “SELECT B, SUM(D) GROUP BY B”). It groups data by column B (say, department) and sums up column D (sales, hours)

How to Use the Google Sheets Query Function?

Getting started with the Google Sheets query function doesn’t require you to be a data scientist. You don’t even need to know SQL by heart. If you can follow a few straightforward steps, you’re all set. Let’s walk through the process using a simple example that works when updating your budget on Google Sheets.

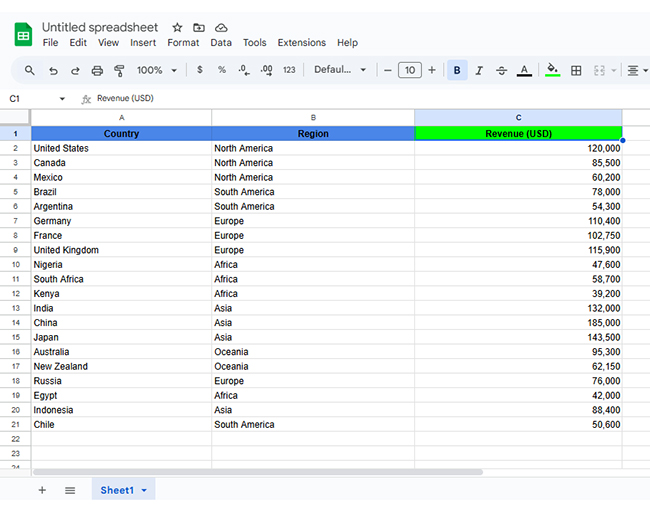
Step 1: Open your Google Sheet: Ensure your data is organized in rows and columns. Each column should have a transparent header at the top.

Google Sheets Query Function

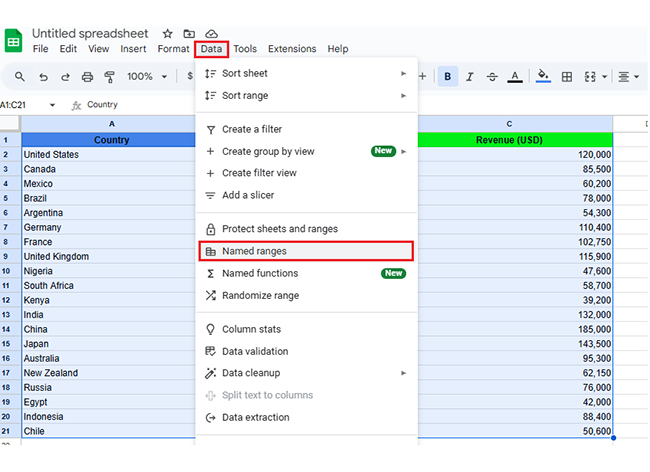
Step 2: Create a custom range name: Highlight your data and go to the Data menu, then click “Named ranges.” This helps you use a clear name instead of cell references, such as A2:D100.

Google Sheets Query Function

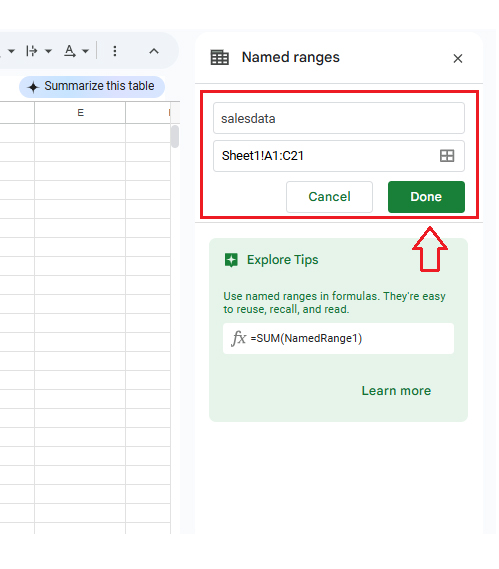
Step 3: Confirm your range: A panel will open on the right. Enter a name for your range and click “Done.”

Google Sheets Query Function

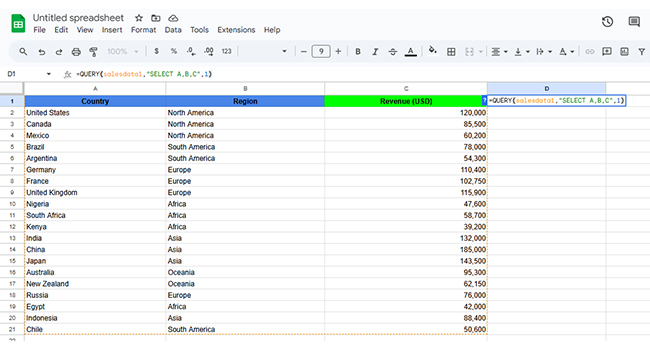
Step 4: Write a simple query formula: Click into an empty cell and type: =QUERY(salesdata1, “SELECT A, B, C”, 1). This will pull columns A, B, and C from your named dataset.

Using SELECT statements: The SELECT clause instructs Google Sheets to return specific columns. For example, SELECT A, C will only display columns A and C.

Google Sheets Query Function

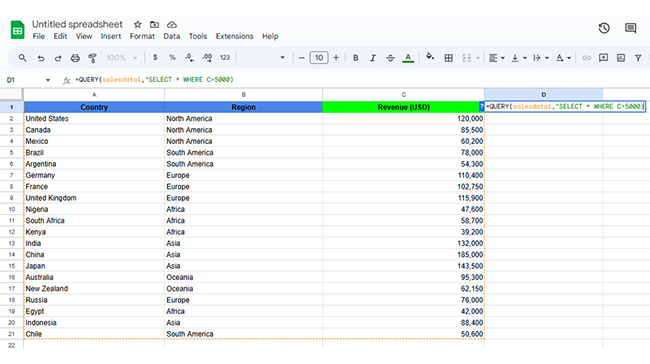
Step 5: Use WHERE to filter data: Use the WHERE clause to return only rows that meet a condition. For example, WHERE C > 5000 pulls all rows where column C is above 5000.

Google Sheets Query Function

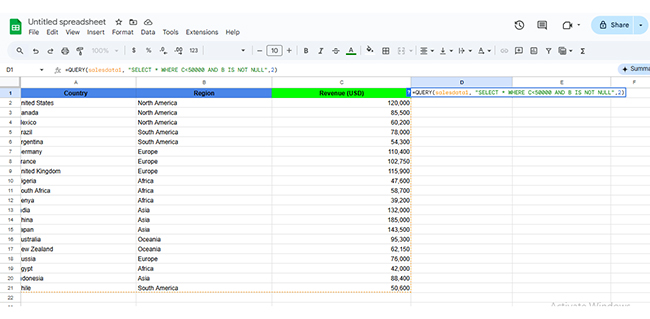
Add Multiple Conditions: You can filter with more than one condition using the AND or OR operator. Try WHERE C > 5000 AND B = ‘East’ to get high sales from a specific region.

Google Sheets Query Function

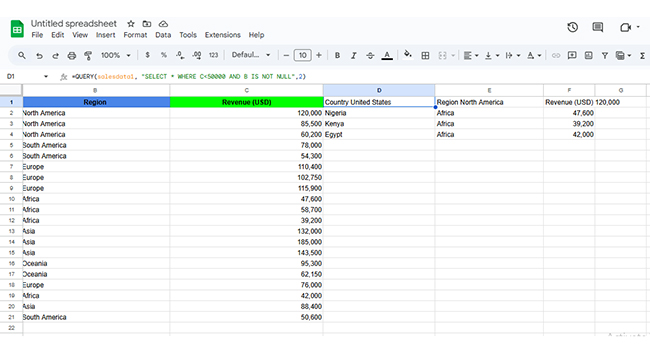
The final result is as shown below:

Google Sheets Query Function

Top 10 ChartExpo Visuals to Use the Query Function in Google Sheets

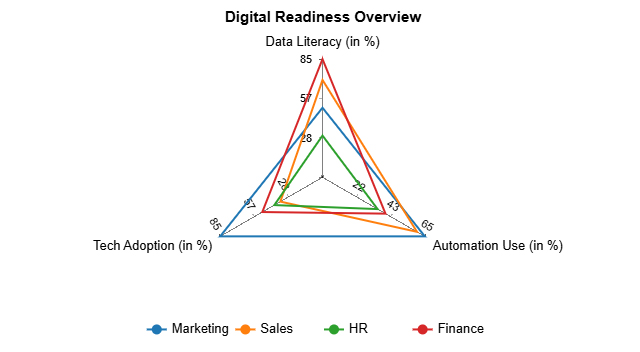
Have you ever looked at rows of data and thought, “This would make more sense in a chart”? You’re not alone. Visuals bring clarity that raw numbers can’t. Thankfully, Google Charts, especially when combined with Google Sheets Query and ChartExpo, turns your spreadsheet chaos into powerful visuals.

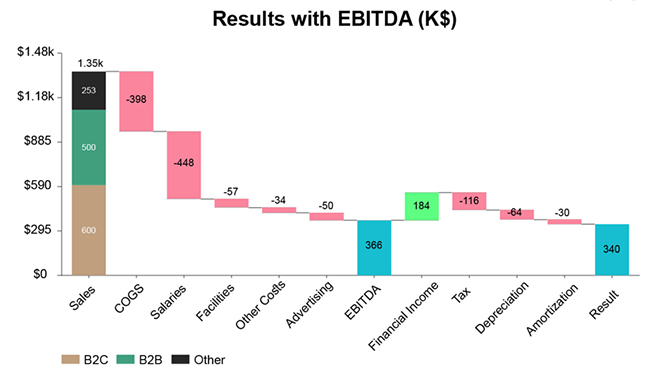
Here are 10 standout charts you can build in Google Sheets with ChartExpo and Query:

  • Sankey Chart: A Sankey Chart illustrates the flow of values from one category to another. It’s perfect for tracking income sources and where the money goes. It’s like a visual representation of a cash flow story.
Google Sheets Query Function
  • Comparison Bar Chart: Want to see which product is winning? This chart lines them up side by side, giving you a clear comparison in seconds.
Google Sheets Query Function
  • Gauge Chart: Think of this like a car speedometer for your team’s KPIs. It shows how close you are to hitting your goals, with live updates from a Google Sheets query.
Google Sheets Query Function
  • Multi Axis Line Chart: Revenue and profit trends don’t have to live in separate graphs. This chart shows multiple trends at once, so you can spot what’s growing—or not.
Google Sheets Query Function
  • Progress Circle Chart: See how far your team has come toward a goal at a glance. It turns raw completion data into a clean, circular visual of progress.
Google Sheets Query Function
  • Heatmap: Colors tell a story here. Whether it’s sales by region or marketing impact, a Heatmap shows where things are heating up—or cooling off.
Google Sheets Query Function
  • Clustered Stacked Bar Chart: It stacks, it groups, it compares. This chart is ideal when juggling multiple metrics, such as department performance across regions.
Google Sheets Query Function
  • Horizontal Waterfall Chart: Follow the money step-by-step. A Horizontal Waterfall Chart breaks down cash flow movements so clearly that your finance team might smile.
Google Sheets Query Function
  • Multi Axis Spider Chart: Need to compare team performance across five skills? This chart spreads it out for you in a way that makes strengths and gaps obvious.
Google Sheets Query Function
  • Stacked Waterfall Chart: EBITDA may sound complex, but this chart makes it visually clear. See how each expense affects your bottom line. No spreadsheet deep dive required.
Google Sheets Query Function

How to Use Google Sheets Query for Analysis?

Data doesn’t speak until you ask the right questions. A Google Sheets query is how you initiate the conversation. It filters noise, organizes chaos, and delivers insights in neat little rows. But let’s be honest—those rows don’t always make the message clear. You might know the numbers, but can your team see the story? That’s where data visualization steps in.

Unfortunately, Google Sheets isn’t precisely a visual genius. This is where ChartExpo comes into play. This tool transforms dry figures into bright, insightful visuals.

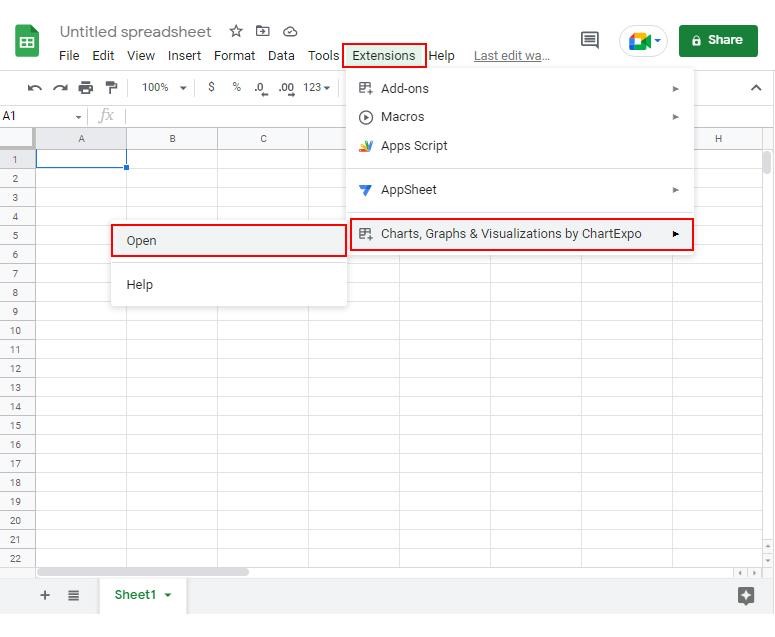
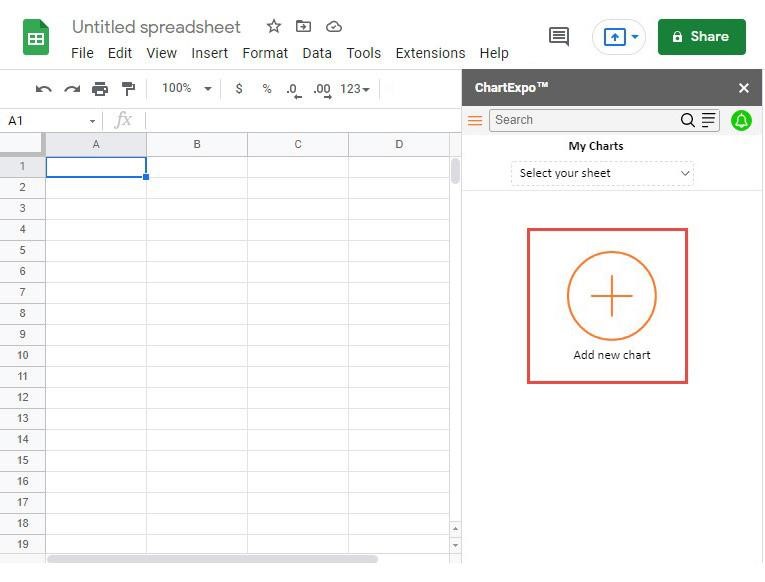
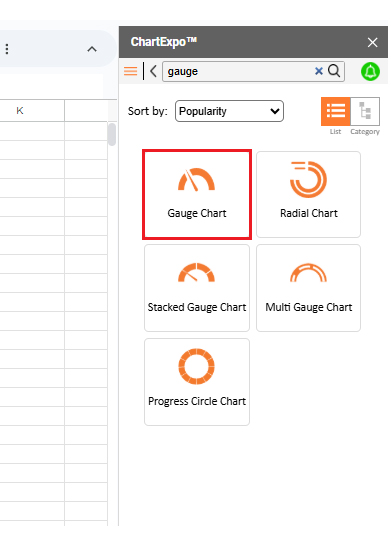
How to Install ChartExpo in Google Sheets?

  1. To start using ChartExpo, download it directly from the Google Sheets program. To do this, select Extensions from the top toolbar.
  2. A menu will appear. Click the Get add-ons option.
  3. Search for ChartExpo, and click on Charts, Graphs & Visualizations by ChartExpo when it appears in the results.
  4. Click the Install button. You will have to confirm your Google account and accept some permissions.

ChartExpo charts are available both in Google Sheets and Microsoft Excel. Please use the following CTAs to install the tool of your choice and create beautiful visualizations in a few clicks in your favorite tool.

Example

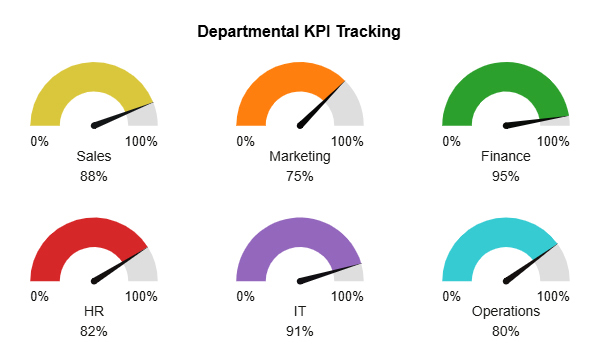
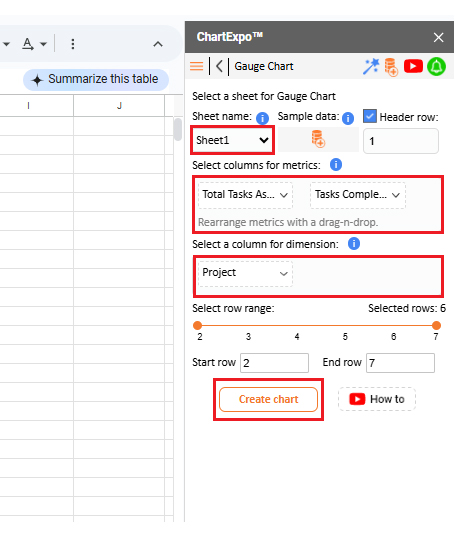
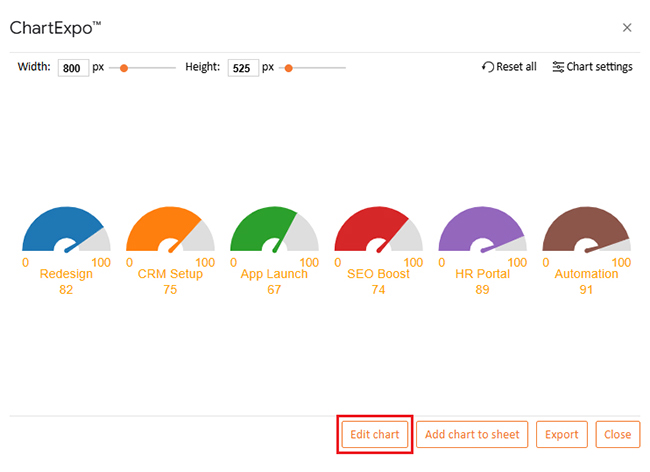
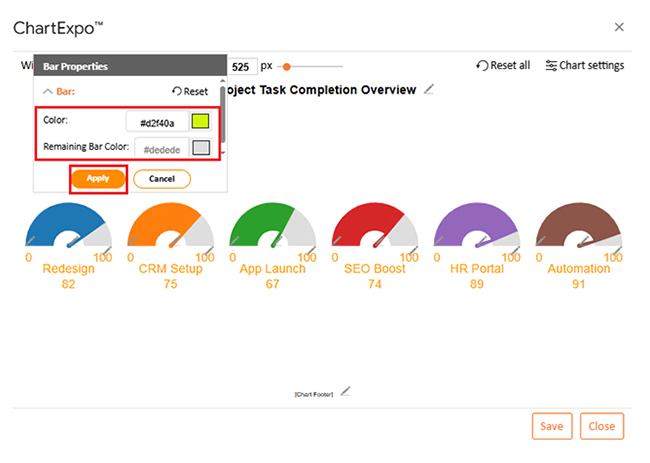
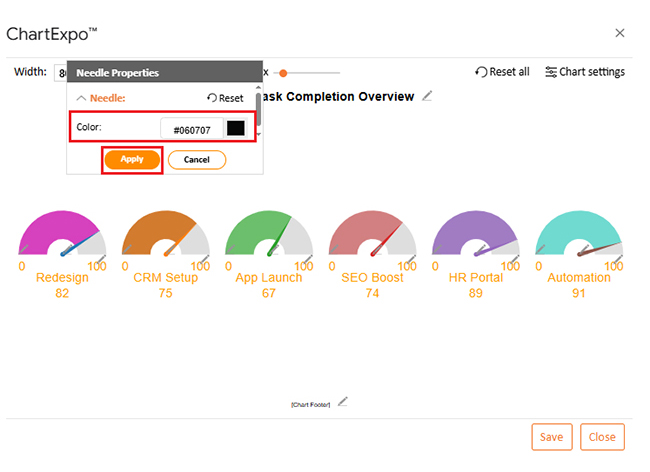
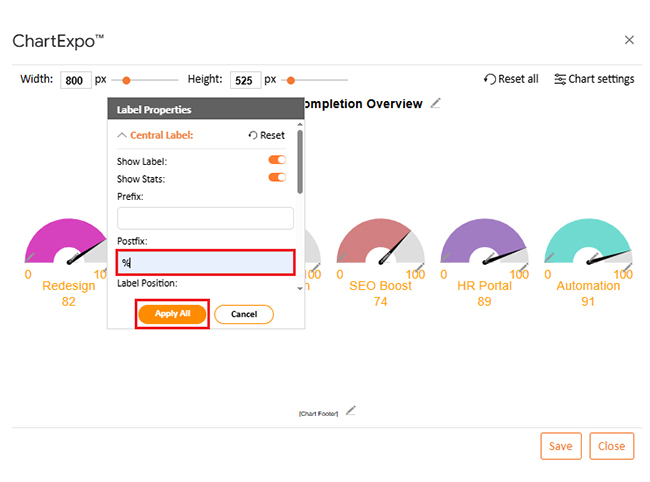
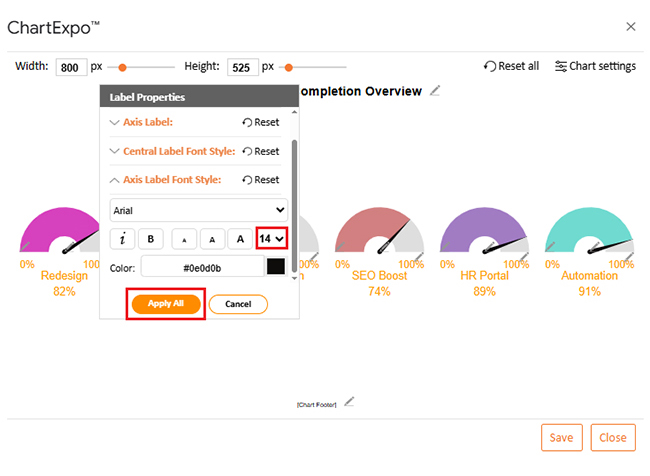
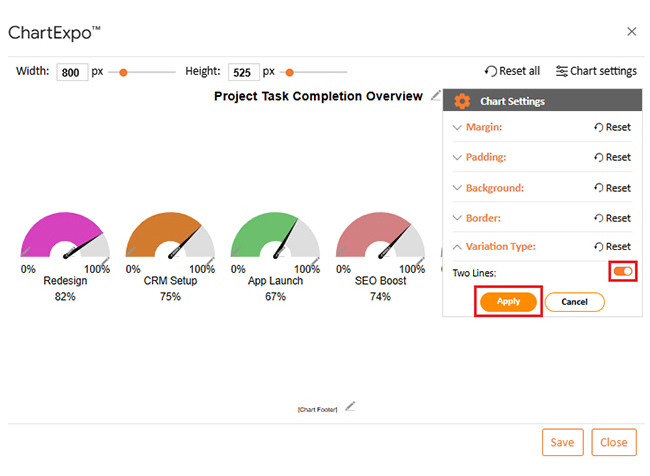
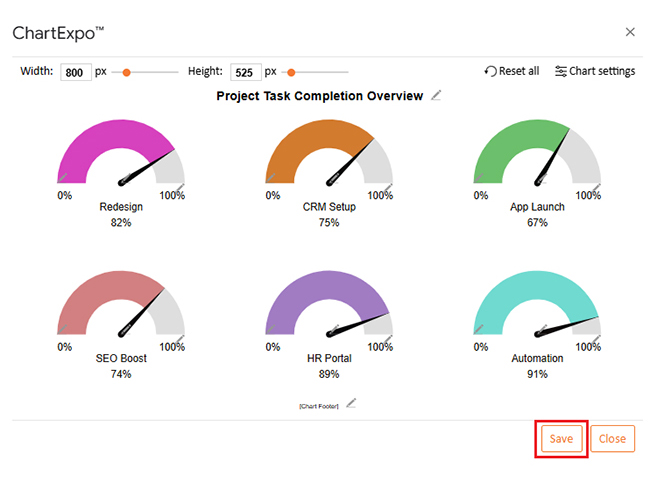
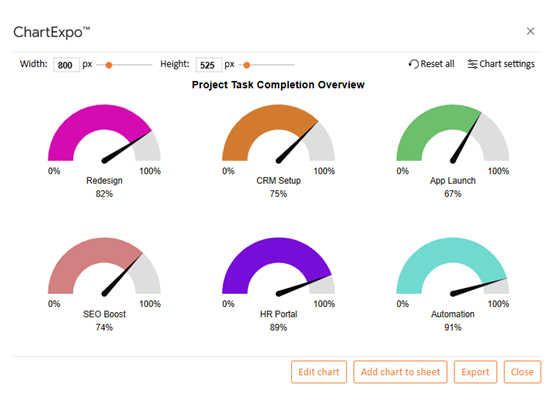
Let’s visualize and analyze this sample data in Google Sheets using ChartExpo.

Project

Tasks Completed

Total Tasks Assigned

Redesign 82 100
CRM Setup 75 100
App Launch 67 100
SEO Boost 74 100
HR Portal 89 100
Automation 91 100
  • To get started with ChartExpo, install ChartExpo in Google Sheets.
  • Go to Extensions > Charts, Graphs & Visualizations by ChartExpo > Open.
Google Sheets Query Function
  • To access the charts library, click the Add new chart button.
Google Sheets Query Function
  • Once it loads, scroll through the charts list to locate and choose the “Gauge Chart”.
Google Sheets Query Function
  • Put the data table in the sheet first. Then, choose the Sheet name from the drop-down in the ChartExpo section.
  • Select the metric column; metric is the numeric column in your data sheet.
  • Select the dimensions column; the dimension is the categorical column in your datasheet that contains text information.
  • Click the Create chart button to complete the process.
Google Sheets Query Function
  • If you want to add anything to the chart, click the Edit Chart button:
Google Sheets Query Function
  • Click the pencil icon next to the Chart Header to change the title.
  • It will open the properties dialog. Under the Text section, you can add a heading in Line 1 and enable Show.
  • Give the appropriate title of your chart and click the Apply button.
Google Sheets Query Function
  • Change the bar color from “Bar Properties” as follows:
Google Sheets Query Function
  • Set the needle color to black by clicking the pencil icon on the needle as follows:
Google Sheets Query Function
  • You can show the percentage on the label as follows:
Google Sheets Query Function
  • You can increase the font size for better readability from the “Font Style” option.
Google Sheets Query Function
  • You can change the variation type from “Chart Settings” to make the chart appear more visually appealing.
Google Sheets Query Function
  • After making all changes, click on the “Save” button:
Google Sheets Query Function
  • Your final chart will look like the one below.
Google Sheets Query Function

Insights

  • Automation leads all projects with a 91% task completion rate. This shows strong execution and near completion.
  • HR Portal follows closely with 89%, indicating solid progress and alignment with goals.
  • Redesign stands at 82%, suggesting it’s moving well and approaching the final stages.
  • CRM Setup and SEO Boost have moderate completion rates of 75% and 74%, respectively, performing well but requiring closer monitoring.
  • The app launch is the slowest, with only 67% completion, indicating possible delays or resource issues that require attention.

Benefits of Using the Google Sheets Query Function

Are you tired of scrolling through endless rows, trying to make sense of messy data? You’re not alone. That’s why the Google Sheets query function is a game-changer. It makes your spreadsheets smarter, faster, and way easier to manage.

Here’s how it helps:

  • Saves time: No more repeating formulas or applying filters manually. One Query pulls exactly what you need.
  • Keeps your sheet clean: You can run powerful filters without touching the original data. Everything stays neat and untouched.
  • Handles large data easily: Even if you’ve got hundreds of rows, Query doesn’t slow down. It runs smoothly and delivers quick results.
  • Pairs perfectly with visuals: Use Query to prepare data for dashboards, such as Google charts. Clean input equals better visuals.
  • Works with other features: Combine it with Google Sheets slicers, named ranges, or conditional formatting. It fits right into your workflow.

Best Practices of Google Sheet Query

Let’s be honest—Google Sheets Query can feel magical when it works. But when it doesn’t? You’re stuck staring at an error that makes no sense. That’s why adopting a few smart habits can save you a significant amount of stress and time.

Here are some best practices to keep your queries clean, fast, and frustration-free:

  • Always structure your data first: Headers in the first row: no random notes or empty columns in the middle.
  • Use named ranges: Instead of A2:D100, try using the named range salesData2025. It keeps your formulas readable and easier to manage.
  • Capitalize your commands: SELECT, WHERE, ORDER BY—keep them in all caps. It’s not required, but it helps your brain scan the formula faster.
  • Test your logic in parts: Start with the simplest case. Add complexity step by step so it’s easier to catch mistakes.
  • Know your column letters: Queries use column letters (A, B, C…), not header names. Keep a quick reference nearby if you’re dealing with lots of columns.

FAQs

What is the difference between VLOOKUP and QUERY in Google Sheets?

VLOOKUP for Google Sheets searches for a value in one column and returns a result from another. Google Sheets query filters, sorts, and analyzes entire datasets. The Query is more flexible and handles multiple conditions more effectively.

 How does a Google query work?

  • Uses SQL-style language.
  • Selects specific columns.
  • Filters data with conditions.
  • Sorts and groups results.
  • Works well with named ranges.
  • Displays results in real-time.
  • Keeps source data unchanged.
  • Helps clean and analyze data quickly.

Wrap Up

Mastering the Google Sheets query function gives you control over your data. It helps you find answers fast. You stop guessing and start knowing. One formula can replace hours of manual sorting.

How to create a chart in Google Sheets? Use Query to prepare clean data first. Then insert a chart that tells a story. Visuals have a greater impact when the data behind them is filtered and accurate.

Need to collaborate with others? Learn how to share a Google Sheet securely. With live Query results, your teammates see real-time insights. No exporting. No duplicate copies. Everyone works from one source of truth.

Are you tracking time for your team? Combine Google Sheets time tracking with Query to spot trends, find gaps, and analyze productivity across tasks and dates. It’s clearer when data is filtered and grouped.

The best part? Query works in the background. Your data stays clean, untouched, and organized. You keep control over what’s shown. With a few key skills, your spreadsheet transforms into an intelligent dashboard.

It doesn’t stop here. Once you add charts and automation, Google Sheets becomes a powerful tool for analysis. How? Install ChartExpo today, and stop working harder. With ChartExpo and the Query function, you and your team will start working smarter.

How much did you enjoy this article?

GSAd2
Start Free Trial!
157327

Related articles

next previous
Google Sheets14 min read

Google Sheets Automation: Practical Use Cases

Google Sheets automation helps you save time and reduce errors with smart tools. Learn how to automate, analyze, and visualize your data with ease.

Google Sheets9 min read

How to Group Columns in Google Sheets for Faster Insights

Learn how to group columns in Google Sheets to organize data fast. You’ll discover step-by-step tips and charts to manage and analyze spreadsheets easily.

Google Sheets10 min read

Import XML to Google Sheets: Smarter Ways to Use XML

Importing XML to Google Sheets helps you pull structured web data into spreadsheets. This guide will show you how to use it, analyze results, and avert issues.

Google Sheets11 min read

Wedding Budget Template in Google Sheets: Clear Insights

The wedding budget template in Google Sheets tracks and organizes wedding costs. This guide shows you how to set it up and stay on budget with ease.

Google Sheets11 min read

Google Sheets HLOOKUP: A Simple Walkthrough

Google Sheets HLOOKUP finds data fast by scanning rows. Click here to learn how to use it to save time, reduce errors, work smarter, and more.

ChartExpo logo

Turn Data into Visual
Stories

CHARTEXPO

  • Home
  • Gallery
  • Videos
  • Services
  • Pricing
  • Contact us
  • FAQs
  • Privacy policy
  • Terms of Service
  • Sitemap

TOOLS

  • ChartExpo for Google Sheets
  • ChartExpo for Microsoft Excel
  • Power BI Custom Visuals by ChartExpo
  • Word Cloud

CATEGORIES

  • Bar Charts
  • Circle Graphs
  • Column Charts
  • Combo Charts
  • Comparison Charts
  • Line Graphs
  • PPC Charts
  • Sentiment Analysis Charts
  • Survey Charts

TOP CHARTS

  • Sankey Diagram
  • Likert Scale Chart
  • Comparison Bar Chart
  • Pareto Chart
  • Funnel Chart
  • Gauge Chart
  • Radar Chart
  • Radial Bar Chart
  • Sunburst Chart
  • see more
  • Scatter Plot Chart
  • CSAT Survey Bar Chart
  • CSAT Survey Chart
  • Dot Plot Chart
  • Double Bar Graph
  • Matrix Chart
  • Multi Axis Line Chart
  • Overlapping Bar Chart
  • Control Chart
  • Slope Chart
  • Clustered Bar Chart
  • Clustered Column Chart
  • Box and Whisker Plot
  • Tornado Chart
  • Waterfall Chart
  • Word Cloud
  • see less

RESOURCES

  • Blog
  • Resources
  • YouTube
SIGN UP FOR UPDATES

We wouldn't dream of spamming you or selling your info.

© 2025 ChartExpo, all rights reserved.