• Home
  • Tools dropdown img
    • Spreadsheet Charts

      • ChartExpo for Google Sheets
      • ChartExpo for Microsoft Excel
    • Power BI Charts

      • Power BI Custom Visuals by ChartExpo
    • Word Cloud

  • Charts dropdown img
    • Chart Category

      • Bar Charts
      • Circle Graphs
      • Column Charts
      • Combo Charts
      • Comparison Charts
      • Line Graphs
      • PPC Charts
      • Sentiment Analysis Charts
      • Survey Charts
    • Chart Type

      • Box and Whisker Plot
      • Clustered Bar Chart
      • Clustered Column Chart
      • Comparison Bar Chart
      • Control Chart
      • CSAT Survey Bar Chart
      • CSAT Survey Chart
      • Dot Plot Chart
      • Double Bar Graph
      • Funnel Chart
      • Gauge Chart
      • Likert Scale Chart
      • Matrix Chart
      • Multi Axis Line Chart
      • Overlapping Bar Chart
      • Pareto Chart
      • Radar Chart
      • Radial Bar Chart
      • Sankey Diagram
      • Scatter Plot Chart
      • Slope Chart
      • Sunburst Chart
      • Tornado Chart
      • Waterfall Chart
      • Word Cloud
    • Google Sheets
      Microsoft Excel
  • Services
  • Pricing
  • Contact us
  • Blog
  • Support dropdown img
      • Gallery
      • Videos
      • Contact us
      • FAQs
      • Resources
    • Please feel free to contact us

      atsupport@chartexpo.com

Categories
All Data Visualizations Data Analytics Surveys
Add-ons/
  • Google Sheets
  • Microsoft Excel
  • Power BI
All Data Visualizations Data Analytics Surveys
Add-ons
  • Google Sheets
  • Microsoft Excel
  • Power BI

We use cookies

This website uses cookies to provide better user experience and user's session management.
By continuing visiting this website you consent the use of these cookies.

Ok

ChartExpo Survey


Home > Blog > Google Sheets

Google Sheet Lookup Table: A Complete Guide

What is a Google Sheet lookup table, and why does it matter for your spreadsheets?

Google Sheet Lookup Table

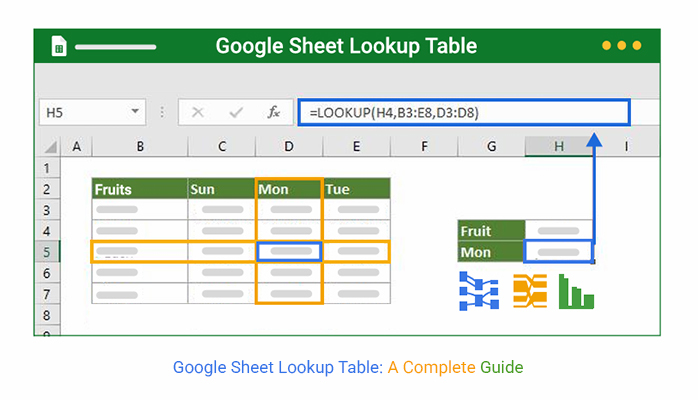
If you manage data in Google Sheets, you might need a fast way to pull related information from another table. That’s where a Google Sheet lookup table steps in. Think of it as your cheat code for smarter spreadsheets.

This tool powers everything from client databases to product inventory tracking. Have a long list of product IDS? A lookup table finds the product name, price, or supplier in seconds. It reduces errors and keeps your data connected.

VLOOKUP, XLOOKUP, and INDEX MATCH link data sets powerfully in Google Sheets. They ensure you always pull the correct info from the right place.

Many teams already use a Google Sheet lookup table without knowing it. They power autofill customer lists, live dashboards, and auto-updating reports.

Ready to make your spreadsheets faster, cleaner, and brighter? With some setup, you’ll see how tools like VLOOKUP for Google Sheets and IMPORTRANGE in Google Sheets can transform your work with data. It starts with mastering lookup tables—one of the simplest ways to reduce repetitive tasks and get real answers from your sheets.

So…

Table of Contents:

  1. What is a Google Sheet Lookup Table?
  2. Why is a Lookup Table in Google Sheets Important?
  3. Advanced Techniques for Lookup Tables in Google Sheets
  4. How to Create a Lookup Table in Google Sheets?
  5. How to Analyze a Lookup Table in Google Sheets?
  6. How to Use Lookup in Google Sheets?
  7. Common Mistakes for Lookup Tables in Google Sheets
  8.  Tips for a Google Sheet Lookup Table
  9. FAQs
  10. Wrap Up

What is a Google Sheet Lookup Table?

Definition: A Google Sheet lookup table is a data table used to find and return related information. It helps match values from one table to another, keeping data organized and connected. You can use it for tasks like managing inventory or tracking employee details.

With tools like Google Sheets slicers, you can filter lookup results. You can also pair it with Remove Duplicates in Google Sheets to keep your data clean and accurate. It’s a simple way to streamline your workflow.

Why is a Lookup Table in Google Sheets Important?

Are you tired of searching through endless rows to find one detail? That’s where a lookup table in Google Sheets comes in handy. It keeps everything connected regardless of whether you’re tracking sales, employees, or product data.

Here’s why it matters:

  • Efficient data retrieval: A Google Sheet lookup table quickly finds and returns matching data based on a specific input. This saves time and removes the need to search through rows manually.
  • Improved accuracy and consistency: Because lookup tables pull data automatically, the risk of human error drops significantly. Every result is tied to a single, verified source.
  • Easier updates and maintenance: When you update the source data in your lookup table, all linked results across your spreadsheet update. This keeps everything accurate without repeating tasks.
  • Data validation and standardization: Lookup tables can work with data validation rules to control users’ entries. That keeps your sheet clean, organized, and uniform.
  • Powerful for reporting and dashboards: They help automate dashboards by feeding real-time data into charts and reports. With tools like Google Sheets slicers, your visuals stay current and interactive.

Advanced Techniques for Lookup Tables in Google Sheets

Are you ready to take your Google Sheet lookup table skills to the next level? Basic lookups are great, but they can only take you so far.

Here’s how to level up your game:

  • INDEX and MATCH combination: INDEX returns a value from a specific row and column. MATCH finds the row or column number that matches your lookup value. Together, they give you flexible, two-way lookups—something traditional functions can’t do.
  • FILTER for multiple matches: Unlike standard lookups, FILTER returns all results that meet your conditions, not just the first. It’s perfect for showing every product sold by a rep or every task assigned to a team member.
  • QUERY for advanced filtering: QUERY uses a language similar to SQL to pull, group, and sort data from your sheet. It’s great for generating custom reports directly from raw data.
  • ARRAYFORMULA for range-based lookups: ARRAYFORMULA applies a lookup across a whole column or range with one formula. It fills the results instantly and automatically as new data comes in.
  • IMPORTRANGE for cross-sheet lookup: IMPORTRANGE in Google Sheets lets you pull data from other spreadsheets, even across different accounts. It’s ideal for teams working on shared projects or combining reports from multiple files.

How to Create a Lookup Table in Google Sheets?

Ever wish your spreadsheet could think for you? A Google Sheet lookup table can make that happen. It connects your data, automates your entries, and reduces errors. Setting it up is easier than most people think—and once it’s in place, you won’t want to work without it.

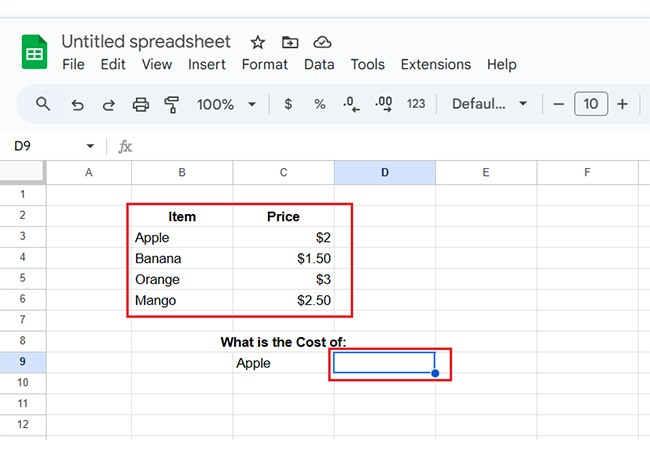
Let’s walk through how to build one from scratch:

  1. Set up your data table: Start with your raw data – this is the foundation. Create a list with Product IDs in one column, and names and prices in the subsequent columns.
  2. Name your table range (optional): Highlight your data and click on Data > Named Ranges. Giving your table a name (like “ProductList”) makes formulas cleaner and easier to read.
  3. Use a lookup function: Use VLOOKUP for Google Sheets to search the table. This tells Google Sheets to find A2 in the “ProductList” range and return the value from column 2.
  4. Test and expand: Enter a known lookup value (like a Product ID) and see if the correct result appears. Then drag the formula down to apply it to more rows.
  5. Protect or hide your lookup table: Once it works, protect the table. Go to Data > Protect range to prevent accidental edits. You can hide the sheet if you don’t want others to see it.

Example:

  • First, add your data to Google Sheets.
Google Sheet Lookup Table
  • Now apply the formula: In a new column, type: = vlookup (A2, A2:C4, 2, FALSE).
Google Sheet Lookup Table
  • After applying the formula, look below: If A2 contains “102,” the result will show “Mouse”.
Google Sheet Lookup Table

How to Analyze a Lookup Table in Google Sheets?

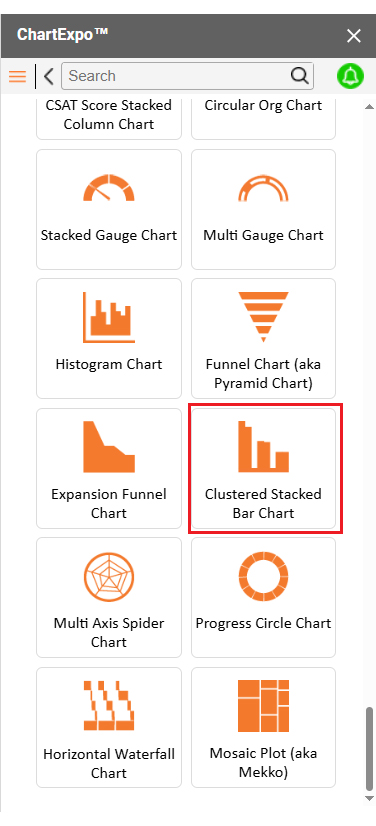
Have you ever tried making sense of messy data using a Clustered Stacked Bar Chart in Google Sheets? It’s like trying to solve a jigsaw puzzle with missing pieces. It shows something, but not always what you need.

That’s where data visualization plays a massive role in analysis. It turns raw numbers into clear stories. But when you want your chart to look like modern art, you have to look for Google Sheets add-ons.

Enter ChartExpo—a powerful tool that makes complex data simple to read. ChartExpo takes data from your Google Sheets and turns it into professional, insightful charts.

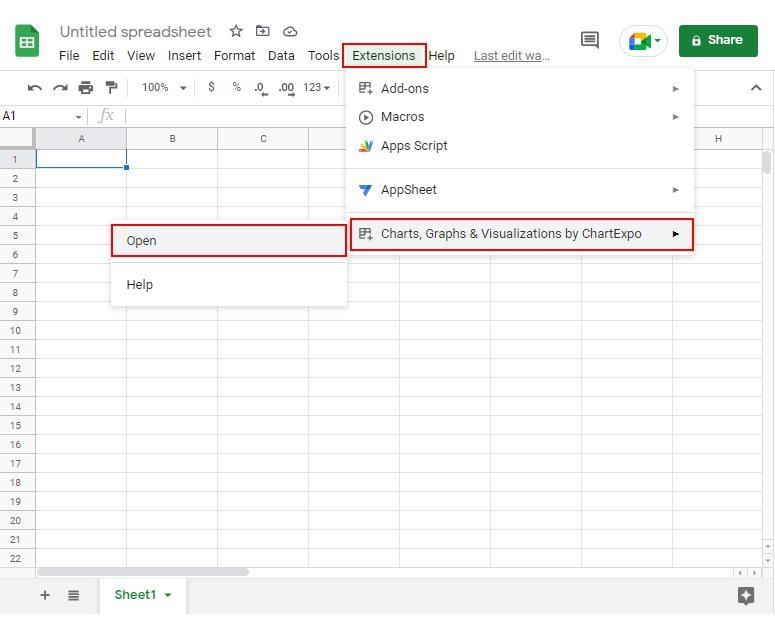
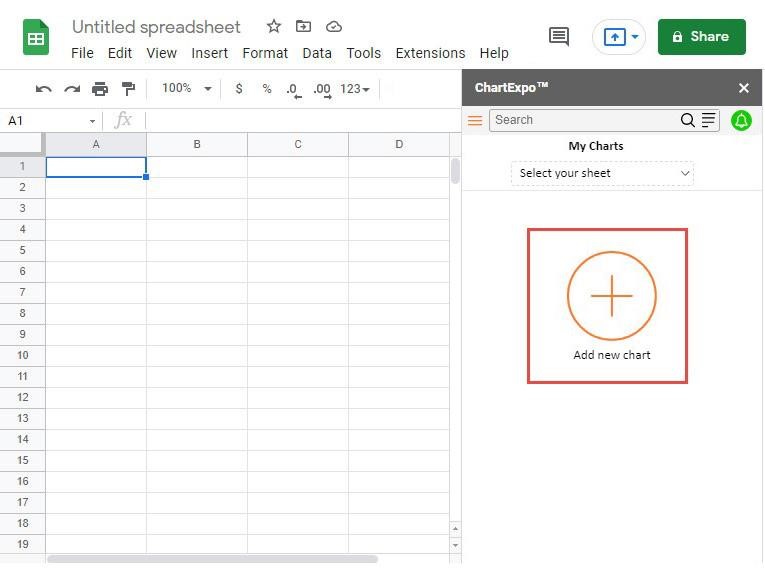
How to Install ChartExpo in Google Sheets?

  1. To start using ChartExpo, download it directly from the Google Sheets program. To do this, select Extensions from the top toolbar.
  2. A menu will appear. Click the Get add-ons option.
  3. Search for ChartExpo, and click on Charts, Graphs & Visualizations by ChartExpo when it appears in the results.
  4. Click the Install button. You will have to confirm your Google account and accept some permissions.

ChartExpo charts are available both in Google Sheets and Microsoft Excel. Please use the following CTAs to install the tool of your choice and create beautiful visualizations in a few clicks in your favorite tool.

Example

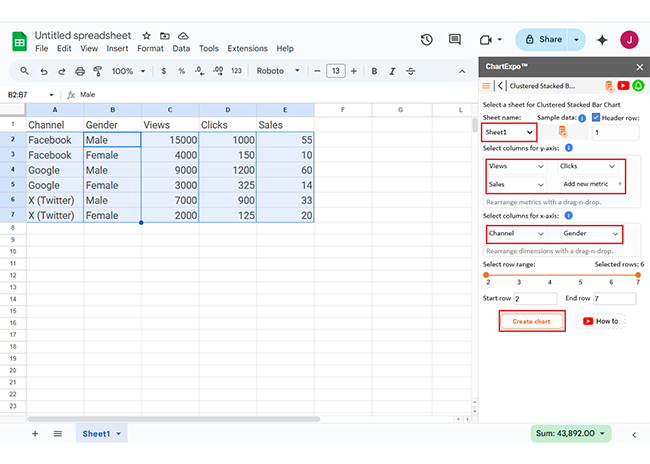
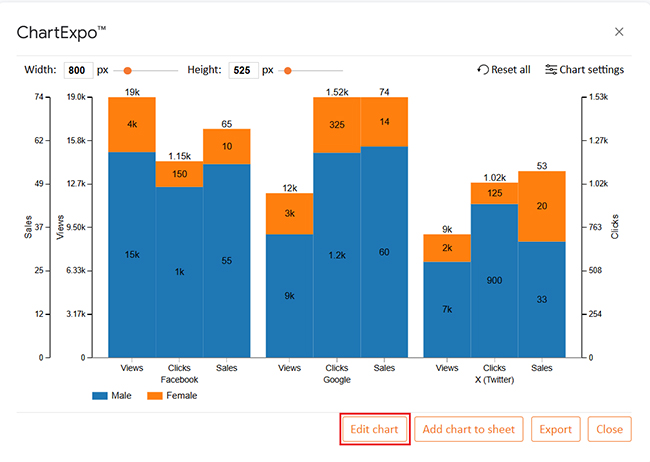
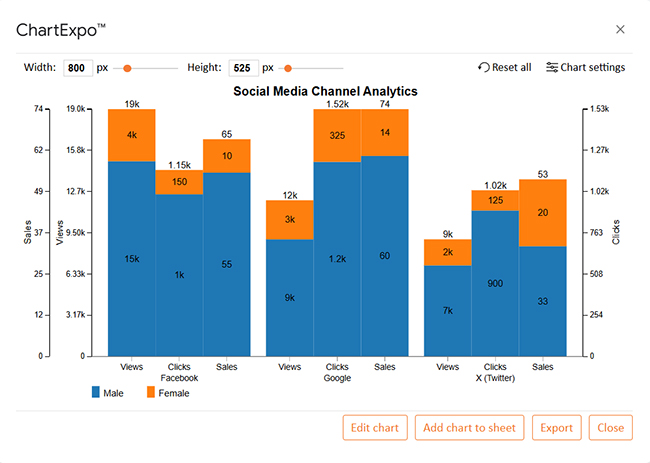
Let’s analyze this lookup table sample data in Google Sheets using ChartExpo.

Channel Gender Views Clicks Sales
Facebook Male 15000 1000 55
Facebook Female 4000 150 10
Google Male 9000 1200 60
Google Female 3000 325 14
X (Twitter) Male 7000 900 33
X (Twitter) Female 2000 125 20
  • To get started with ChartExpo, install ChartExpo in Google Sheets.
  • Go to Extensions > Charts, Graphs & Visualizations by ChartExpo > Open.
Google Sheet Lookup Table
  • To access the charts library, click the Add new chart button.
Google Sheet Lookup Table
  • Once it loads, scroll through the charts list to locate and choose the “Clustered Stacked Bar Chart”.
Google Sheet Lookup Table
  • Put the data table in the sheet first. Then, choose the Sheet name from the drop-down in the ChartExpo section.
  • Select the metric column; metric is the numeric column in your data sheet.
  • Select the dimensions column; the dimension is the categorical column in your datasheet that contains text information.
  • Click the Create chart button to complete the process.
Google Sheet Lookup Table
  • If you want to add anything to the chart, click the Edit Chart button:
Google Sheet Lookup Table
  • Click the pencil icon next to the Chart Header to change the title.
  • It will open the properties dialog. Under the Text section, you can add a heading in Line 1 and enable Show.
  • Give the appropriate title of your chart and click the Apply button.
Google Sheet Lookup Table
  • You can change the label shape of Male and Female into “Column” as follows:
Google Sheet Lookup Table
  • After making all changes, click on the “Save” button:
Google Sheet Lookup Table
  • Your final Clustered Stacked Bar Chart will look like the one below.
Google Sheet Lookup Table

Insights

  • Male users show higher engagement across all channels (more views, clicks, and sales).
  • Google leads with the highest conversion rate.
  • Facebook drives the most views overall.
  • Female users on X (Twitter) have the best click-to-sale ratio compared to other platforms.

How to Use Lookup in Google Sheets?

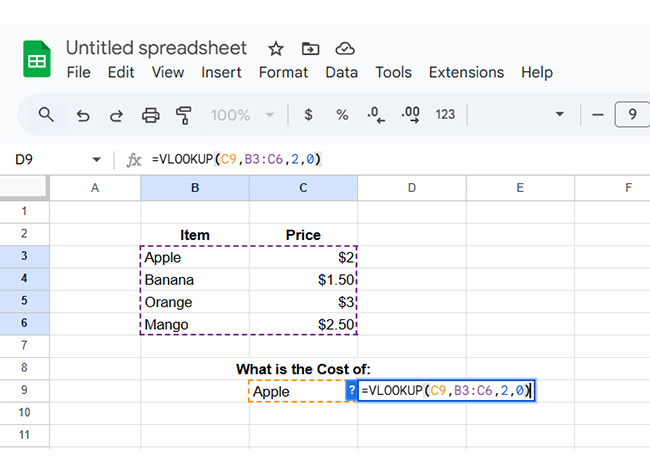
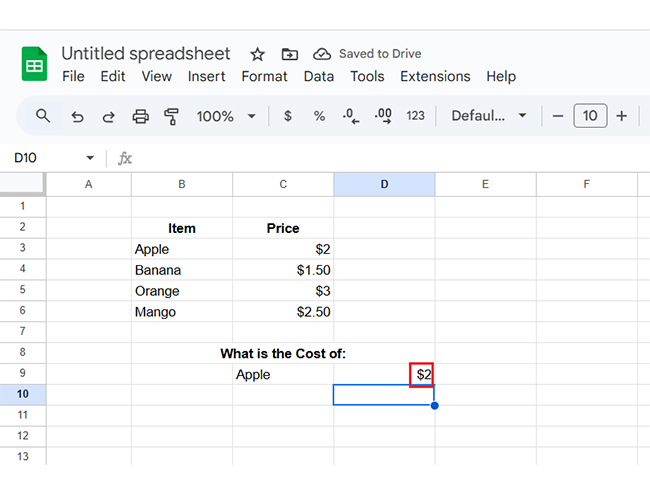
Have you ever stared at a massive sheet, wondering how to pull a value without using bulky formulas? That’s where LOOKUP in Google Sheets comes in. It’s simple, flexible, and often overlooked.

Here’s how it works:

Syntax: LOOKUP(search_key, search_range|search_result_array, [result_range])

Let’s break that down:

  • Search key – the value you want to find
  • search range – where to search for that value
  • result range – (optional) where to pull the result from

Important Notes:

  • Your data must be sorted in ascending order, or LOOKUP won’t return accurate results.
  • LOOKUP doesn’t return an error if it doesn’t find an exact match. It gives the last value that’s less than or equal to what you searched.
  • Use VLOOKUP or INDEX/MATCH instead for unsorted data or exact matches.

Common Mistakes for Lookup Tables in Google Sheets

Is your Google Sheet lookup table working fine? Double-check. Even a small mistake can throw off your entire spreadsheet. These errors are sneaky and happen more often than you’d think. Let’s walk through the most common issues so you can avoid the headaches later:

  • Incorrect column index in VLOOKUP: Using the wrong column index number means your formula might pull insufficient data or return an error. Always count from the first column of your lookup range, starting with 1.
  • Lookup value not in the first column: VLOOKUP only searches in the first column of your defined range. If your lookup value is elsewhere, the function won’t find it and will return an error.
  • Using approximate match instead of exact: Leaving out the FALSE argument tells Google Sheets to use an approximate match. This often gives inaccurate results unless your data is perfectly sorted.
  • Unsorted data with LOOKUP: LOOKUP only works correctly when the search range is sorted in ascending order. If it’s not, you might get outdated or completely incorrect matches.
  • Not locking ranges in formula: Without $ to lock the range, copying the formula shifts the reference and breaks the lookup. Always lock the range to keep it consistent across rows.
  • Data type mismatch: If one value is a number and the other is text, the formula won’t match them. Use functions like VALUE() or TO_TEXT() to fix mismatches.

 Tips for a Google Sheet Lookup Table

Want your Google Sheet lookup table to run smoothly every time? A few smart habits can make a big difference. Clean data, clear structure, and the correct formulas are all you need. Here are essential tips to keep things working like a pro:

  • Use named ranges and lock your formulas: Naming your range keeps your formulas neat and readable. Locking the range with $ symbols prevents errors when copying across rows.
  • Always match exactly and keep values unique: Use FALSE to avoid random or wrong results in your lookup. Ensure each lookup value appears only once—duplicates confuse your formulas.
  • Sort only when using LOOKUP, and watch your data type: Sorting is only required for LOOKUP. Double-check that numbers are numbers, and text is text—Google Sheets is picky.
  • Protect or hide your lookup table and use INDEX + MATCH for flexibility: Protect essential data from accidental edits, or hide the table to clean up your sheet.

FAQs

How do I search for text in a table in Google Sheets?

  • Use VLOOKUP, FILTER, or MATCH to find text.
  • Type the keyword and apply the formula.
  • These functions scan your table and return matches.
  • You can also use the search box with Ctrl + F.

Does Google Sheets have a lookup function?

Yes, Google Sheets has multiple lookup functions. Use LOOKUP, VLOOKUP, HLOOKUP, or INDEX and MATCH. Each works for different needs. They help retrieve data from tables based on specific values.

How do I graph a data table in Google Sheets?

  • Highlight your data table. Click Insert > Chart.
  • Google Sheets will suggest a graph.
  • You can switch chart types and customize them.
  • Explore tools, such as how to create a chart in Google Sheets, for better clarity.

Wrap Up

A Google Sheet lookup table helps organize and connect data. It automates searches and keeps your sheets cleaner. You save time and avoid manual errors.

Lookup tables are helpful for many tasks. In a Google Sheets Stock Tracker, they can pull company names from ticker symbols. Combine that with Google Finance in Google Sheets to show live price updates instantly.

For teams using Google Sheets Time Tracking, lookup tables simplify logs. You can match employee IDS to names or tasks. This keeps timesheets accurate and easy to read. They also improve reporting. Instead of scrolling through data, lookup tables return answers fast. Dashboards run smoothly when your formulas are innovative and linked.

The real power is flexibility. You can use VLOOKUP, INDEX, and MATCH, or even IMPORTRANGE, to scale across sheets. There is no need to rebuild from scratch. Start with a lookup table if you want savvy, fast, and clean spreadsheets. Once set up, it does the heavy lifting for you. Smarter sheets start here.

Ready to bring your data to life? Install ChartExpo and transform your spreadsheets into powerful visual dashboards in minutes.

How much did you enjoy this article?

GSAd1
Start Free Trial!
152585

Related articles

next previous
Google Sheets13 min read

Google Sheets as a Database for Insightful Reports

Learn to use Google Sheets as a database to store, manage, and visualize data. Get setup tips, best practices, and chart options to improve your workflow.

Google Sheets10 min read

Google Sheet Travel Itinerary Template: A Visual Layout

A Google Sheet travel itinerary template helps you plan and track your trips. Learn how to create and customize templates for better travel organization.

Google Sheets10 min read

Forecasting in Google Sheets: A Complete Walkthrough

Forecasting in Google Sheets helps you predict trends using past data. Click here for simple steps, tools, and charts to improve planning and decision-making.

Google Sheets10 min read

Project Tracking in Google Sheets: A Visual Walkthrough

Project tracking in Google Sheets helps manage tasks and deadlines in one place. This guide shows how to build, use, and improve trackers with smart visuals.

Google Sheets8 min read

Google Sheets Add-Ons for Modern Spreadsheet Users

Google Sheets add-ons make your spreadsheets more powerful. This guide covers the top add-ons, the best for data analysis, and how to install and use them.

ChartExpo logo

Turn Data into Visual
Stories

CHARTEXPO

  • Home
  • Gallery
  • Videos
  • Services
  • Pricing
  • Contact us
  • FAQs
  • Privacy policy
  • Terms of Service
  • Sitemap

TOOLS

  • ChartExpo for Google Sheets
  • ChartExpo for Microsoft Excel
  • Power BI Custom Visuals by ChartExpo
  • Word Cloud

CATEGORIES

  • Bar Charts
  • Circle Graphs
  • Column Charts
  • Combo Charts
  • Comparison Charts
  • Line Graphs
  • PPC Charts
  • Sentiment Analysis Charts
  • Survey Charts

TOP CHARTS

  • Sankey Diagram
  • Likert Scale Chart
  • Comparison Bar Chart
  • Pareto Chart
  • Funnel Chart
  • Gauge Chart
  • Radar Chart
  • Radial Bar Chart
  • Sunburst Chart
  • see more
  • Scatter Plot Chart
  • CSAT Survey Bar Chart
  • CSAT Survey Chart
  • Dot Plot Chart
  • Double Bar Graph
  • Matrix Chart
  • Multi Axis Line Chart
  • Overlapping Bar Chart
  • Control Chart
  • Slope Chart
  • Clustered Bar Chart
  • Clustered Column Chart
  • Box and Whisker Plot
  • Tornado Chart
  • Waterfall Chart
  • Word Cloud
  • see less

RESOURCES

  • Blog
  • Resources
  • YouTube
SIGN UP FOR UPDATES

We wouldn't dream of spamming you or selling your info.

© 2025 ChartExpo, all rights reserved.