Categories
Current ratio vs. quick ratio.
Imagine a tightrope walker, balancing deftly as they step cautiously across the narrow line. Each movement is calculated, and each breath is measured. In finance, businesses walk a similar tightrope, balancing assets against liabilities to avoid the dangerous fall into insolvency. This is where understanding the current ratio vs. quick ratio becomes essential.


This comparison is akin to comparing two safety nets designed to catch a business should it stumble. The current ratio, including all current assets, may seem like a broader, more comforting safety net. Yet, it can be deceptive, potentially including assets that aren’t readily liquidated. For instance, the inventory might not convert to cash without a significant discount.
Conversely, the quick ratio, the acid-test ratio, is a more conservative safeguard. This safety net is stronger but more specific because inventory is not included. Specifically, it only considers assets that can be converted into cash within 90 days or less. It shows a company’s financial health, revealing whether it can make short-term payments without selling its inventory.
Liquidity analysis reflects how close a company is to sinking. Such liquidity ratios are critical measures of a business’s health. They provide a glimpse of a business’s ability to service its debt.
So, let’s walk the tightrope together, examining the current ratio vs. quick ratio with precision. You’ll discover how these ratios can inform better decision-making in the high-stakes performance of business finance.
First…
Definition: The current ratio assesses a company’s liquidity position and its ability to settle short-term liabilities. It is calculated by dividing a company’s current assets by its current liabilities. Current assets include cash, accounts receivable, inventory, and other assets to be converted into cash within one year. On the other hand, current liabilities comprise debts and other obligations to be settled within the same period.
The ratio enables analysts to determine whether a company can settle its immediate obligations using instantly realizable assets. A higher value indicates a solid liquidity position, implying the company is better placed to meet short-term liabilities. In contrast, a low-value ratio indicates potential liquidity issues. This implies that the firm requires close monitoring of its financial and operational management.
The Current Ratio formula is:
Current Ratio = Current Assets / Current Liabilities
Definition: Another name for the quick ratio is the acid-test ratio. It analyzes a company’s ability to meet its short-term obligations using its most liquid forms of cash. This quantification is expressed as a relationship between the firm’s quick assets and its current liabilities. Quick assets can be rapidly transformed into cash. Quick assets include cash, cash equivalents, marketable securities, and accounts receivable.
The quick ratio can be calculated as the division of the sum of quick assets by the total current liabilities. Unlike the current ratio, the quick ratio removes the need for inventories. Why? Because in times of stress, inventories may not be easily converted to cash.
A higher quick ratio suggests a stronger liquidity position. It indicates that the company has sufficient liquid assets to cover its short-term liabilities without relying on inventory sales. Conversely, a lower quick ratio may signal potential liquidity challenges. This indicates the need for further analysis of the company’s financial health and management practices.
The following formula is used to calculate the quick ratio:
Quick ratio = (Cash + Cash equivalents + Short-term investments + Accounts receivable) / (Current liabilities)
What if the company’s current assets are not listed on the balance sheets? In such a case, you can use the following formula to calculate the quick ratio:
Quick ratio = (Total current assets – Inventory – Prepaid expenses) / (Current liabilities)
When analyzing a company’s liquidity, both the current ratio and the quick ratio (acid-test ratio) are valuable metrics. Yet, they differ in their composition and interpretation. Below is a table highlighting the key differences between current ratio vs. quick ratio:
| Aspect | Current Ratio | Quick Ratio |
| Definition | Measures the ability of a company to pay off its short-term liabilities with its current assets. | Measures the ability of a company to cover its short-term liabilities with its most liquid assets, excluding inventory. |
| Formula | Current Assets / Current Liabilities | (Cash + Cash Equivalents + Accounts Receivable) / Current Liabilities |
| Components | Includes all current assets: cash, accounts receivable, inventory, marketable securities, and prepaid expenses. | Excludes inventory from current assets, focusing on cash, cash equivalents, marketable securities, and accounts receivable. |
| Liquidity Assessment | Provides a broader view of liquidity, including assets that may take longer to convert into cash, such as inventory. | Offers a more conservative measure of liquidity, focusing only on assets that can be quickly converted into cash. |
| Interpretation | A higher ratio indicates better liquidity, but too high a ratio may suggest an inefficient use of assets. | A higher ratio indicates stronger liquidity and a better ability to meet short-term obligations without relying on inventory sales. |
| Industry Preference | Commonly used in various industries to assess short-term financial health and liquidity position. | Particularly useful in industries with rapidly changing inventory turnover or where inventory may be difficult to liquidate quickly. |
| Decision Making | Provides a general overview of liquidity but may overstate liquidity if inventory levels are high. | Offers a conservative measure of liquidity, providing insight into a company’s ability to meet short-term obligations without relying on inventory sales. |
The choice between the current ratio and the quick ratio depends on the specific circumstances. It also depends on the insights required regarding a company’s liquidity position. Each ratio offers unique advantages and is best suited for different analytical purposes.
Are you drowning in data and starving for insights? Welcome to the high seas of financial ratios. Here, the Current Ratio and Quick Ratio bob along, waiting to tell their liquidity tales.
And how do we make sense of these ratios? Data visualization is the ultimate answer.
Excel’s charting can often feel like setting sail with a toy boat, limited, basic, and barely afloat.
But fear not; ChartExpo sails in with a treasure chest of advanced chart types. ChartExpo turns the tide, making visual waves that speak volumes, ensuring your debt-to-total assets ratio analysis and overall financial analysis soar.
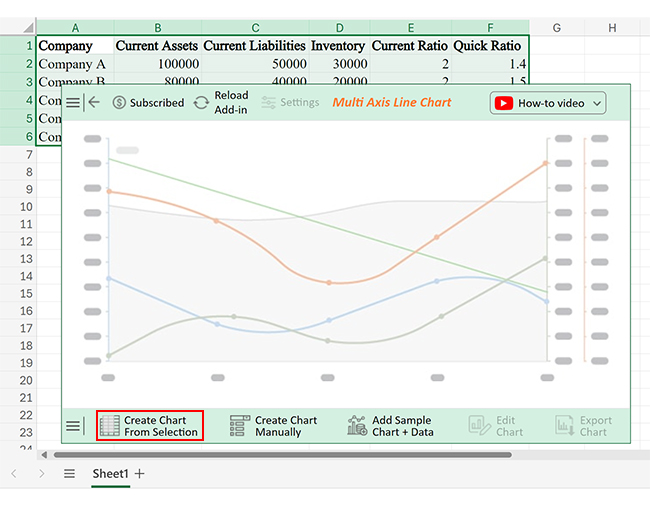
Let’s learn how to install ChartExpo in Excel.
ChartExpo charts are available in both Google Sheets and Microsoft Excel. Use the CTAs below to install the tool of your choice and create beautiful visualizations, including a Scatter chart, with just a few clicks in your favorite tool.
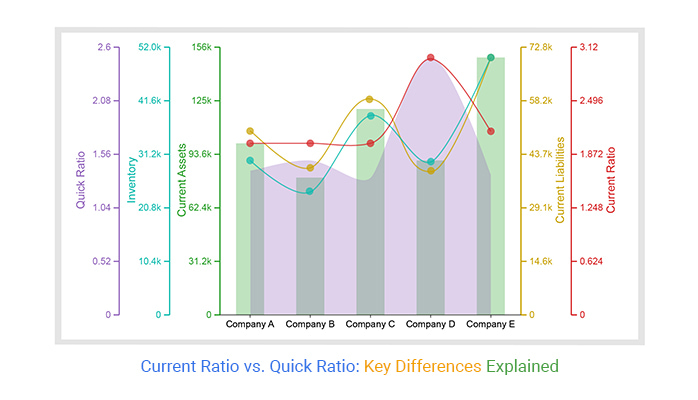
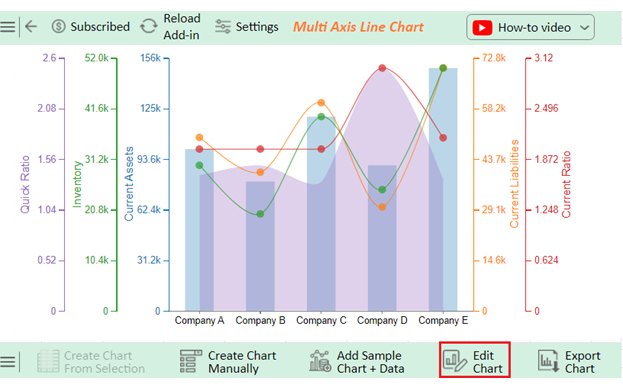
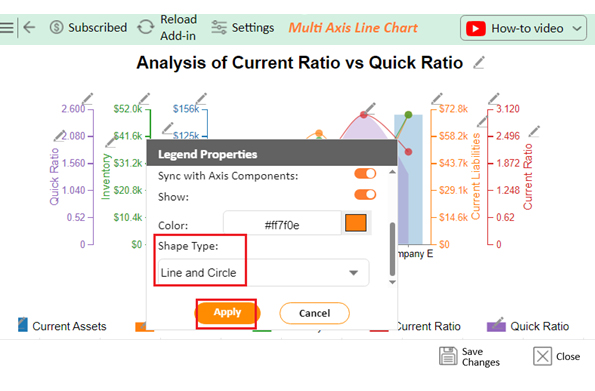
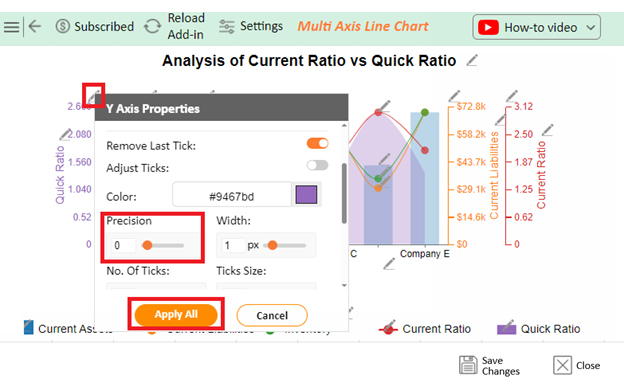
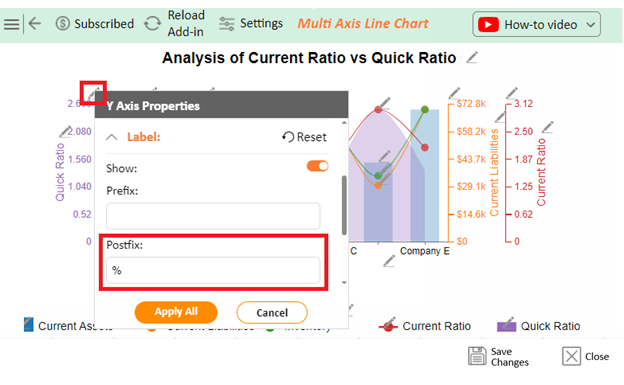
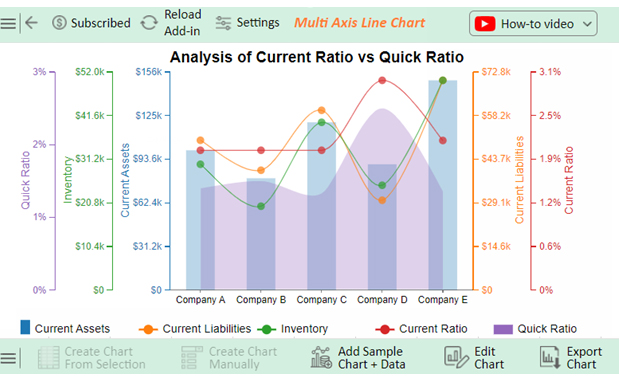
Let’s analyze the current ratio vs. quick ratio sample data below using ChartExpo.
| Company | Current Assets | Current Liabilities | Inventory | Current Ratio | Quick Ratio |
| Company A | 100000 | 50000 | 30000 | 2 | 1.4 |
| Company B | 80000 | 40000 | 20000 | 2 | 1.5 |
| Company C | 120000 | 60000 | 40000 | 2 | 1.33 |
| Company D | 90000 | 30000 | 25000 | 3 | 2.5 |
| Company E | 150000 | 70000 | 50000 | 2.14 | 1.36 |


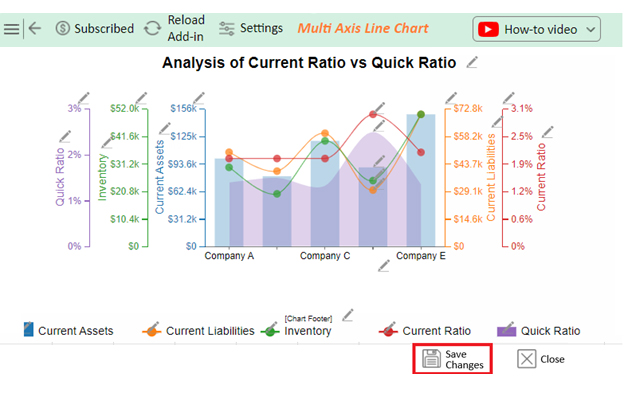
Both the current ratio and quick ratio have their merits; the choice depends on the context. The current ratio provides a broader view of liquidity. Conversely, the quick ratio offers a more conservative measure focusing on immediate liquidity needs.
A quick ratio less than the current ratio means that a significant portion of current assets is in inventory. If a company’s inventory turnover is poor, this could signify issues with liquidity.
Choose the current ratio over the quick when you need a more general appraisal of liquidity, including inventory. It takes a deeper look at a company’s capacity to cover short-run financial obligations. This is important if inventory is a vital part of current assets.
Understanding the differences between the current ratio vs. quick ratio is crucial for effective financial analysis. The choice between these ratios depends on the context and the insights needed regarding a company’s liquidity position.
The current ratio, encompassing all current assets, offers a comprehensive view of liquidity. It is valuable for assessing overall liquidity and analyzing businesses with significant inventory holdings. In contrast, the quick ratio focuses on the most liquid assets, excluding inventory, providing insight into immediate liquidity needs.
The current ratio considers inventory alongside other current assets. Conversely, the quick ratio offers a more conservative measure by excluding inventory. Thus, the quick ratio is particularly valuable when evaluating immediate liquidity or evaluating businesses with slow-moving inventory.
In general, the current ratio provides higher value due to the inclusion of inventory. If the quick ratio is less than the current ratio, it indicates a large proportion of current assets in inventory. This may not be a favorable sign for liquidity.
Both current and quick ratios have arguments in their favor. Therefore, both have a place in financial analysis based on the business’s characteristics, industry factors and required insights. Understanding the nuances and trade-offs between these ratios is crucial for effective financial analysis and decision-making.
How much did you enjoy this article?


Calculate accounts receivable turnover ratio to measure credit collection speed, improve cash flow, and strengthen your financial strategy. Read on!

Change Management KPIs are the key to tracking adoption, performance, and ROI during transitions. Find out which metrics matter. Read on!

Data collection methods and techniques determine the quality of every insight you act on. Explore key approaches for gathering reliable data. Read on!


