Categories
By ChartExpo Content Team
Why should you care about a covariance matrix? Because it connects the dots.
Think of it as a grid that shows how different variables relate to each other—how they “move” together. With a covariance matrix, you’re not just looking at data; you’re seeing connections that can guide smart, impactful decisions.
Picture sales and marketing spend: does an increase in one influence the other? The covariance matrix gives you a direct look at these relationships, revealing trends that aren’t obvious at first glance. It shows how pairs of variables change in sync (or don’t), helping you adjust strategies based on real connections, not guesswork.


The power of a covariance matrix goes beyond simple analysis. It’s about seeing hidden patterns that can shape strategic moves. When you know how certain variables interact—like ad spend and customer growth—you can make decisions that push your business forward.
So, whether it’s boosting revenue, refining products, or streamlining resources, the covariance matrix has you covered, helping you make data-driven decisions with clarity and confidence.
First…
A covariance matrix shows how pairs of variables shift together. Think of it as a snapshot of relationships. If you have sales data from different regions, this matrix helps you see which areas behave similarly. It’s a grid filled with numbers, where each value tells you about the link between two variables.
For a business, understanding these relationships is like having a map in a treasure hunt. It shows which variables move hand in hand—like sales and marketing spend. Recognizing these patterns helps in forecasting and strategic planning. If you know two variables rise together, you can make data-driven decisions about where to invest your resources.
The real magic happens when you apply the covariance matrix formula. It crunches the numbers and lights up paths you might not see otherwise.
For instance, it can reveal if higher customer satisfaction scores correlate with increased sales in a particular region. This insight can drive businesses to fine-tune their customer service, targeting areas where it impacts sales most.
Imagine you’re looking at a map that doesn’t just show places but also tells you how closely related different locations are. That’s what a covariance matrix does with data.
It’s a table where each element shows how much two sets of numbers change together. If you’re running a business, this is like seeing how sales in one region move in sync with another, or if they don’t at all.
Variance is a way to measure how far a set of numbers is spread out. It’s like if you threw a bunch of darts at a dartboard, variance tells you how spread out those darts landed.
Covariance goes a step further by measuring how two things vary together. Think of it as checking if the increase in one product’s sales tends to match up with another’s.
If they do, they have a positive covariance; if one goes up while the other goes down, that’s negative covariance.
Say your business spends money on marketing. You’d expect that the more you spend, the more revenue you’d see, right?
By looking at the covariance between your marketing spend and revenue, you can see if they really do move together. This helps in planning your budgets and creating a sales forecast for future growth. It’s like making sure you’re putting your money where it’s most effective.
Let’s talk numbers, but keep it simple. Businesses swim in data about customer habits. What if you could peek into this pool with customer behavior analytics and see patterns that tell you what your customers might buy next?
A covariance matrix steps shows if two things—say, age and product purchases—move together. If they do, a pattern emerges, and this matrix helps you see it clearly. This insight allows businesses to make smarter choices about what to sell and to whom.
Now, imagine knowing which products usually get bought together. Or understanding how sales in one area go up when another goes down. This isn’t just about seeing trends; it’s about seeing how changes in one area can affect changes in another.
That’s the magic of the covariance matrix—it connects the dots between different business areas and shows how they interact with profits. This is vital because it helps businesses adjust strategies in ways that boost their bottom line.
It gets even better when you throw advertising into the mix. Think about this: how does the money you pour into ads affect your sales?
The covariance matrix can help you figure this out. By comparing ad spend and sales growth, you can see if your advertising efforts are really paying off. It’s like having a financial health check-up for your ad campaigns, ensuring you’re investing wisely and getting the most out of every dollar spent.
The following video will help you to create a Heatmap in Microsoft Excel.


The following video will help you to create a Heatmap in Google Sheets.
Let’s start with the basics: you need data. Look around, you’ve likely got what you need. Sales figures, customer feedback, or even employee performance metrics can be gold mines. Remember, the goal is to collect variables that might influence each other. Think sales and marketing spend, or customer support calls and product returns. Simple, right?
Here’s how you do it, step by step:
No sweat, right?
Why bother with all these numbers? Because they tell you stories.
Covariance can show if increasing your marketing budget might lift your sales, or if longer call times are leading to better customer satisfaction scores. Here’s how you can use this:
Positive covariance means that as one variable jumps, the other leaps with it—they’re buddies sprinting in the same direction.
Negative covariance tells a different story; think of it as a seesaw, one goes up while the other goes down.
Zero covariance? They’re strangers passing without a glance. Decoding these relationships helps you predict trends and manage risks more cunningly.
This matrix is not just about risks; it’s a treasure map for spotting golden opportunities.
High variance on the diagonal? That variable is a wild child, full of surprises and potential. When you pair it with another high-variance buddy, brace yourself for a rollercoaster ride that might just lead to big wins.
It’s about finding the right combination of variables that dance well together, setting the stage for strategic moves.
Risk assessment sounds dry, but it’s essentially about asking, “What could go wrong?”
Using the covariance and correlation formula, you measure how tightly variables are linked and dance together in the face of risk.
A high positive correlation means they move in unison—a tango of sorts, graceful but predictable.
A low or negative correlation? It’s more like a freestyle dance, each doing its own thing, reducing the risk of moving in the same harmful direction.
Ever wondered how big brands make smart decisions about where to spend their marketing dollars? It’s all about understanding the relationship between different marketing variables. Covariance matrix helps marketers see how changes in one area relate to outcomes in another.
By analyzing these patterns, businesses can adjust their strategies for better results.
So, you’re spending on ads but are you making sales? That’s where the covariance correlation formula comes in handy. This formula helps you see the direct relationship between ad spend and sales outcomes.
By understanding this link, you can better allocate your budget to maximize sales, ensuring that each dollar spent is an investment towards higher revenue.
Keeping customers is as important as gaining new ones, right? To improve customer retention, it’s crucial to identify which factors influence loyalty. By studying data on customer behavior and feedback, companies can find patterns—what moves together.
This could be product satisfaction, customer service interactions, or user engagement levels. Recognizing these correlations lets businesses focus on nurturing these key areas to keep their customers happy and loyal.
Got a budget and need to make the most of it? Smart budget adjustments require understanding the link between where money is spent and the outcomes achieved. This means analyzing and interpreting data from past spending and outcomes to identify what’s working and what’s not.
By reallocating funds from underperforming areas to those delivering strong results, companies can ensure they’re investing in the most impactful activities.
This approach not only optimizes budget use but also drives better overall performance of marketing efforts.
Balancing risk sounds pretty straightforward, right? Well, with the variance and covariance matrix, it’s a bit like balancing a seesaw.
On one side, you have variance, which tells you how much an asset’s returns can swing.
High variance? Expect a bumpy ride.
On the other side is covariance, which is all about relationships. How do two assets behave in relation to each other?
By studying these, savvy investors can craft a portfolio that balances these elements, aiming to smooth out those bumps while keeping an eye on the prize.
Imagine a portfolio manager deciding how to diversify investments. They look at sample covariance, which is like peeking into how different assets have played together in the past.
For instance, if tech stocks and renewable energy stocks don’t move in lockstep, they have low covariance. By mixing these in a portfolio, our manager can reduce risk. Why? Because when tech stocks dip, renewables might hold steady or even rise, balancing the impact.
Now, let’s talk about putting all this into action. Making data-driven asset allocations isn’t just a fancy phrase. It means using hard data, like the covariance matrix, to decide where to put your money.
Think of it as being the coach of a sports team. You wouldn’t just randomly pick players. You’d analyze their stats, strengths, and how well they work together.
That’s what data-driven asset allocations do. They help investors pick a winning team for their investments, aiming for the best possible outcome based on solid data, not just gut feelings.
The Covariance Matrix formula isn’t just a bunch of numbers; it’s a roadmap for predicting demand.
By analyzing the covariance between historical sales data and other factors like marketing spend or economic indicators, businesses can forecast future demand more accurately. This method allows for adjusting inventory levels before a predicted increase in sales, thus optimizing revenue.
Consider a retail store gearing up for the holiday season. By analyzing the covariance between past sales during the holiday season and factors like discount levels and consumer spending patterns, the store can predict trends.
This data-driven approach allows the store to plan its inventory efficiently, ensuring shelves are stocked with the right products at the right time, maximizing sales while minimizing overstock.
In uncertain times, data is a beacon of clarity.
Using the Covariance Matrix helps businesses navigate through foggy conditions. Whether it’s a sudden market shift or a gradual change in consumer preferences, understanding the covariance provides a clearer picture of what’s happening and why.
Armed with these insights, companies can pivot strategies swiftly, turning potential threats into opportunities.
Imagine you’re a chef trying to figure out which dishes to keep on the menu. You’d look at which ingredients sell well together, right? That’s how covariance data helps in business.
By examining which products sell well together, businesses can decide which products to develop or discontinue. This data-driven approach ensures that the product line evolves based on actual customer behavior, not just hunches.
Think of a basketball coach who needs to pick the starting lineup for the next game. They’d look at player stats to decide, wouldn’t they?
Similarly, by using covariance in performance metrics, managers can identify which skills and behaviors link closely to high performance. This allows for targeted training programs, helping employees improve in areas that impact performance most significantly.
Let’s picture a busy airport. Air traffic controllers must decide which flights to prioritize to keep everything running smoothly.
In business, using covariance data helps in a similar way. It shows how different departments or resources interact to affect overall productivity. With this insight, companies can allocate resources more effectively, making sure that every team or department is set up to succeed without unnecessary waste of time or money.
When dealing with a covariance matrix, it’s easy to fall into traps that might skew the data analysis. Here are some key points to keep in mind:
Remember, correlation does not imply causation. Just because two variables move together does not mean one causes the other to change. It’s vital to consider other factors that might be influencing the relationship. Don’t jump to conclusions without thorough investigation.
Data quality is paramount. Poor data can lead to errors in the covariance matrix calculations, misleading results, and poor decisions. Always check your data for accuracy and completeness before proceeding. Missing or outlier values can significantly distort the outcome, so treat them carefully.
Misreading the data from a covariance matrix can be expensive. Ensure you understand what the covariance values are telling you about the relationship between variables.
A common error is overestimating the strength of a relationship based on high covariance values without considering the scale of the data involved.
Streamlining a supply chain can feel like trying to solve a complex puzzle. However, understanding variance and covariance provides clues to solving this puzzle more effectively.
Variance tells us how much a single variable, like delivery time, varies from its average.
Covariance goes further by measuring how two variables, like delivery time and fuel costs, move together.
By analyzing these measurements, businesses can pinpoint inconsistencies and dependencies in the supply chain.
For instance, if there’s a high covariance between delivery delays and fuel costs, it might be time to look at alternative transportation routes or suppliers that can provide more predictable delivery times.
When it comes to enhancing efficiency, the balance between staffing and productivity is crucial. It’s like finding the right rhythm in music; too many or too few musicians can throw off the harmony. By closely monitoring how changes in staff levels affect productivity, businesses can find the sweet spot where efficiency peaks.
For example, if adding staff doesn’t lead to a proportionate increase in productivity, there might be a need to improve training or reassign roles. On the flip side, if productivity declines as more people are added, it could be a sign of too many cooks in the kitchen, leading to coordination problems.
Think of a heatmap as your data’s best visual buddy. This colorful chart lights up with different colors representing different values, making it super easy to spot patterns and outliers at a glance. Why read through rows of numbers when a heatmap can show you at a glance where to focus your attention?
Choosing between a sample covariance matrix and correlation charts can feel like deciding between tea or coffee—they both have their perks!
Use a sample covariance matrix when you’re interested in the actual variance and covariance values within your data. It gives you the raw numbers, showing the scale of relationships.
Correlation charts, on the other hand, shine by normalizing these relationships, giving you a clean -1 to 1 scale, making it easier to compare diverse datasets.
Nothing spells chaos like sales and marketing pulling in different directions. Aligning these teams can sometimes feel like trying to mix oil and water.
A covariance matrix helps both departments see the impact of their work on each other’s outcomes. When sales increase, is it because of the new ad campaign? The covariance matrix can tell you. It’s like having a referee in the game of departmental tug-of-war, ensuring everyone’s pulling together.
Ever wonder how the finance department’s budget adjustments affect manufacturing or how supply chain issues impact financial forecasts? Well, they’re all interconnected, and the covariance matrix is your go-to tool for seeing these connections clearly.
By analyzing the covariance between different financial and operational metrics, companies can pinpoint exactly where the strengths and vulnerabilities lie. It’s like having a roadmap where X marks the spots of opportunity and risk.
It’s one thing to have a bunch of strategies across different departments; it’s another to have them integrated and moving towards a common goal. The covariance matrix helps bridge these strategies by showing how changes in one area ripple through others.
For instance, if customer service tweaks its approach, how does that affect sales or product returns? This matrix helps you visualize and strategize over these interconnections, ensuring that the left hand knows what the right hand is doing—and more importantly, how it affects the bottom line.
Imagine you’re a detective, piecing together clues to form a complete picture of who someone is. That’s what it’s like using covariance matrix data to create personas.
Each trait or behavior isn’t just random; it’s a clue to understanding the bigger picture. With this data, you can figure out common patterns and traits among your customers. These patterns help in forming personas, fictional characters that represent your typical or ideal customers.
These aren’t just any characters; they’re based on real data, making them incredibly useful for targeting and marketing.
Now, let’s talk about making your marketing campaigns smarter. The covariance correlation formula isn’t just numbers and equations; it’s the secret sauce to boosting your campaign’s effectiveness.
This formula helps you see how different variables move together.
Do customers who buy product A usually buy product B? Do they prefer shopping online or in-store? Understanding these relationships helps you tailor your campaigns so that they speak directly to what your customers want and how they behave.
Lastly, let’s not forget about keeping those customers coming back. Enhancing customer loyalty programs with insights from covariance analysis can make a big difference.
This analysis helps identify which aspects of your service or products resonate most with your loyal customers. Are there specific products that keep them coming back?
Or maybe it’s a service perk that they can’t get enough of?
By knowing these relationships, you can fine-tune your loyalty programs, making them even more attractive to your customers, ensuring they stick around for the long haul.
Now, let’s talk about variance and covariance. These aren’t just math terms; they are your secret sauces for spotting growth opportunities.
Variance tells you how much a variable wiggles around its mean, and covariance tells you how much two variables move together. If that sounds a bit dry, think of it as finding out which products tend to sell well together or during certain times of the year.
Using this info, you can push high-performing products during peak times, bundle popular items, or even identify new markets with similar behaviors. It’s like being a business detective, where the clues are numbers, and the case to solve is how to grow faster and smarter.
Sample covariance comes into the spotlight when you’re considering market expansion. This statistical tool helps you see the relationship between different markets or customer behaviors.
By analyzing sample data, you can predict if a product that’s a hit in one area might do well in another. It’s a bit like testing the waters before you jump in with both feet.
Think of sample covariance as your scout, checking out uncharted territories for potential gold mines. If the numbers look promising, it might be time to set up shop and expand your footprint. It’s all about making smart moves, not just big ones.
Scaling is exciting, but it’s not without its challenges. This is where data insights come to the rescue. By diving into data, you can anticipate issues like supply chain disruptions or customer service needs before they become fires you need to put out.
Data insights help you prepare and plan, ensuring that your scaling journey is as smooth as possible. It’s like having a roadmap in an unfamiliar city; you might still hit traffic, but at least you won’t get lost!
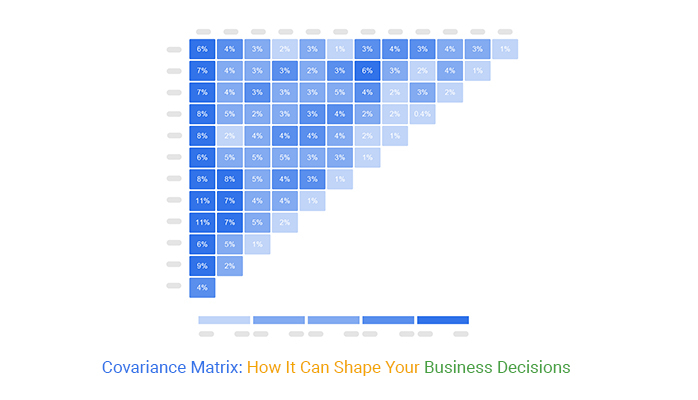
What is A Covariance Matrix?
A covariance matrix is a grid that shows how pairs of variables change together. It’s a tool used to understand the relationships between different data sets. Each cell in this matrix represents the covariance between two variables. If two variables tend to increase together, their covariance will be positive; if one increases while the other decreases, it’s negative. When you’re analyzing large sets of data, the covariance matrix can reveal how different factors might be influencing each other, helping you make smarter, data-driven decisions.
How is A Covariance Matrix Calculated?
Calculating a covariance matrix starts with collecting your data into rows (observations) and columns (variables). For each variable, you first find the mean. Then, subtract the mean from each value to get the deviations. By multiplying the deviations of two variables and averaging the result, you get the covariance for that pair. This process is repeated for every possible pair in your dataset, filling out the matrix. The resulting table shows how each variable relates to the others.
What is The Difference Between Covariance And Correlation?
Covariance and correlation both measure how two variables relate to each other, but they’re not the same. Covariance indicates the direction of the relationship—whether the variables move in the same direction or opposite ones. However, it doesn’t tell you how strong that relationship is. Correlation, on the other hand, not only shows the direction but also the strength of the relationship, scaling it between -1 and 1. Correlation is more standardized, making it easier to compare across different datasets.
Can a Covariance Matrix Help In Predicting Future Trends?
Yes, a covariance matrix is incredibly useful for predicting trends. By analyzing how variables have moved together in the past, businesses can forecast how they might behave in the future. For instance, if you see that higher marketing spend usually correlates with increased sales, you can anticipate the impact of adjusting your budget. The matrix offers a way to use historical data to guide strategic planning and decision-making.
How Does The Covariance Matrix Support Risk Management?
In finance and investment, the covariance matrix is a key tool for managing risk. By examining how different assets move together, investors can create a diversified portfolio that balances risk and return. For example, if two stocks have a high positive covariance, they are likely to perform similarly. By including assets with low or negative covariance in a portfolio, investors can reduce the overall risk, ensuring that losses in one area might be offset by gains in another.
What are The Limitations Of Using A Covariance Matrix?
While a covariance matrix is a powerful tool, it does have limitations. It only captures linear relationships, so if two variables have a non-linear connection, the matrix might not show it. Also, covariance values are sensitive to the scale of the data, which can distort interpretations. For instance, if one variable is measured in thousands and another in decimals, their covariance might appear misleadingly large or small. To overcome this, many analysts prefer to use correlation matrices for a clearer comparison.
Can a Covariance Matrix Be Used In Real-Time Data Analysis?
Yes, with the right tools, you can apply a covariance matrix to real-time data analysis. By continuously feeding new data into the matrix, businesses can monitor how variables shift together over time. This is especially useful in areas like stock trading or customer behavior tracking, where real-time adjustments can make a significant difference. By keeping an eye on these changing relationships, companies can stay agile and responsive.
What are Some Common Mistakes To Avoid When Using A Covariance Matrix?
One common mistake is confusing covariance with causation. Just because two variables move together doesn’t mean one causes the other to change. It’s also crucial to clean your data before using a covariance matrix, as missing or outlier values can skew results. Lastly, failing to consider the scale of your variables can lead to misinterpretations, so it’s often better to use correlation when comparing different data sets.
Understanding the covariance matrix can be important for your business. It’s more than a table of numbers; it’s a tool that reveals how different variables connect and influence one another. By using these insights, you can make smarter decisions, optimize resources, and drive growth in meaningful ways.
Whether you’re managing investments, planning marketing strategies, or analyzing customer behavior, a covariance matrix helps you see the patterns that matter. It highlights relationships that you might not catch at first glance, helping you focus on areas that truly impact your bottom line.
So, what’s next? It’s time to take your data analysis skills to the next level. Start experimenting with your own covariance matrices and see where the numbers lead you. The path to smarter decisions is right in front of you—grab it.
How much did you enjoy this article?


Calculate accounts receivable turnover ratio to measure credit collection speed, improve cash flow, and strengthen your financial strategy. Read on!

Change Management KPIs are the key to tracking adoption, performance, and ROI during transitions. Find out which metrics matter. Read on!

Data collection methods and techniques determine the quality of every insight you act on. Explore key approaches for gathering reliable data. Read on!


