Categories
What is commercial real estate reporting, and why does it matter more than ever?
Data drives decisions, especially in real estate, where one wrong move can cost millions. Commercial real estate reporting gives stakeholders the numbers they need without the fluff. It tracks performance, forecasts trends, and reveals where capital flows.


Today’s executives want more precision. They expect reporting to go beyond the basics. Monthly sales report templates and BI reporting now play a more significant role in evaluating commercial property portfolios. Dashboards show lease expiration timelines, occupancy trends, and net operating income at a glance. It’s fast, clean, and needed.
Pivot reporting transforms static data into actionable insights. Add a layer of intelligent segmentation, and suddenly, your report isn’t just readable—it’s powerful. The best reports do more than list numbers. An analytical report that breaks down tenant churn or location-specific growth gives investors a clear path forward.
Commercial real estate reporting is no longer optional; it’s the standard. From capital allocation to management reporting, every decision depends on data clarity.
As competition tightens, the value of precise reporting only grows. The next time someone asks where the market is heading, the answer won’t come from a gut feeling. It’ll come from a well-built, data-driven report.
Let’s explore further.
Definition: Commercial real estate reporting collects, analyzes, and presents data on commercial property performance. It covers leasing, sales, occupancy, and income trends. These reports help investors, brokers, and managers make informed decisions.
Tools like Pivot reporting and BI reporting organize extensive data sets into clear visuals. A strong analytical report may include rental rates, vacancy shifts, and asset values. These insights support more innovative strategies and reduce risk across portfolios.
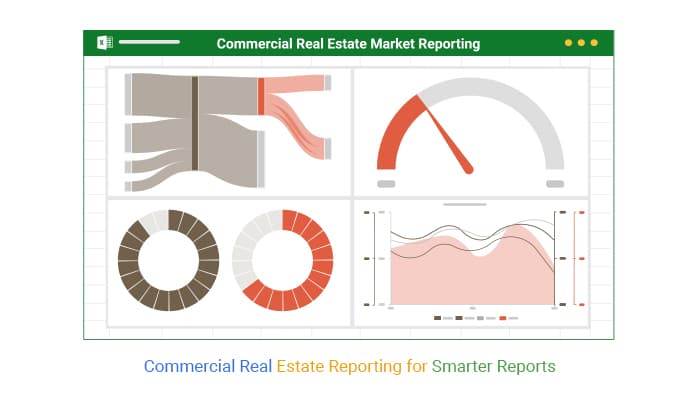
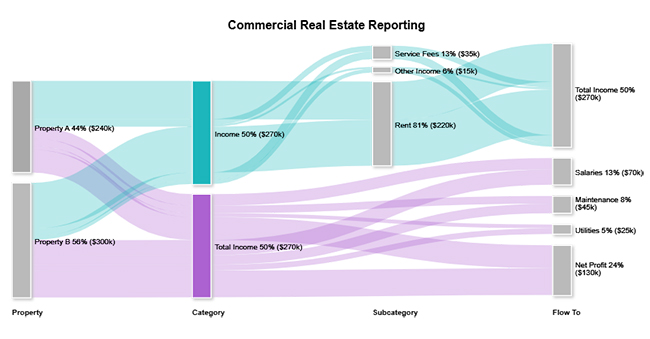
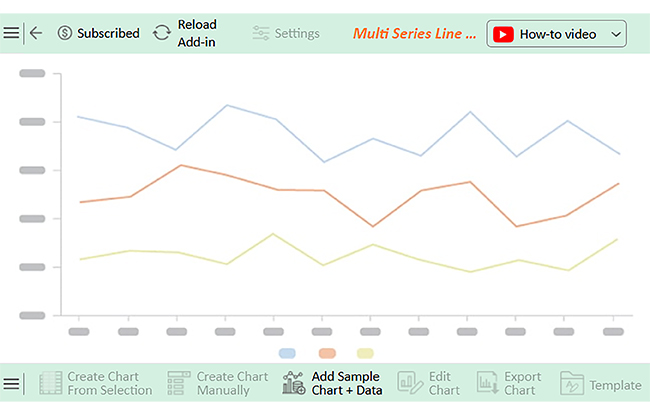
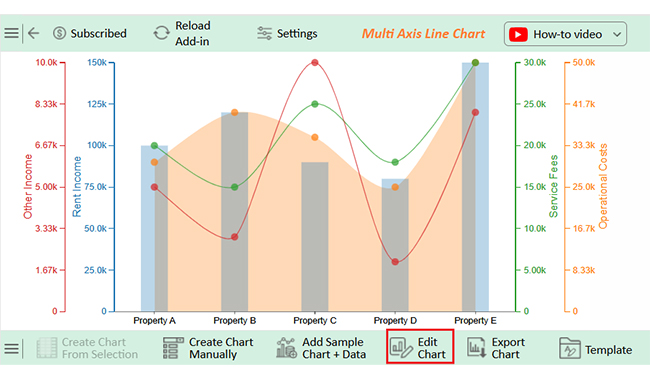
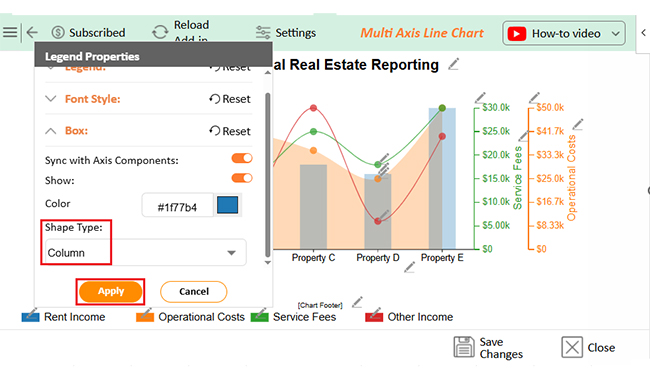
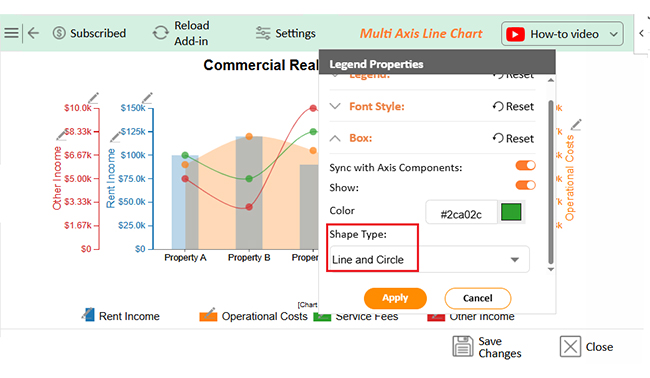
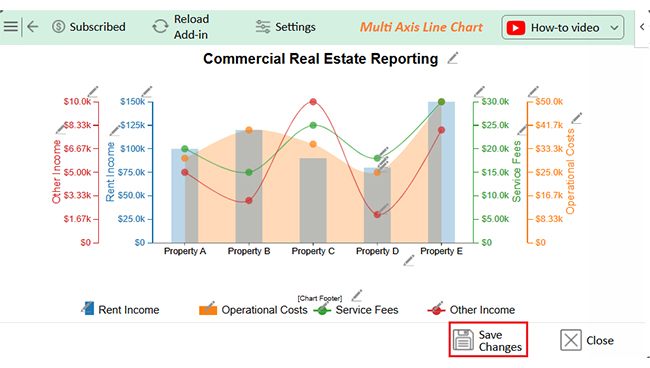
Check out the top charts to analyze commercial real estate reporting effectively. These charts were created using ChartExpo. This tool guarantees clear, impactful visuals in Excel.
Imagine investing millions without a map. That’s what skipping a commercial real estate reporting strategy feels like. Investors don’t gamble—they calculate. The right report turns a risky guess into a confident move.
How?
Timing is everything in commercial real estate. One wrong move can drain returns. Commercial real estate reporting gives clarity before you commit. It’s not about collecting data. It’s about using it at the right moment.
So, when is the right moment?
Commercial real estate isn’t a guessing game. It’s a numbers game—and the scoreboard is your report. But staring at Excel data rows won’t tell you the whole story. Sure, Excel is suitable for formulas, but it falls flat when visualizing market trends or investor-ready summaries.
That’s where ChartExpo steps in. It turns dry spreadsheets into dynamic visuals. Clear charts, quick insights, and smarter decisions. In commercial real estate reporting, seeing the data is half the battle. Visualizations in ChartExpo will help you win it.
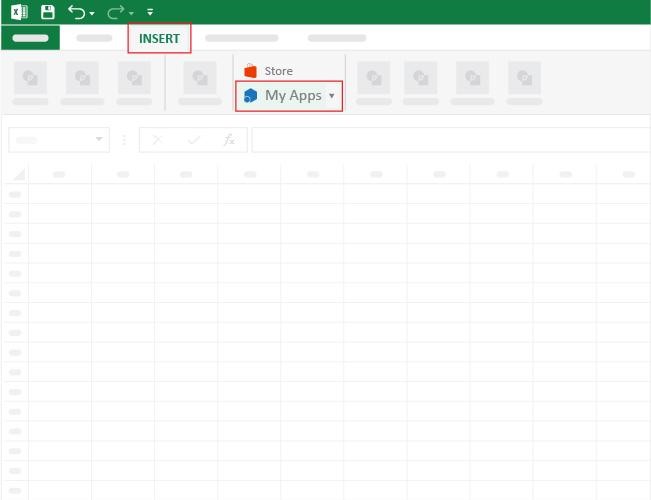
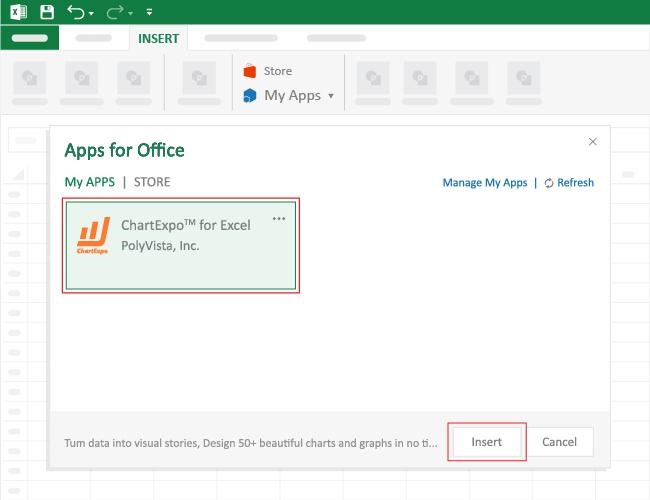
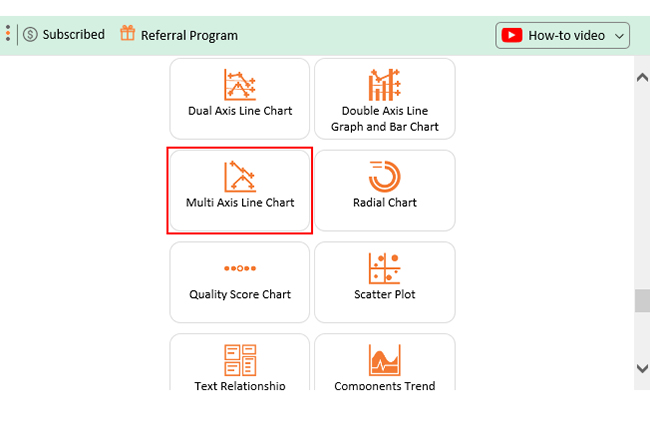
How to Install ChartExpo in Excel?
ChartExpo charts are available both in Google Sheets and Microsoft Excel. Please use the following CTAs to install the tool of your choice and create beautiful visualizations with a few clicks in your favorite tool.
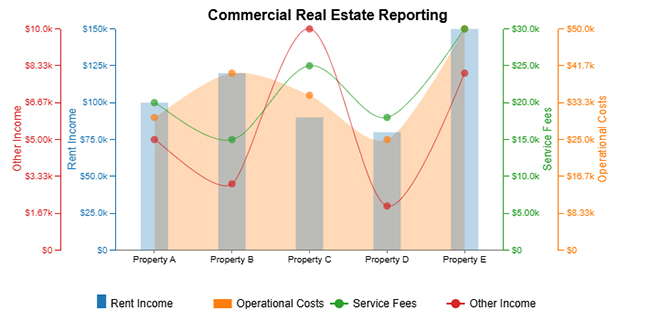
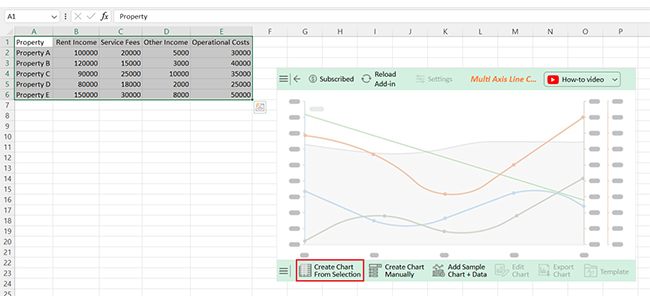
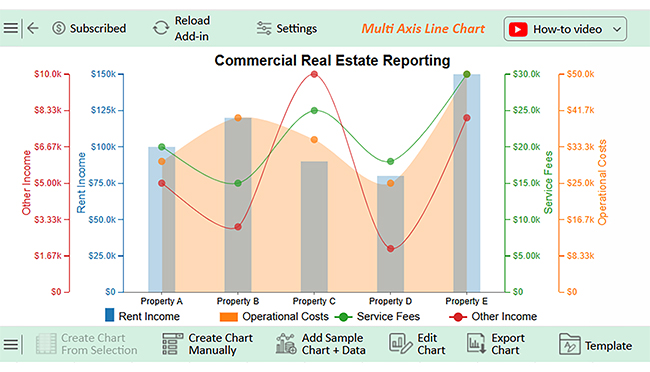
Let’s analyze this sample data in Excel using ChartExpo.
| Property | Rent Income | Service Fees | Other Income | Operational Costs |
| Property A | 100000 | 20000 | 5000 | 30000 |
| Property B | 120000 | 15000 | 3000 | 40000 |
| Property C | 90000 | 25000 | 10000 | 35000 |
| Property D | 80000 | 18000 | 2000 | 25000 |
| Property E | 150000 | 30000 | 8000 | 50000 |
Are you curious about jumping into industrial real estate? You’re not alone. This sector is booming, and the secret to smart investing lies in one thing: market reports. These aren’t just boring spreadsheets—they’re powerful tools.
Let’s break it down so you can use them like a pro.
Real estate market research isn’t about luck—it’s about strategy. Investors who succeed know precisely where to look and what to measure. The right approach can turn uncertainties into opportunities, and here’s how to make the most of your research.
A real estate property report shows key details about a property, including its value, condition, and ownership history. Investors and buyers use it to make informed decisions. It’s a snapshot of the property’s financial and physical status.
A real estate reporter gathers and shares news about property markets. They track trends, prices, and significant deals. Their work includes data analysis and interviews. Reports help investors, buyers, and developers stay informed about market shifts.
Commercial real estate reporting is more than numbers. It’s about understanding what drives property performance. You need data to act with confidence, and that’s where these reports come in.
They track income, expenses, vacancies, and trends. Each metric tells part of the story, but together, they show the full picture. Good reports lead to better choices.
Reports aren’t one-size-fits-all. Some focus on single properties, while others cover entire portfolios. Formats range from charts to detailed breakdowns.
Using tools improves reporting quality. Executive reporting examples offer structure. Templates like a monthly financial report template in Excel, save time and reduce errors.
A strong analytical report template adds value. It highlights problems before they grow and reveals opportunities others might miss.
In commercial real estate, guessing costs money. Reporting saves it. When done right, reports become powerful decision tools—clear, visual, and actionable. One way to level up your reporting game? Install ChartExpo. It transforms raw data into easy-to-read visuals so you can spot trends, risks, and opportunities.
How much did you enjoy this article?


Calculate accounts receivable turnover ratio to measure credit collection speed, improve cash flow, and strengthen your financial strategy. Read on!

Change Management KPIs are the key to tracking adoption, performance, and ROI during transitions. Find out which metrics matter. Read on!

Data collection methods and techniques determine the quality of every insight you act on. Explore key approaches for gathering reliable data. Read on!


