Categories
Mastering how to calculate the internal rate of return is essential for every business owner, investor, or finance professional. It will help you make a sound investment, project, or capital expenditure decisions.


The internal rate of return is a business evaluation metric that determines the profitability of an investment. In its study, McKinsey & Company states that IRR is the number one metric used for investment appraisal. Furthermore, AFP.com research shows that 84% of finance professionals use Excel.
IRR is best calculated using Excel because of its functions and formulas toolkit, which supports in-depth calculations. However, despite its commonality, many people lack the expertise to calculate IRR in Excel.
This blog post aims to equip you with the knowledge and confidence to leverage Excel for IRR calculations. We’ll walk you through the steps, common pitfalls, and best practices to calculate the internal rate of return in Excel.
By the end of this post, you’ll possess a valuable skill set that can drive sound financial decision-making. Moreover, it will enhance your professional toolkit.
First…
Definition: Internal Rate of Return (IRR) is a metric in investment assessment that measures profitability. When assessing investments, IRR considers cash flows over time. It calculates the discount rate where the net present value equals zero.
Finance professionals commonly use IRR to evaluate various investment opportunities. It acknowledges the timing and amount of cash flows, allowing you to assess whether the investment is worthwhile.
The higher the IRR, the more preferable the investment since it signifies better opportunities. Conversely, lower values of IRR indicate less attractive ventures.
Nevertheless, IRR must be evaluated with other factors, including risks and duration.
Definition: The IRR (Internal Rate of Return) function in Excel calculates the discount rate at which the net present value (NPV) of a series of cash flows becomes zero. It is used to evaluate the profitability of an investment or project.
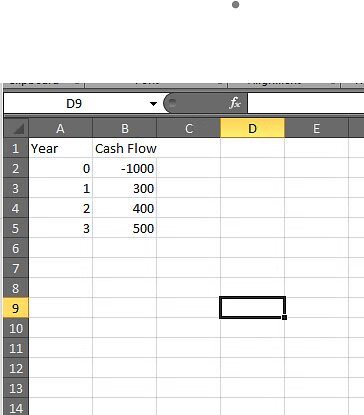
Let’s go through an example to understand how to use the IRR function in Excel.
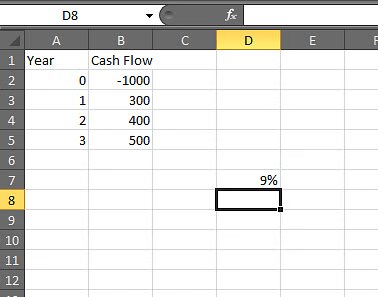
This result indicates that, based on the given investment and returns, the internal rate of return is approximately 9%, meaning the investment is expected to generate a 9% profit.
Two crucial metrics stand out when evaluating investment opportunities: Internal Rate of Return (IRR) and Net Present Value (NPV). While both are vital tools in reports on financial analysis, they have distinct characteristics and serve different purposes.
How do they differ?
Let’s find out.
| Metric | IRR | NPV |
| Definition | Measures the rate of return that makes the NPV of cash flows zero. | Is the difference between the present value of cash inflows and outflows. |
| Calculation | Finds the discount rate where the present value of cash inflows equals cash outflows. | The sum of present values of cash inflows minus the initial investment. |
| Interpretation | Higher IRR indicates better investment opportunities. | Positive NPV signifies profitable investments. |
| Sensitivity | Susceptible to multiple IRRs in complex cash flow patterns. | Provides a clear indication of the project’s profitability. |
| Decision-making | Used to compare and rank different investment projects. | Helps in determining whether an investment adds value to the firm. |
| Considerations | Considers the timing and magnitude of cash flows. | Considers the absolute value of cash flows without regard to their timing. |
Follow these steps to calculate the Internal Rate of Return (IRR) for an investment project using Excel.
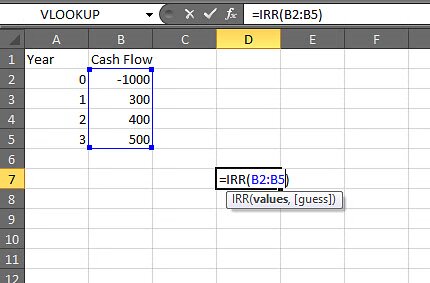
The syntax for the IRR function is: =IRR(values)
Let’s say your cash flows are in cells A1 through A5. A1 represents the initial investment, and A2 through A5 represents subsequent cash flows. You would input the following formula in a cell where you want the IRR displayed: =IRR(A1:A5)
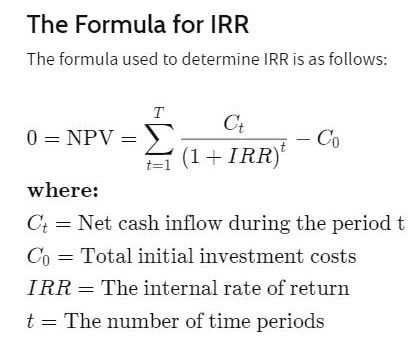
What is the internal rate of return equation?
Below is the formula to calculate the internal rate of return.
A company invests $10,000 and expects cash inflows of $2,500, $3,000, $3,500, $4,000, and $4,500 over the next five years. To calculate the IRR, enter these cash flows in a column and use the formula:
=IRR(B2:B7)
Press Enter, and Excel will return the IRR (%), representing the investment’s profitability.
Data analysis – the art of extracting meaning from raw numbers. It sounds straightforward until you face the rows and columns, trying to make sense of everything.
But don’t worry. We have the hero of the hour: data visualization. When analyzing the internal rate of return (IRR), seeing the story behind the numbers is paramount. But alas, while a trusty companion, Excel falls short in the visualization department.
Fear not; ChartExpo offers a solution to Excel’s visualization limitations. With ChartExpo, you can elevate your data analysis game. The visualizations bring life to your IRR insights, making those numbers dance with clarity and purpose. So, bid farewell to squinting at endless cells and embrace the power of visual storytelling with ChartExpo.
Let’s learn how to install ChartExpo in Excel.
ChartExpo charts are available both in Google Sheets and Microsoft Excel. Please use the following CTAs to install the tool of your choice and create beautiful visualizations with a few clicks in your favorite tool.
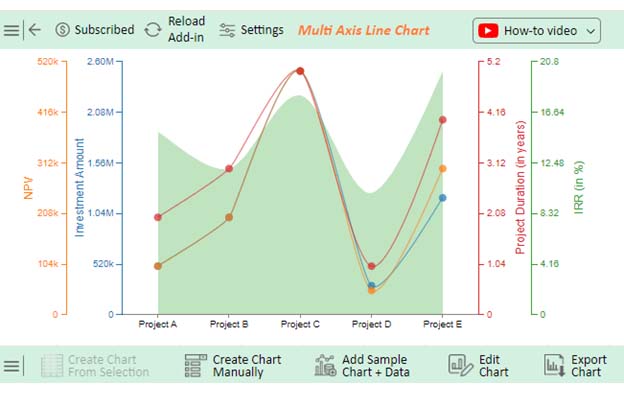
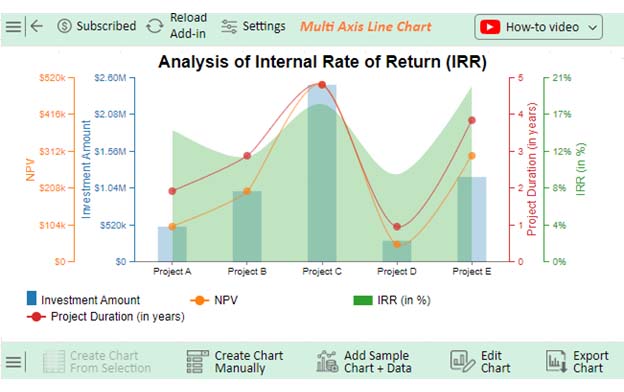
Let’s say you want to analyze the IRR sample data below.
| Project Name | Investment Amount | Project Duration (in years) | NPV | IRR (in %) |
| Project A | 500,000 | 2 | 100,000 | 15 |
| Project B | 1,000,000 | 3 | 200,000 | 12 |
| Project C | 2,500,000 | 5 | 500,000 | 18 |
| Project D | 300,000 | 1 | 50,000 | 10 |
| Project E | 1,200,000 | 4 | 300,000 | 20 |
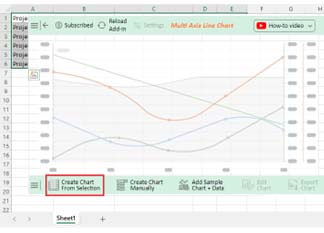
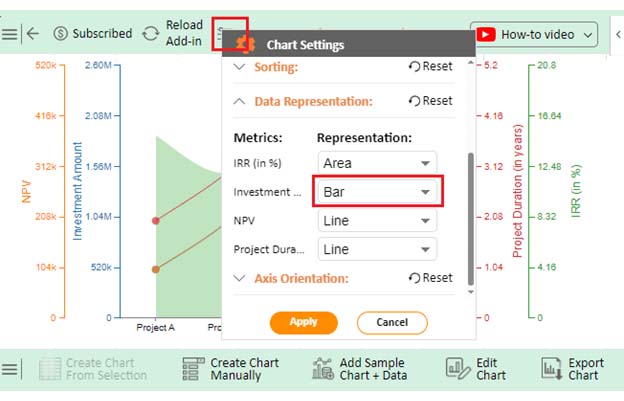
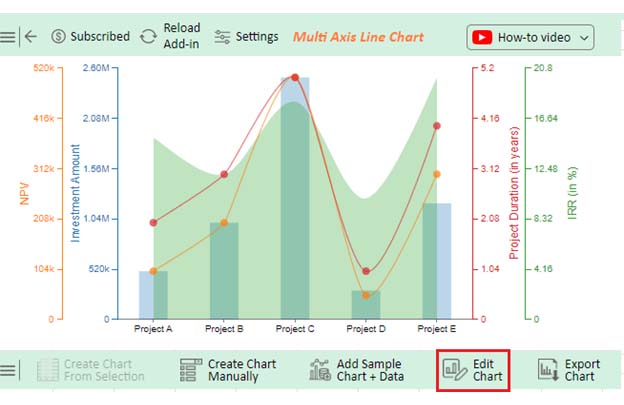
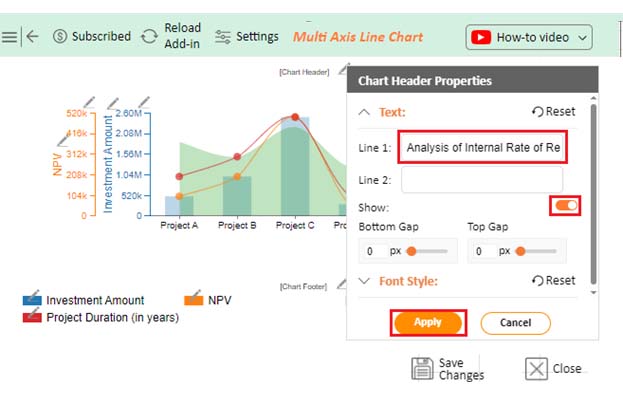
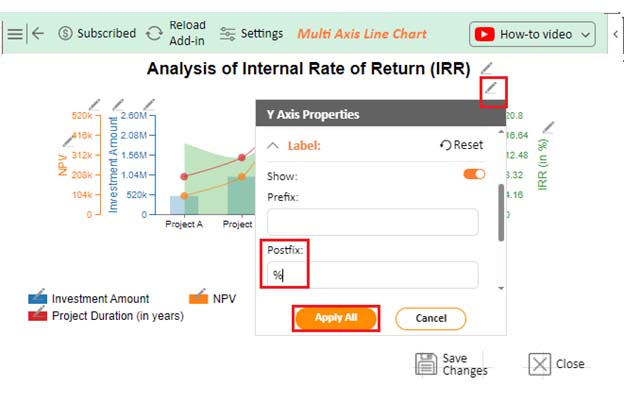
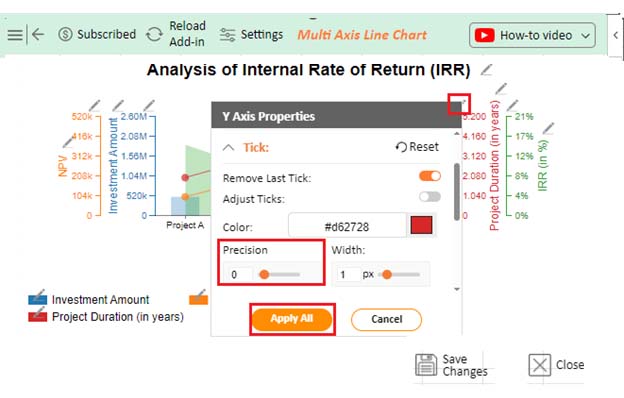
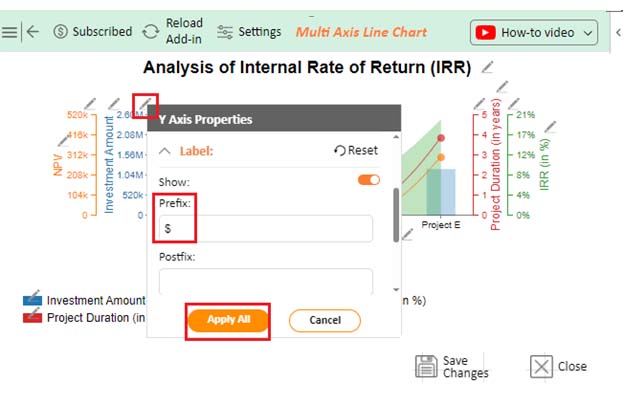
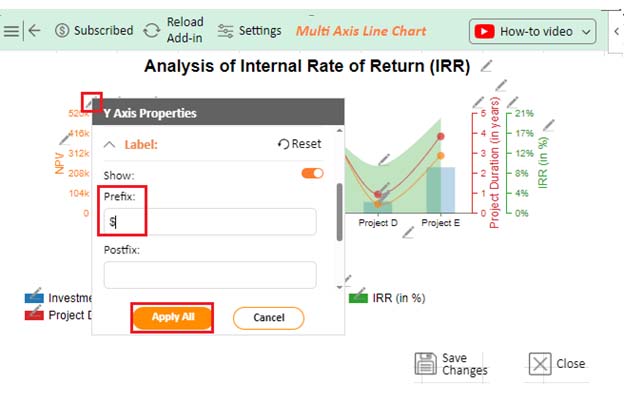
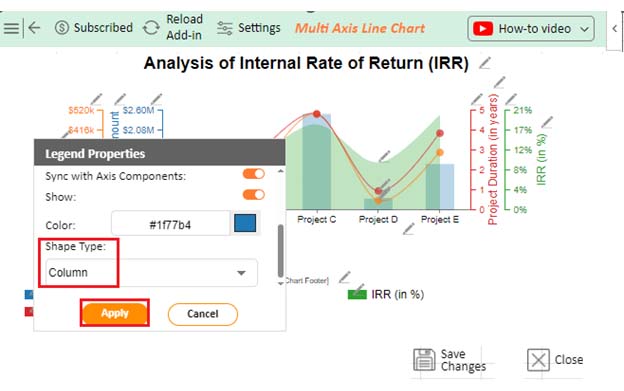
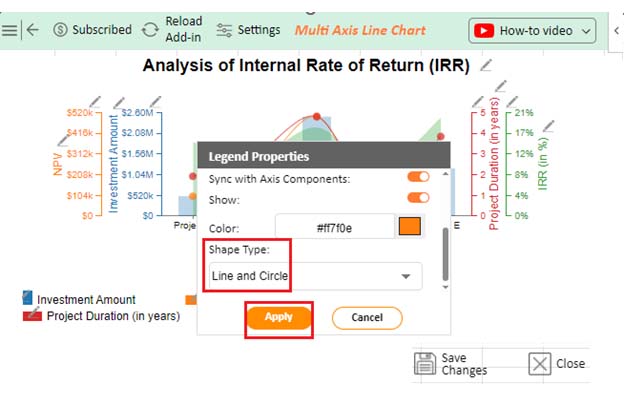
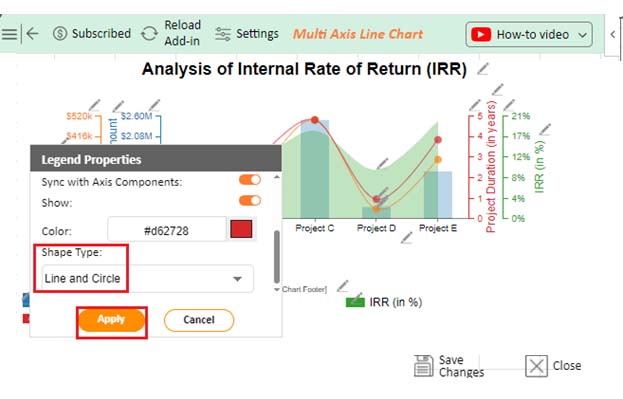
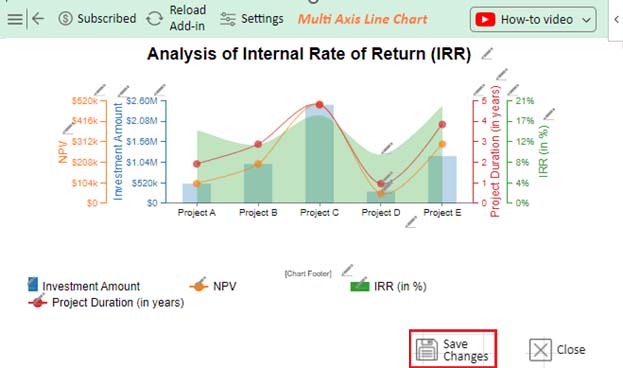
Follow these steps to visualize this data in Excel using ChartExpo and glean valuable insights for analyzing and interpreting data effectively.


Evaluating what constitutes a “good” IRR depends on various factors. Each factor is vital for assessing how appealing an investment opportunity is.
A good IRR should exceed the cost of capital, typically the weighted average cost of capital (WACC). Just as calculating a weighted average in Excel helps evaluate overall performance by assigning importance to different values, comparing IRR with WACC ensures the investment generates stronger returns than alternative opportunities.
IRR has to match the risk level associated with the investment. Riskier businesses may need higher IRR to reward investors appropriately.
Comparing the IRR to industry benchmarks provides context. What may be considered a good IRR in one industry might not be the same in another. Why? Variations in risk profiles and market conditions.
IRR should meet or exceed the investor’s return objectives. Investors may have different expectations based on risk tolerance, investment strategies, and financial goals.
Economic factors such as inflation rates, interest rates, and market stability influence what constitutes a good IRR. A higher IRR may be required during economic uncertainty or high inflation.
The time horizon of the investment also impacts the evaluation of IRR. Shorter-term investments may require higher IRRs to justify the opportunity cost of tying up capital. In contrast, longer-term investments may have lower IRR thresholds.
IRR helps determine whether an investment will generate a positive return. A higher IRR indicates a more profitable investment.
Businesses use IRR to compare multiple projects and select the one with the best return, ensuring efficient resource allocation.
Companies use IRR to assess whether opening a new branch or launching a new product will yield profitable returns.
IRR can be used to analyze loan agreements, comparing different financing options and their effective interest rates.
Investors use IRR to evaluate the long-term profitability of rental properties, factoring in purchase costs, rental income, and resale value.
Excel’s IRR function automates complex financial calculations, saving time and effort.
IRR helps businesses compare multiple investment opportunities to choose the most profitable one.
It aids in evaluating projects, ensuring funds are allocated to those with the highest returns.
IRR accounts for the timing of cash flows, making it more accurate than simple return calculations.
Used in project evaluations, real estate investments, and loan assessments, making it a valuable tool for decision-making.
In Excel, NPV calculates the present value of cash flows. Conversely, IRR finds the discount rate where NPV equals zero, indicating project profitability. NPV gives monetary value, while IRR gives a percentage return.
IRR simplifies comparison between projects regardless of scale or initial investment. It provides a single percentage metric for assessing relative profitability.
IRR may produce multiple solutions in complex cash flow patterns, confusing. It doesn’t consider the scale of investment or magnitude of cash flows, potentially leading to misinterpretation.
Excel-based IRR calculation is an essential skill in financial analysis. The features built into the program make it quick and easy to evaluate investment projects.
If you understand IRR, you will be able to make more informed decisions and determine how lucrative each project is. The easy-to-use Excel IRR calculator is invaluable to financial analysts. It helps you evaluate cash flows and pick the best project to invest in.
Moreover, you can evaluate various scenarios and compare investment alternatives effortlessly.
However, it’s essential to interpret IRR results cautiously. Consider factors such as cash flow patterns, risk profiles, and project timelines. Excel’s versatility extends beyond basic calculations. It offers advanced sensitivity analysis and scenario modeling features and enhances decision-making capabilities.
The journey doesn’t end here.
Continuous practice and familiarity with Excel’s functions will sharpen your financial analysis skills. This empowers you to navigate complex investment landscapes confidently.
Conclusively, learning to calculate IRR in Excel equips you with the tools needed to make sound investment decisions.
Do not hesitate.
Start calculating and analyzing IRR in Excel using ChartExpo today to achieve financial success.
How much did you enjoy this article?


Learn how to use sparklines in Excel to quickly visualize trends inside cells. Discover types, creation steps, customization, use cases, benefits, and best practices.

Learn what a confidence interval graph is, how to create it in Excel, and how to interpret results to make more reliable, data-driven decisions.

A correlation matrix in Excel helps identify relationships between variables. Learn how to create, read, and use it for effective data analysis.


