• Home
  • Tools dropdown img
    • Spreadsheet Charts

      • ChartExpo for Google Sheets
      • ChartExpo for Microsoft Excel
    • Power BI Charts

      • Power BI Custom Visuals by ChartExpo
    • Word Cloud

  • Charts dropdown img
    • Chart Category

      • Bar Charts
      • Circle Graphs
      • Column Charts
      • Combo Charts
      • Comparison Charts
      • Line Graphs
      • PPC Charts
      • Sentiment Analysis Charts
      • Survey Charts
    • Chart Type

      • Box and Whisker Plot
      • Clustered Bar Chart
      • Clustered Column Chart
      • Comparison Bar Chart
      • Control Chart
      • CSAT Survey Bar Chart
      • CSAT Survey Chart
      • Dot Plot Chart
      • Double Bar Graph
      • Funnel Chart
      • Gauge Chart
      • Likert Scale Chart
      • Matrix Chart
      • Multi Axis Line Chart
      • Overlapping Bar Chart
      • Pareto Chart
      • Radar Chart
      • Radial Bar Chart
      • Sankey Diagram
      • Scatter Plot Chart
      • Slope Chart
      • Sunburst Chart
      • Tornado Chart
      • Waterfall Chart
      • Word Cloud
    • Google Sheets
      Microsoft Excel
  • Services
  • Pricing
  • Contact us
  • Blog
  • Support dropdown img
      • Gallery
      • Videos
      • Contact us
      • FAQs
      • Resources
    • Please feel free to contact us

      atsupport@chartexpo.com

Categories
All Data Visualizations Data Analytics Surveys
Add-ons/
  • Google Sheets
  • Microsoft Excel
  • Power BI
All Data Visualizations Data Analytics Surveys
Add-ons
  • Google Sheets
  • Microsoft Excel
  • Power BI

We use cookies

This website uses cookies to provide better user experience and user's session management.
By continuing visiting this website you consent the use of these cookies.

Ok

ChartExpo Survey


Home > Blog > Data Analytics

Budget vs Forecast: Insights for Financial Success

Budgeting versus forecasting—what’s the difference, and why does it matter?

Budget vs Forecast

Every business, from startups to global giants, needs a plan. But a plan without numbers is a wish. And numbers without direction? Chaos. That’s where budgeting and forecasting step in.

A budget sets your goals, while a forecast shows your path. Together, they shape your strategy. However, they’re not the same thing. Understanding the distinction can sharpen your decision-making.

Think of a budget as a snapshot. It’s your best guess before the year begins—a forecast, on the other hand, updates that guess with fresh data. Businesses updating monthly forecasts are three times more likely to reach their annual targets. Yet, over 45% of small businesses admit they rarely update their budgets once they’re set. This gap creates risk.

Budgeting versus forecasting is more than a technical discussion—it affects cash flow, hiring, investments, and inventory. Misunderstanding it can lead to costly mistakes. Smart companies combine both tools. They build and refine a solid budget with forecasts as new data rolls in. That’s how agile teams stay ahead.

Whether creating monthly budget examples or an annual small business expense report, this tool keeps things organized. Clear numbers guide better decisions.

Budgeting versus forecasting isn’t a debate. It’s a strategy—when used correctly.

Are you ready to make smarter financial moves? Let’s get started…

Table of Contents:

  1. What is Budgeting Versus Forecasting?
  2. Why Do Businesses Need Both Budgeting and Forecasting?
  3. What are the Key Differences Between Budget and Forecast?
  4. How to Analyze Budgeting and Forecasting in Excel?
  5. What are the Common Challenges with Budgeting vs. Forecasting?
  6. What are the Limitations of Forecasting vs. Budgeting?
  7. FAQs
  8. Wrap Up

What is Budgeting Versus Forecasting?

Definition: Budgeting versus forecasting refers to two key planning tools in finance. Budgeting sets fixed goals for income and expenses over a set period. It acts as a financial roadmap. Forecasting, on the other hand, predicts future outcomes based on current and past data. It’s updated regularly to reflect changes.

While budgeting is static, forecasting is flexible. Both tools guide smart decisions. Therefore, understanding the distinction between budget examples and expense report templates in Excel is crucial for effective planning.

Top Five Charts to Show Budgeting Versus Forecasting

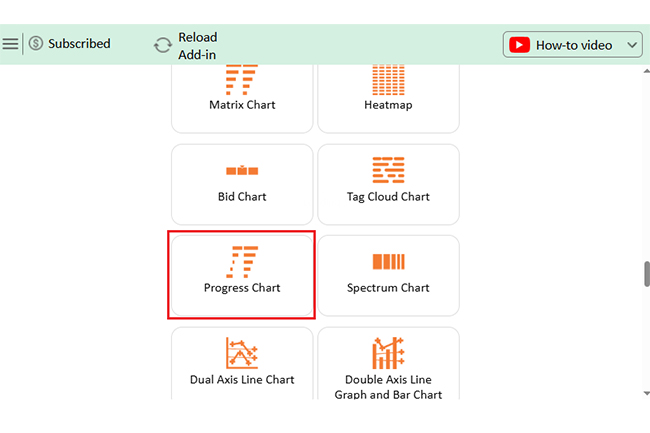
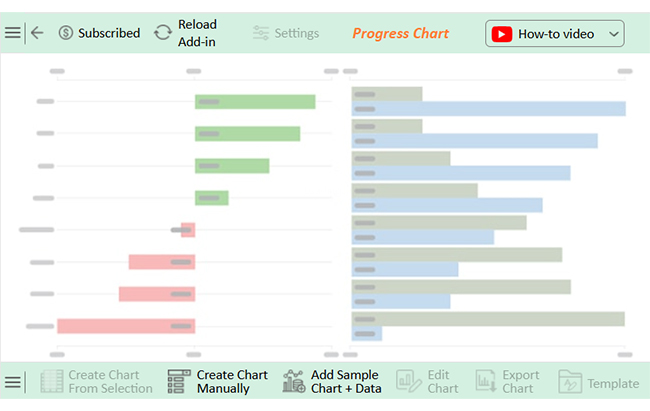
Discover the top 5 charts for analyzing budgeting vs. forecasting, all made with ChartExpo. These visuals simplify trends, comparisons, and performance at a glance.

Progress Chart:

Budget vs Forecast

Clustered Bar Chart:

Budget vs Forecast

Overlapping Bar Chart:

Budget vs Forecast

Tornado Char

Budget vs Forecast

Pareto Bar Chart:

Budget vs Forecast

Why Do Businesses Need Both Budgeting and Forecasting?

Why do smart businesses rely on both budgeting and forecasting? While having a plan is good, adjusting it in real-time is even better. One gives structure, and the other provides flexibility. They create a system that helps companies survive uncertainty and grow confidently. Here’s why both matter:

  • Clear financial planning (budgeting): Budgeting gives you a spending plan before the money moves. For instance, using a construction budget spreadsheet keeps your finances focused and intentional.
  • Adaptability and real-time decision-making (forecasting): Forecasting helps you respond quickly to changes. If sales drop or costs spike, you can adjust course without blowing your budget.
  • Performance monitoring: With both tools, you compare your current position to your planned position. This helps catch issues early and keeps teams aligned with business goals.
  • Better risk management: Budgets set boundaries, and forecasts spot threats. This combination helps you avoid surprises, like cash shortfalls or unexpected losses.
  • Investor and stakeholder confidence: Clear budgets show discipline, while forecasts show you’re paying attention. Updating expenses or presenting to investors shows you’re in control and planning ahead.

What are the Key Differences Between Budget and Forecast?

Have you ever confused a budget and a forecast? You’re not alone. Although they sound similar, they work very differently. Knowing the difference can help you plan better and faster and avoid costly mistakes.

Here’s a simple breakdown:

Aspect Budget Forecast
Purpose Sets financial goals and limits. Predicts future outcomes based on current trends.
Nature Fixed once approved. Dynamic and updated regularly.
Scope Covers full-year targets and spending plans. Focuses on short-term projections or specific scenarios.
Timeframe Often yearly or quarterly. It can be monthly, quarterly, or rolling.
Flexibility Inflexible—used to enforce spending control. Flexible—used to react to market or internal changes.
Use Case It is ideal for planning with tools like a construction budget spreadsheet Useful for updates in a small business expense report during uncertain times.

How to Analyze Budgeting and Forecasting in Excel?

Have you ever tried explaining your budget with a sea of spreadsheets? It’s as exciting as watching paint dry—on a rainy day.

What is budgeting versus forecasting? It’s a question that matters, mainly when your financial future depends on clear insights. These tools shape decisions, but raw numbers don’t tell the whole story. That’s where data visualization steps in. It makes trends pop and problems obvious.

Enter ChartExpo—a tool built to transform your data into clear, powerful visuals inside Excel. No stress. No coding. Just smart, stunning charts that make your budgeting and forecasting come alive.

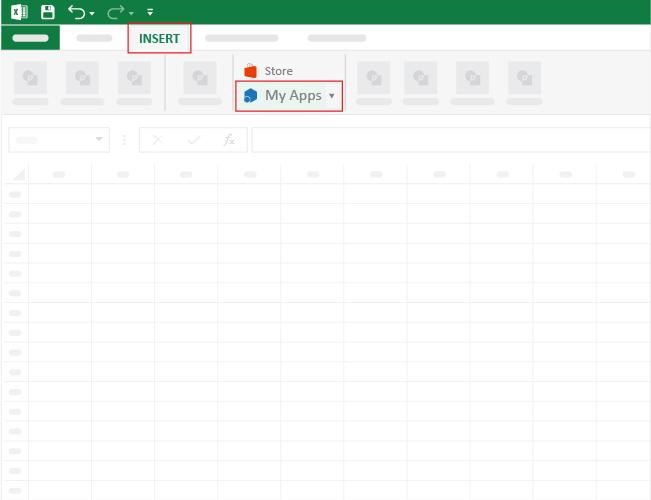
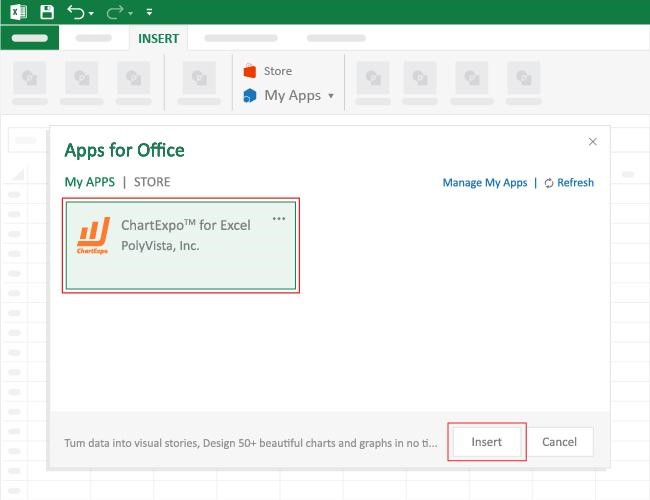
How to Install ChartExpo in Excel?

  1. Open your Excel application.
  2. Open the worksheet and click the “Insert” menu.
  3. You’ll see the “My Apps” option.
  4. In the Office Add-ins window, click “Store” and search for ChartExpo on my Apps Store.
  5. Click the “Add” button to install ChartExpo in your Excel.

ChartExpo charts are available both in Google Sheets and Microsoft Excel. Please use the following CTAs to install the tool of your choice and create beautiful visualizations with a few clicks in your favorite tool.

Example

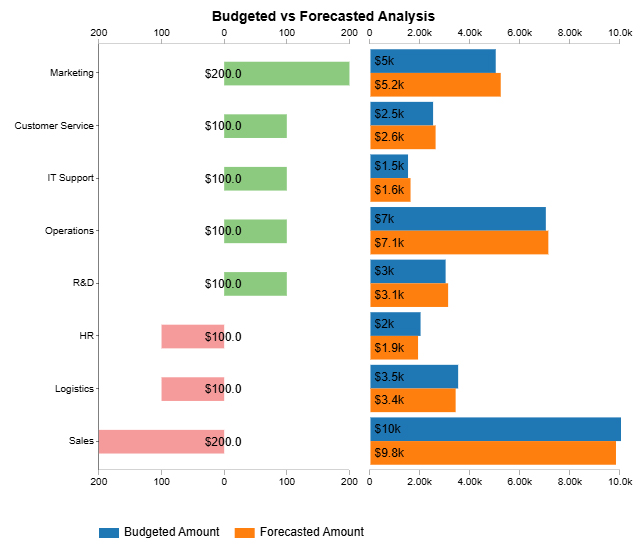
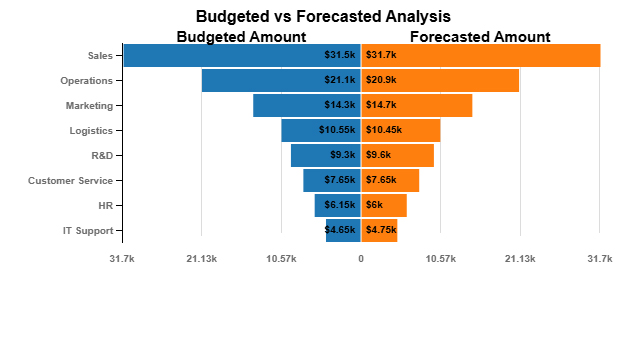
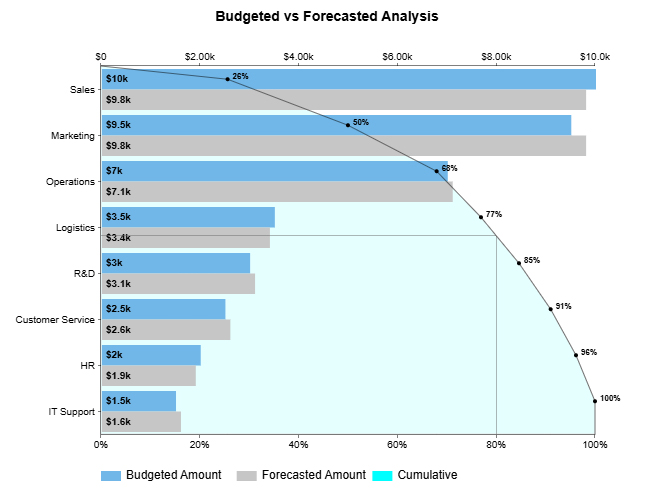
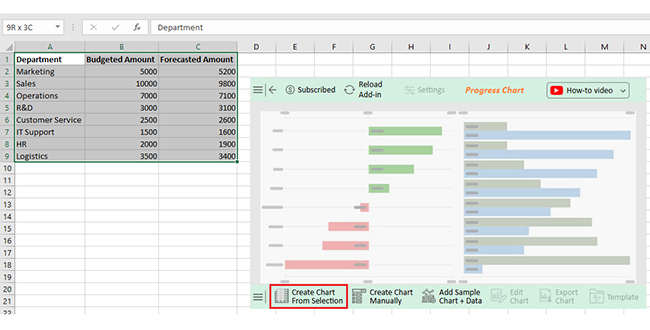
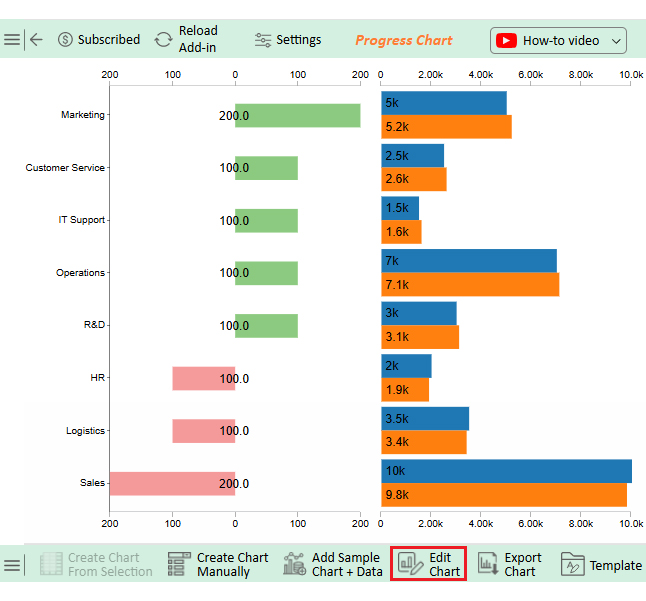
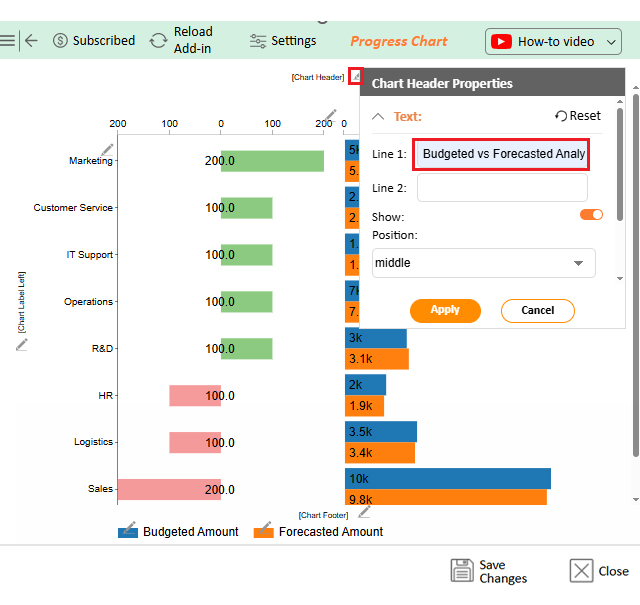
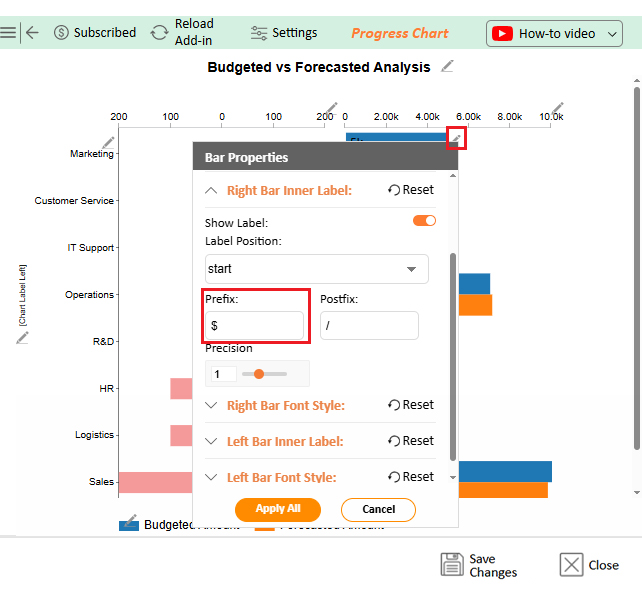
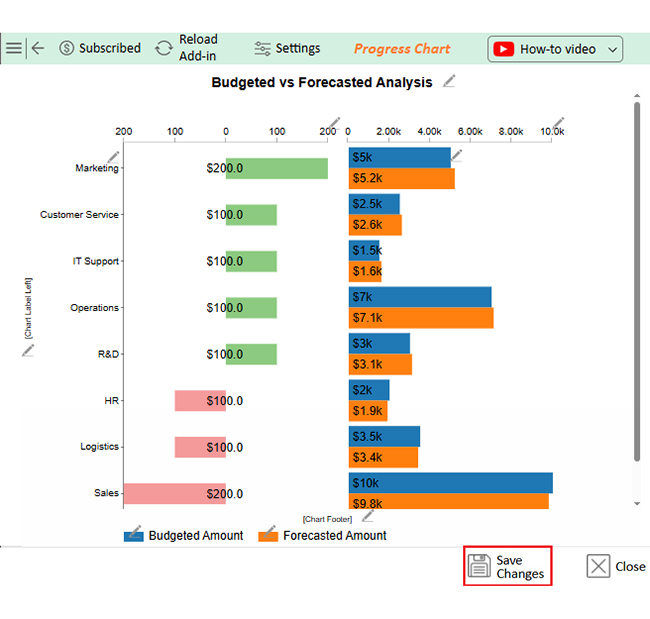
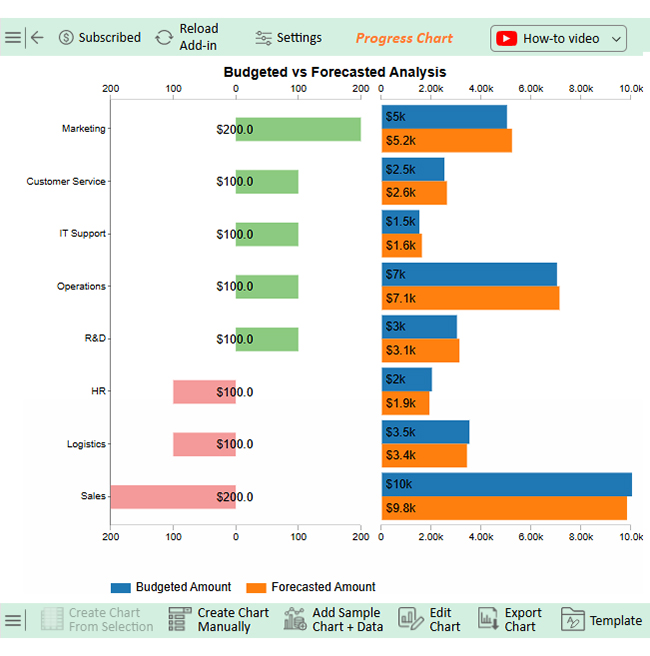
Let’s analyze this sample data in Excel using ChartExpo.

Department Budgeted Amount Forecasted Amount
Marketing 5000 5200
Sales 10000 9800
Operations 7000 7100
R&D 3000 3100
Customer Service 2500 2600
IT Support 1500 1600
HR 2000 1900
Logistics 3500 3400
  • To get started with ChartExpo, install ChartExpo in Excel.
  • Now, click on My Apps from the INSERT menu.
Budget vs Forecast
  • Choose ChartExpo from My Apps, then click Insert.
Budget vs Forecast
  • Once it loads, scroll through the charts list to locate and choose the “Progress Chart”.
Budget vs Forecast
  • The Progress Chart will appear as below.
Budget vs Forecast
  • Click the “Create Chart From Selection” button after selecting the data from the sheet, as shown.
Budget vs Forecast
  • ChartExpo will generate the visualization below for you.
Budget vs Forecast
  • If you want to add anything to the chart, click the Edit Chart button:
  • Click the pencil icon next to the Chart Header to change the title.
  • It will open the properties dialog. Under the Text section, you can add a heading in Line 1 and enable Show.
  • Give the appropriate title of your chart and click the Apply button.
Budget vs Forecast
  • You can add the dollar sign with axis values as follows.
Budget vs Forecast
  • Click the “Save Changes” button to persist the changes made to the chart.
Budget vs Forecast
  • Your final Progress Chart will look like the one below.
Budget vs Forecast

Insights

  • The sales department used the highest budget, spending $200 more than forecasted.
  • The marketing department used the full $5,000 budgeted amount, spending $200 less than forecasted.

What are the Common Challenges with Budgeting vs. Forecasting?

Budgeting and forecasting sound great—until real-world problems kick in. Numbers don’t always add up, teams fall behind, and tools clash. And what worked last quarter? Suddenly useless. These challenges can trip you up fast when updating a budget deficit by year graph. Here’s what to watch for:

  • Data accuracy and availability: Good inputs equal good outputs. But if your data is outdated or scattered, both your budget and forecast fall apart.
  • Static budgets vs. dynamic environments: A budget made in January may not survive July. Markets change fast, and static plans can’t keep up.
  • Time-consuming processes: Manual entry, spreadsheets, endless revisions—it all takes time. That time delays decisions when you need speed.
  • Over-reliance on estimates: Guesses fill the gaps when real data isn’t available. Too many guesses and your numbers become fiction.
  • Lack of integration: When systems don’t talk to each other, your budget and forecast become disconnected. That creates confusion, duplication, and missed insights.
  • Resistance to change: Some teams fear shifting forecasts, adjusting budgets, and clinging to old plans in a fast-moving business. That’s the real risk.

What are the Limitations of Forecasting vs. Budgeting?

No tool is perfect—not even budgeting or forecasting. They help guide decisions, but they also come with trade-offs. Think of them as your financial GPS. When tracking trends in a budget deficit by year graph, knowing the limits helps you plan smarter.

Limitations of budgeting

  • Static nature: Once locked in, budgets rarely change—even when your business does. That makes them less useful in unpredictable situations.
  • Time-consuming: Building detailed budgets takes weeks or even months. By the time it’s done, some data may already be outdated.
  • Overly optimistic or conservative: Budgets often reflect hopes or fears, not reality. This skews planning and can lead to poor resource use.
  • Encourages spending to meet targets: Teams sometimes spend unused funds to avoid budget cuts. That leads to waste, not efficiency.

Limitations of forecasting

  • Reliance on historical data: Forecasts often assume the past predicts the future. However, trends can shift quickly, making that assumption risky.
  • Frequent updates are needed: Forecasts lose value quickly if they are not refreshed, so constant tracking, analysis, and adjustments are necessary.
  • Uncertainty and assumptions: Forecasting depends on what might happen. Too many unknowns can weaken accuracy.
  • Potential for bias: Forecasts are built by people, and people bring their opinions. Optimism or fear can skew the numbers.

FAQs

What is an example of a budget and forecast?

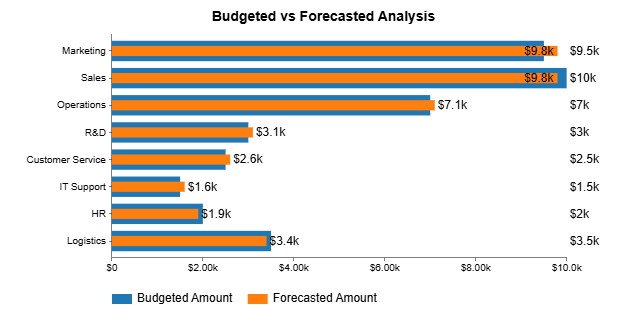
A company budgets $10,000 for monthly marketing. The forecast predicts $9,500 based on recent trends. The budget sets the plan, while the forecast adjusts it using real data.

How to do budgeting and forecasting in Excel?

  • Open a template or create your own.
  • Enter historical income and expenses.
  • Set budget targets for future periods.
  • Use formulas to project forecasts.
  • Update regularly with actual data.
  • For visuals, use ChartExpo to enhance Excel’s charting limitations

Wrap Up

Budgeting versus forecasting—now you know the difference. Budgets set the plan, while forecasts adjust that plan using real data. Both are important. Together, they help you stay in control.

A strong budget gives you direction and shows where your money should go. Are you learning how to create a monthly budget in Excel or manage a team? Budgeting is the foundation. It helps you set limits, track progress, and avoid overspending.

Forecasting adds flexibility. It reacts to real-time changes. If your income drops or expenses rise, forecasts help you adjust fast. That makes your planning smarter, not rigid.

Excel is a powerful place to start. You can use templates like an expense report template in Excel to track actual spending. Or create custom spreadsheets for different needs. It’s simple but effective.

If you own properties, a rental property expenses spreadsheet can show trends. Combine your budget with forecasts to manage vacancies, repairs, and cash flow. This will make your investments more predictable.

In conclusion, budgeting sets the goal, while forecasting keeps it real. Use both, and you’ll make decisions with confidence, not guesswork. Moreover, install ChartExpo to make confident, data-driven decisions with insightful, appealing data visuals.

How much did you enjoy this article?

PBIAd1
Start Free Trial!
154205

Related articles

next previous
Data Analytics12 min read

What is an Energy Flow Diagram & How to Create it?

Explore the world of Energy Flow Diagrams using the Sankey Chart. Discover how these diagrams offer clarity in understanding energy systems.

Data Analytics8 min read

Progress Report Template: A Complete Guide

Progress report templates track progress, improve clarity, and support team goals. Click here to learn how to create, analyze, and enhance reports using Excel.

Data Analytics7 min read

Energy Dashboard: Insights for Energy Tracking

This guide dives deep into what the energy dashboard is, the key features of an energy dashboard, and how to use it. You'll also discover how to create one.

Data Analytics7 min read

Energy Budgeting: A Complete Visual Guide

This guide shows you everything you need to know about energy budgeting. You'll also discover the benefits of calculating the Earth's energy budget.

Data Analytics15 min read

Top 6 Visualizations for Quantitative Data Analysis Methods

Explore top quantitative data analysis methods to summarize, interpret, and visualize numerical data for smarter, data-driven decision-making.

ChartExpo logo

Turn Data into Visual
Stories

CHARTEXPO

  • Home
  • Gallery
  • Videos
  • Services
  • Pricing
  • Contact us
  • FAQs
  • Privacy policy
  • Terms of Service
  • Sitemap

TOOLS

  • ChartExpo for Google Sheets
  • ChartExpo for Microsoft Excel
  • Power BI Custom Visuals by ChartExpo
  • Word Cloud

CATEGORIES

  • Bar Charts
  • Circle Graphs
  • Column Charts
  • Combo Charts
  • Comparison Charts
  • Line Graphs
  • PPC Charts
  • Sentiment Analysis Charts
  • Survey Charts

TOP CHARTS

  • Sankey Diagram
  • Likert Scale Chart
  • Comparison Bar Chart
  • Pareto Chart
  • Funnel Chart
  • Gauge Chart
  • Radar Chart
  • Radial Bar Chart
  • Sunburst Chart
  • see more
  • Scatter Plot Chart
  • CSAT Survey Bar Chart
  • CSAT Survey Chart
  • Dot Plot Chart
  • Double Bar Graph
  • Matrix Chart
  • Multi Axis Line Chart
  • Overlapping Bar Chart
  • Control Chart
  • Slope Chart
  • Clustered Bar Chart
  • Clustered Column Chart
  • Box and Whisker Plot
  • Tornado Chart
  • Waterfall Chart
  • Word Cloud
  • see less

RESOURCES

  • Blog
  • Resources
  • YouTube
SIGN UP FOR UPDATES

We wouldn't dream of spamming you or selling your info.

© 2025 ChartExpo, all rights reserved.