• Home
  • Tools dropdown img
    • Spreadsheet Charts

      • ChartExpo for Google Sheets
      • ChartExpo for Microsoft Excel
    • Power BI Charts

      • Power BI Custom Visuals by ChartExpo
    • Word Cloud

  • Charts dropdown img
    • Chart Category

      • Bar Charts
      • Circle Graphs
      • Column Charts
      • Combo Charts
      • Comparison Charts
      • Line Graphs
      • PPC Charts
      • Sentiment Analysis Charts
      • Survey Charts
    • Chart Type

      • Box and Whisker Plot
      • Clustered Bar Chart
      • Clustered Column Chart
      • Comparison Bar Chart
      • Control Chart
      • CSAT Survey Bar Chart
      • CSAT Survey Chart
      • Dot Plot Chart
      • Double Bar Graph
      • Funnel Chart
      • Gauge Chart
      • Likert Scale Chart
      • Matrix Chart
      • Multi Axis Line Chart
      • Overlapping Bar Chart
      • Pareto Chart
      • Radar Chart
      • Radial Bar Chart
      • Sankey Diagram
      • Scatter Plot Chart
      • Slope Chart
      • Sunburst Chart
      • Tornado Chart
      • Waterfall Chart
      • Word Cloud
    • Google Sheets
      Microsoft Excel
  • Services
  • Pricing
  • Contact us
  • Blog
  • Support dropdown img
      • Gallery
      • Videos
      • Contact us
      • FAQs
      • Resources
    • Please feel free to contact us

      atsupport@chartexpo.com

Categories
All Data Visualizations Data Analytics Surveys
Add-ons/
  • Google Sheets
  • Microsoft Excel
  • Power BI
All Data Visualizations Data Analytics Surveys
Add-ons
  • Google Sheets
  • Microsoft Excel
  • Power BI

We use cookies

This website uses cookies to provide better user experience and user's session management.
By continuing visiting this website you consent the use of these cookies.

Ok

ChartExpo Survey


Home > Blog > Data Analytics

Employee Turnover Rate: Definition, Formula & Insights

Employee turnover rate is a key metric that helps organizations understand how frequently employees leave and are replaced within a specific period.

Employee Turnover Rate

It reflects not only workforce stability but also the overall health of a company’s culture, management practices, and employee satisfaction.

A high turnover rate may indicate underlying issues such as poor engagement, limited growth opportunities, or ineffective leadership, while a low rate often signals a supportive and well-managed work environment.

Monitoring employee turnover rate allows businesses to identify patterns, address challenges, and make informed decisions to retain top talent. It also plays a crucial role in workforce planning, budgeting, and improving organizational performance.

By analyzing this metric, companies can take proactive steps to enhance employee experience and build a more productive and committed workforce.

What is an Employee Turnover Rate?

Definition: Employee turnover rate is a metric that measures the percentage of employees who leave an organization during a specific period and are replaced by new hires.

It helps businesses understand how often staff changes occur within their workforce. This rate includes both voluntary exits, such as resignations, and involuntary ones, like terminations.

By tracking employee turnover rate, organizations can evaluate workforce stability, identify potential issues, and take steps to improve employee retention and overall workplace satisfaction.

Why is Employee Turnover Rate Important?

Employee turnover rate directly reflects how stable and efficient an organization is in managing its workforce. It impacts overall performance, costs, and the ability to sustain long-term growth.

  • Workforce stability measurement: Helps assess how consistently employees stay with the organization over time.
  • Hiring and training cost control: Reduces expenses related to recruiting, onboarding, and training new employees.
  • Employee satisfaction tracking: Indicates how engaged and satisfied employees are with their roles and work environment.
  • Productivity and performance impact: Frequent turnover can disrupt workflows and lower team efficiency.
  • Long-term business growth planning: Supports better decision-making for scaling teams and maintaining continuity.
  • Improved retention strategies: Provides insights to identify gaps and build effective employee retention plans.

Different Types of Employee Turnover

Employee turnover can occur for many reasons, and understanding its different types helps organizations identify underlying issues and improve retention strategies. Each type provides insight into employee behavior and business performance.

  • Voluntary Turnover: When employees choose to leave on their own, often for better opportunities, career growth, or personal reasons.
  • Involuntary Turnover: When the organization initiates the exit due to performance issues, restructuring, or policy violations.
  • Internal Turnover: When employees move to different roles or departments within the same organization.
  • Functional Turnover: When low-performing employees leave, it can positively impact overall productivity.
  • Dysfunctional Turnover: When high-performing or skilled employees leave, causing a loss of valuable talent.
  • Seasonal Turnover: Common in industries with fluctuating demand, where employees leave after peak periods.
  • Retirement Turnover: When employees exit the workforce after reaching retirement age.

How to Calculate Employee Turnover Rate?

Use this calculation to measure Employee Turnover Rate and judge retention results. The math is direct, but leaders still need timing and context before acting.

Employee Turnover Formula:

Employee Turnover Rate = Employees Who Left / Average Number of Employees x 100

Follow these calculation steps:

  1. Identify employees leaving

Count all separations within the selected period.

  1. Determine the average workforce size

Add the starting and ending headcount, then divide by two.

  1. Apply the turnover formula

Divide departures by average headcount.

  1. Convert into a percentage

Multiply the result by 100.

  1. Compare monthly vs annual turnover

Short-term spikes may differ from yearly trends.

  1. Validate data accuracy

Exclude temporary or irrelevant contract changes.

  1. Interpret business implications

Numbers alone do not explain underlying causes.

Example:

If 12 employees leave and the average headcount is 240:

(12/240) x 100 = 5%

Employee Turnover Rate Examples

These examples show how Employee Turnover Rate shifts by industry, workforce mix, and operating model.

  • Corporate Workforce Turnover

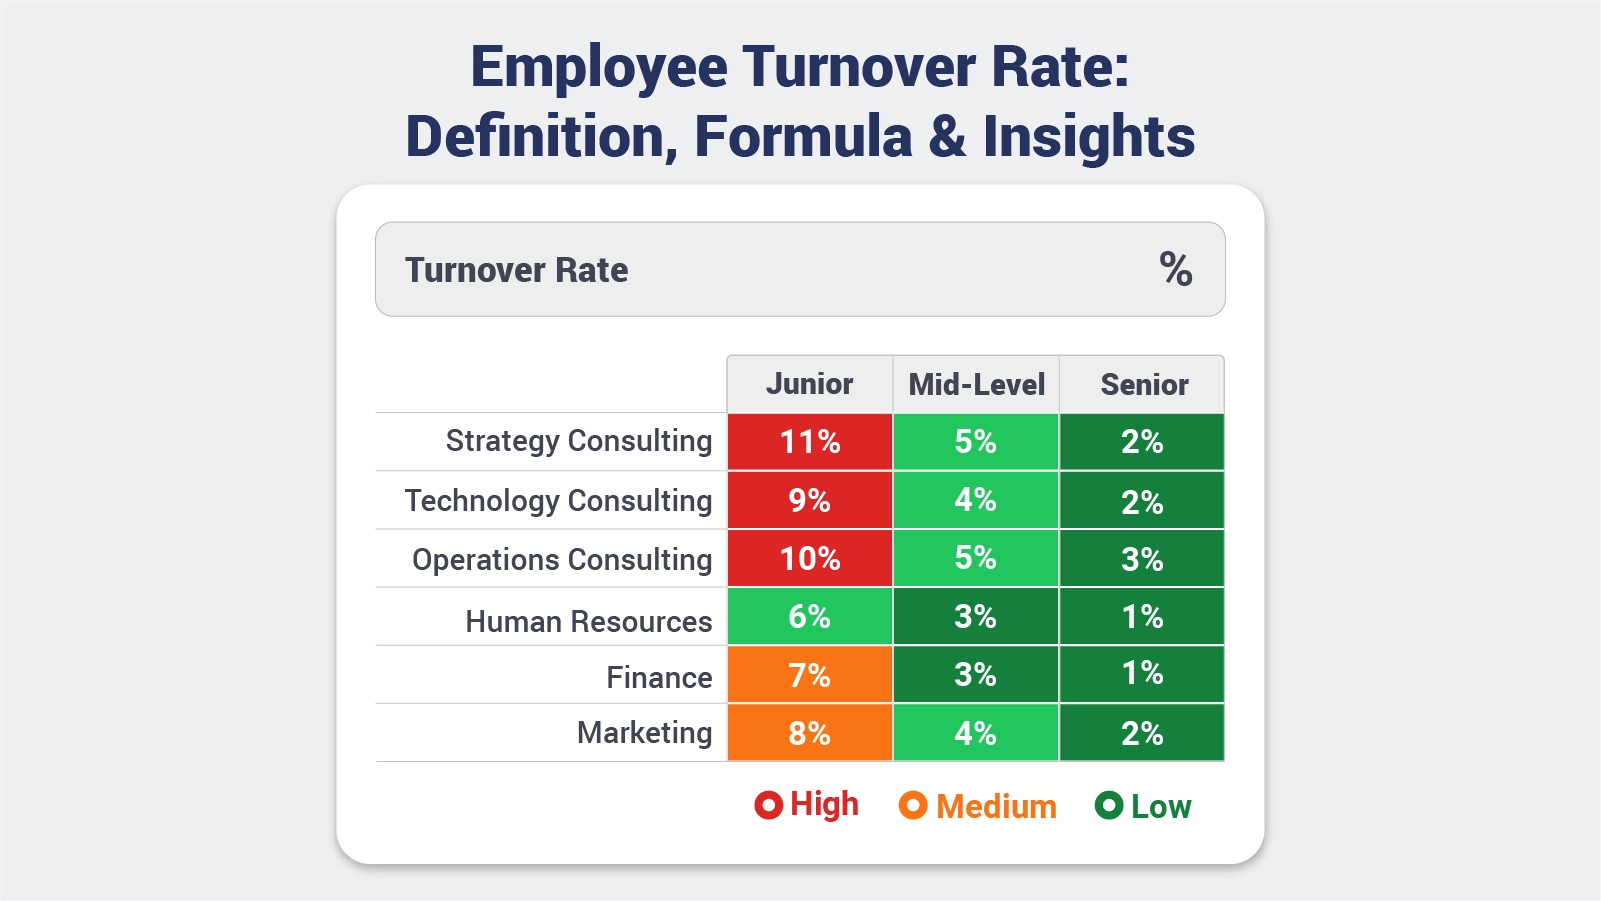
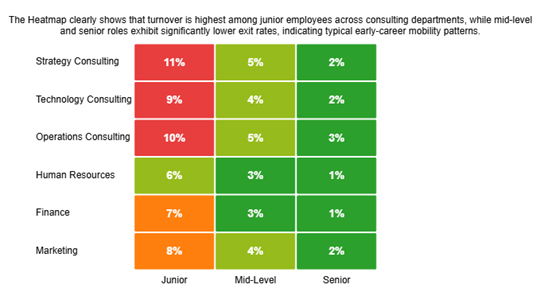
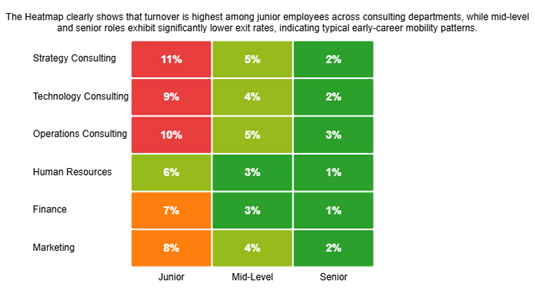
A consulting firm posts a 6% annual Employee Turnover Rate. A department Heatmap shows most exits in junior roles, which suggests early mobility instead of broad dissatisfaction.

Employee Turnover Rate
  • Retail or Service Industry Turnover

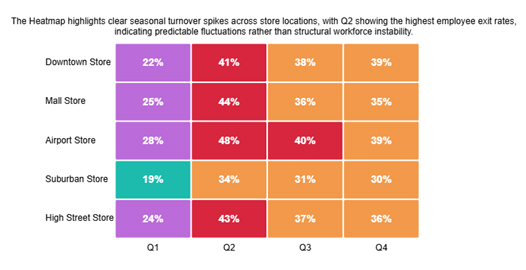
A retail chain reports a 35% annual Employee Turnover Rate. Store comparisons show seasonal peaks, pointing to expected cycles instead of a deeper structural problem.

Employee Turnover Rate
  • Technology or SaaS Workforce Turnover

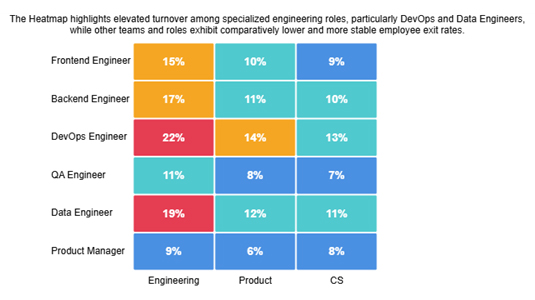
A growing SaaS company records a 14% annual Employee Turnover Rate. Role views show more exits among specialized engineers, which pushes leaders to review pay, workload, and support.

Employee Turnover Rate

How to Analyze Employee Turnover Rate in Excel?

Analyzing employee turnover rate in Excel helps HR teams understand workforce trends and make data-driven decisions. Follow these simple steps to calculate and visualize turnover effectively:

  • Gather Employee Data

Collect relevant data such as employee join and exit dates, departments, and roles.

  • Organize in Excel

Input the data into a clean table with columns for Employee Name, Join Date, Exit Date, and Department.

  • Calculate Turnover Rate

Use the formula: Turnover Rate (%)=Average Number of EmployeesNumber of Departures​×100

  • Analyze by Department or Time Period

Apply filters or PivotTables to identify trends in specific teams or months.

  • Visualize Results

Create charts or graphs in Excel to make patterns and insights easy to interpret.

  • Final Employee Turnover Result

Employee Turnover Rate

Reasons Behind the High Employee Turnover Rate

High employee turnover can significantly impact an organization’s productivity, morale, and bottom line. Understanding the root causes is essential for retaining top talent and improving workplace stability.

Here are the main reasons behind a high employee turnover rate:

  • Poor workplace culture: A toxic or unsupportive environment makes employees feel undervalued, prompting them to leave.
  • Lack of career growth opportunities: Employees who see no path for advancement often seek roles elsewhere.
  • Compensation dissatisfaction: Inadequate pay or benefits can push employees to pursue better-paying options.
  • Work-life balance issues: Overwork, rigid schedules, or burnout drive staff to look for more flexible roles.
  • Ineffective management: Poor leadership, unclear expectations, or a lack of support reduces job satisfaction.
  • Employee engagement challenges: Low motivation, lack of recognition, or uninspiring work leads to disengagement and exits.

Ways to Reduce the Employee Turnover Rate

Reducing employee turnover is essential for maintaining a productive and stable workforce. High turnover not only increases hiring costs but can also disrupt team dynamics and affect overall business performance. By implementing strategic measures, companies can retain top talent and foster long-term growth.

Here are seven effective ways to reduce employee turnover rate:

  • Improve employee engagement programs: Keep employees motivated and connected to company goals.
  • Offer competitive compensation packages: Ensure salaries and benefits are in line with industry standards.
  • Provide career development opportunities: Offer training, mentorship, and growth paths to retain talent.
  • Strengthen leadership and management practices: Effective leaders inspire loyalty and reduce attrition.
  • Enhance workplace culture: Foster a positive, inclusive, and collaborative environment.
  • Conduct employee feedback surveys: Listen to employee concerns and act on them promptly.
  • Recognize and reward performance: Appreciation and acknowledgment boost satisfaction and retention.

Benefits of Calculating Staff Turnover Rate

Tracking Employee Turnover Rate gives leaders more than a simple exit total. It supports better choices across staffing, cost control, retention planning, and day-to-day workforce management.

  • Retention planning improves: Exit patterns and risk signals help teams target support where it matters most.
  • Workforce planning improves: Leaders can forecast hiring demand, skill gaps, and resource needs ahead.
  • Performance gaps surface: Unstable roles or teams become easier to spot and fix early.
  • Satisfaction signals sharpen: Turnover trends can reflect morale, engagement, and daily workplace experience.
  • Replacement costs fall: Fewer exits reduce spending on recruiting, training, onboarding, and ramp-up work.
  • Reporting improves: Teams can track results more clearly when they know how to create a report in Excel for turnover reviews.

Best Practices for Staff Turnover Rate

Consistent methods help teams calculate employee turnover rate correctly and read changes with confidence. The metric matters most when results stay comparable across periods.

  • Track turnover often: Regular review helps teams catch trends, outliers, and rising retention risk.
  • Break results down: Department and role views reveal specific problems that a single average can hide.
  • Pair data with feedback: Exit comments and numbers together explain why people leave more clearly.
  • Use benchmarks carefully: Context matters, much like comparing the accounts receivable turnover ratio across similar firms.
  • Use visuals wisely: Clear charts make pattern recognition faster and support better decisions.
  • Watch long trends: History supports better planning and stronger retention work over time.

FAQs

What is a good employee turnover ratio?

There is no single ideal ratio. A suitable level depends on industry, role mix, and labor conditions, and knowledge-based teams usually aim lower.

What is the formula for employee turnover rate in spreadsheets?

Divide departures by average headcount, then multiply by 100 to get the percentage.

What industries have the highest turnover rates?

Retail, hospitality, and service sectors often report higher turnover, while specialized and technology teams usually see lower rates with sharper impact.

Wrap Up

Employee Turnover Rate becomes useful when leaders treat it as an operating signal, not a backward report. It shows where exits collect, when risk grows, and which teams need support before turnover disrupts hiring plans, budgets, service levels, manager focus, project continuity, and customer coverage.

Once the metric is measured the same way each time, teams can compare periods, explain shifts, and respond with better pay, clearer management, stronger culture, or tighter planning across the business. The goal is not to force a single number. The goal is to understand movement, assign owners, and act with evidence instead of assumptions.

How much did you enjoy this article?

ExcelAd1
Start Free Trial!
160358

Related articles

next previous
Data Analytics11 min read

Primary vs Secondary Research: Which Method Is Better?

Primary vs secondary research shapes data quality and analytical outcomes. Learn the key differences and when to use each method. Discover now!

Data Analytics12 min read

Staff Onboarding Template: Insights for HR Decisions

Staff onboarding template: discover how to build, track, and analyze a process that gets new hires productive from day one. Read on!

Data Analytics10 min read

What are DORA Metrics: A Complete Guide

What are DORA Metrics? Discover the four KPIs every engineering team needs to track delivery speed, stability, and reliability. Read on!

Data Analytics12 min read

Analytics in Insurance Industry: From Data to Clear Insights

Analytics in insurance industry turns claims, policy, and service data into decisions for pricing, fraud checks, and retention. Read on!

Data Analytics9 min read

Cost Per Hire: Analyzing Hiring Costs Easily

Cost Per Hire shows what each hire costs and where the money goes. Use the formula, examples, and Excel steps to track spend. Read on!

ChartExpo logo

Turn Data into Visual
Stories

CHARTEXPO

  • Home
  • Gallery
  • Videos
  • Services
  • Pricing
  • Contact us
  • FAQs
  • Privacy policy
  • Terms of Service
  • Sitemap

TOOLS

  • ChartExpo for Google Sheets
  • ChartExpo for Microsoft Excel
  • Power BI Custom Visuals by ChartExpo
  • Word Cloud

CATEGORIES

  • Bar Charts
  • Circle Graphs
  • Column Charts
  • Combo Charts
  • Comparison Charts
  • Line Graphs
  • PPC Charts
  • Sentiment Analysis Charts
  • Survey Charts

TOP CHARTS

  • Sankey Diagram
  • Likert Scale Chart
  • Comparison Bar Chart
  • Pareto Chart
  • Funnel Chart
  • Gauge Chart
  • Radar Chart
  • Radial Bar Chart
  • Sunburst Chart
  • see more
  • Scatter Plot Chart
  • CSAT Survey Bar Chart
  • CSAT Survey Chart
  • Dot Plot Chart
  • Double Bar Graph
  • Matrix Chart
  • Multi Axis Line Chart
  • Overlapping Bar Chart
  • Control Chart
  • Slope Chart
  • Clustered Bar Chart
  • Clustered Column Chart
  • Box and Whisker Plot
  • Tornado Chart
  • Waterfall Chart
  • Word Cloud
  • see less

RESOURCES

  • Blog
  • Resources
  • YouTube
SIGN UP FOR UPDATES

We wouldn't dream of spamming you or selling your info.

© 2026 ChartExpo, all rights reserved.