• Home
  • Tools dropdown img
    • Spreadsheet Charts

      • ChartExpo for Google Sheets
      • ChartExpo for Microsoft Excel
    • Power BI Charts

      • Power BI Custom Visuals by ChartExpo
    • Word Cloud

  • Charts dropdown img
    • Chart Category

      • Bar Charts
      • Circle Graphs
      • Column Charts
      • Combo Charts
      • Comparison Charts
      • Line Graphs
      • PPC Charts
      • Sentiment Analysis Charts
      • Survey Charts
    • Chart Type

      • Box and Whisker Plot
      • Clustered Bar Chart
      • Clustered Column Chart
      • Comparison Bar Chart
      • Control Chart
      • CSAT Survey Bar Chart
      • CSAT Survey Chart
      • Dot Plot Chart
      • Double Bar Graph
      • Funnel Chart
      • Gauge Chart
      • Likert Scale Chart
      • Matrix Chart
      • Multi Axis Line Chart
      • Overlapping Bar Chart
      • Pareto Chart
      • Radar Chart
      • Radial Bar Chart
      • Sankey Diagram
      • Scatter Plot Chart
      • Slope Chart
      • Sunburst Chart
      • Tornado Chart
      • Waterfall Chart
      • Word Cloud
    • Google Sheets
      Microsoft Excel
  • Services
  • Pricing
  • Contact us
  • Blog
  • Support dropdown img
      • Gallery
      • Videos
      • Contact us
      • FAQs
      • Resources
    • Please feel free to contact us

      atsupport@chartexpo.com

Categories
All Data Visualizations Data Analytics Surveys
Add-ons/
  • Google Sheets
  • Microsoft Excel
  • Power BI
All Data Visualizations Data Analytics Surveys
Add-ons
  • Google Sheets
  • Microsoft Excel
  • Power BI

We use cookies

This website uses cookies to provide better user experience and user's session management.
By continuing visiting this website you consent the use of these cookies.

Ok

ChartExpo Survey


Home > Blog > Microsoft Excel

Ledger Template in Excel: Accounting Insights Made Simple

Financial records scattered across folders and notebooks drain time and invite errors. A ledger template in Excel changes that by giving every transaction a fixed home, every balance an automatic calculation, and every account a consistent structure.

Ledger Template in Excel

Whether the goal is personal budgeting or full business bookkeeping, this approach removes guesswork from recordkeeping.

Unlike dedicated accounting platforms, an Excel ledger demands no subscription, no steep learning curve, and no rigid configuration.

Users shape it to fit their needs, choosing the columns, formulas, and categories that matter most. This post covers what a ledger template is, its core components, types, setup steps, and how to draw insights from its data.

Table of Contents:

  1. What is a Ledger Template in Excel?
  2. Why is the Ledger Template in Excel Important?
  3. Key Components of a Ledger Template in Excel
  4. Types of Ledger Template in Excel
  5. Ledger Template in Excel Examples
  6. How to Create a Ledger Template in Excel?
  7. How to Analyze a Ledger Template in Excel?
  8. Benefits of a Ledger Template in Excel
  9. Best Practices for Maintaining a Ledger Template in Excel
  10. FAQs
  11. Wrap Up

What is a Ledger Template in Excel?

Definition: A ledger template in Excel is a pre-structured spreadsheet that records every financial transaction a business or individual makes, capturing debits, credits, and running balances in one place. It replicates the logic of a traditional accounting ledger while leveraging spreadsheet flexibility.

The template uses predefined columns for dates, reference numbers, account names, and monetary amounts. Embedded formulas handle the arithmetic, so balances refresh with every new entry, and the ledger format in Excel stays current without manual recalculation.

Most critically, an Excel ledger template pulls all financial movement into one searchable record, simplifying reconciliation, audit preparation, and summary reporting.

Why is the Ledger Template in Excel Important?

Without a standardized recording method, financial data becomes unreliable and hard to audit. A ledger format in Excel enforces consistency across every entry, giving businesses and individuals a dependable foundation for decision-making and compliance.

  • Improves financial record accuracy: Formatted entry fields reduce the chance of inconsistent inputs or misclassified transactions.
  • Centralizes debit and credit tracking: All movement across accounts stays in one file, a critical need in Excel for accounting and finance.
  • Tracks account balances automatically: Formula-driven totals recalculate with each new row, keeping figures current without extra effort.
  • Supports reconciliation processes: Well-structured entries make it straightforward to match ledger totals against bank statements.
  • Reduces bookkeeping errors: Automated formulas replace error-prone manual arithmetic, cutting the risk of miscalculation.
  • Enhances transaction transparency: A full chronological log gives auditors and reviewers a clear view of every financial event.
  • Simplifies financial reporting: Clean, categorized data feeds directly into summary statements and period reports.

Key Components of a Ledger Template in Excel

Every reliable ledger template in Excel depends on a core set of fields and formulas. Each element plays a defined role in capturing transactions accurately and maintaining balances with precision.

  • Date column for transaction entry: Establishes a chronological order that makes historical review and period filtering possible.
  • Account name or account code: Ties each transaction to the correct account, supporting precise categorization in Excel bookkeeping for small businesses.
  • Transaction description field: Adds context to each entry, recording the purpose behind the debit or credit.
  • Debit amount column: Logs all increases to asset or expense accounts in line with standard accounting logic.
  • Credit amount column: Records reductions to assets or increases to liabilities and equity, completing the double-entry picture.
  • Running balance formula: Recalculates the account running total after every new entry, keeping the ledger current in real time.
  • Reference or voucher number: Connects each transaction to its source document, enabling faster verification and audit trails.

Types of Ledger Template in Excel

Financial tracking needs vary by user, industry, and reporting goal. Excel supports several distinct ledger configurations, each built around a specific accounting function.

  • General ledger template: Covers all account categories across an organization and feeds data into a monthly financial report template in Excel.
  • Accounts payable ledger template: Logs amounts owed to vendors and suppliers, helping businesses monitor payment obligations and due dates.
  • Accounts receivable ledger template: Tracks outstanding customer invoices and integrates well with an invoice tracker template in Excel.
  • Cash ledger template: Records every cash inflow and outflow, giving a daily view of liquidity and spending patterns.
  • Subsidiary ledger template: Provides granular transaction detail for individual accounts, feeding into the main general ledger.

Ledger Template in Excel Examples

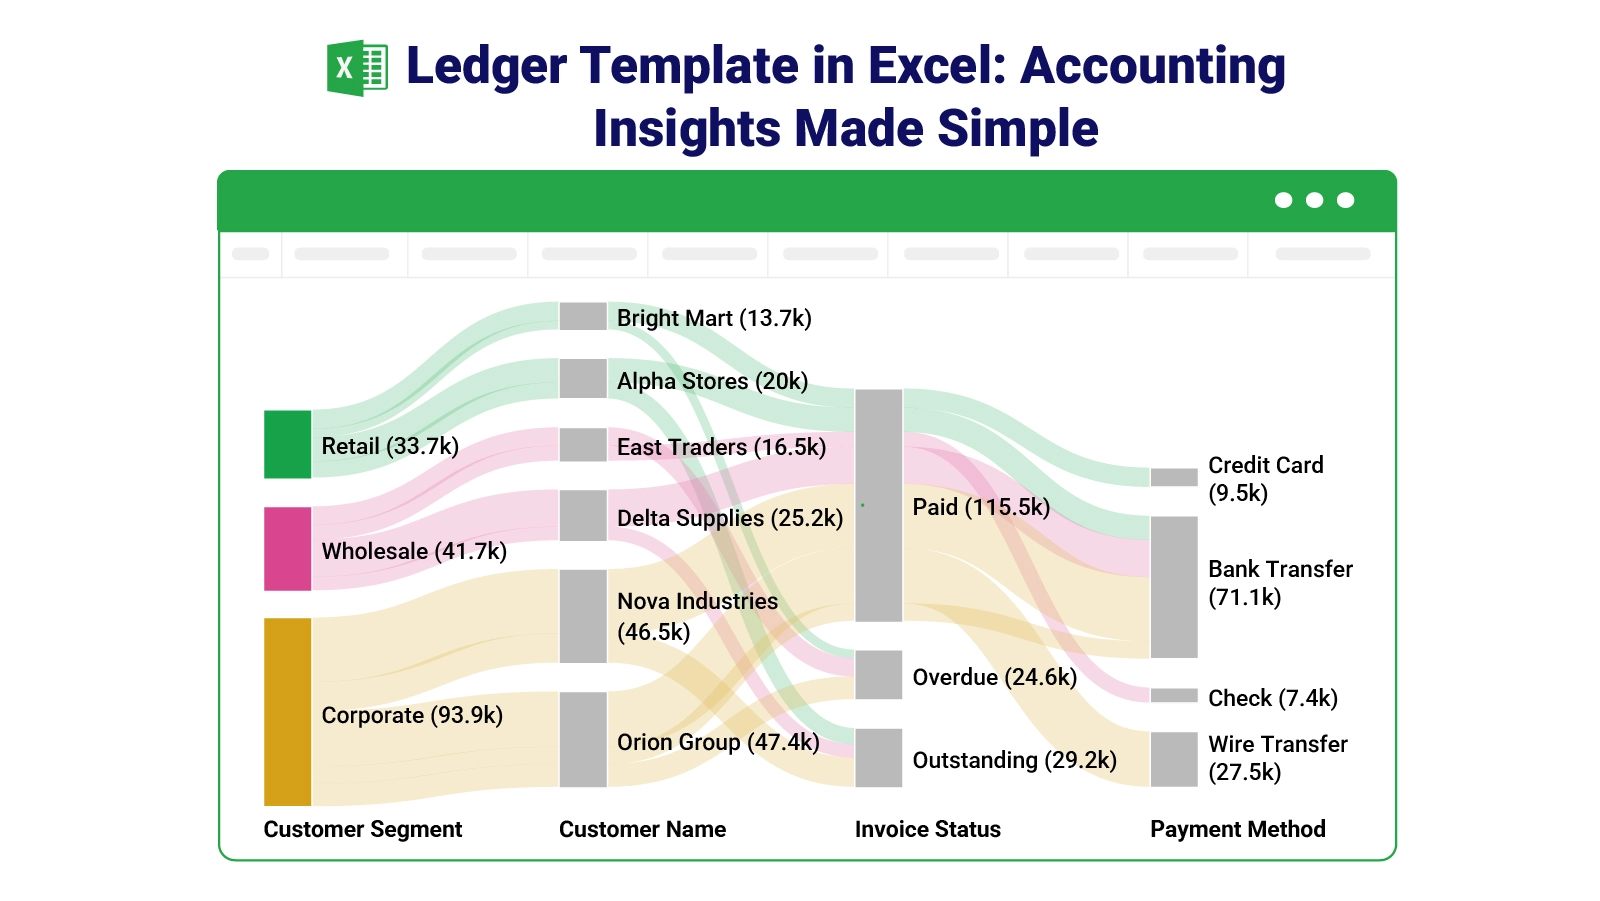
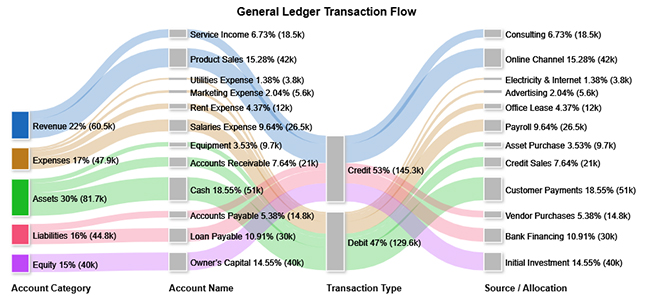
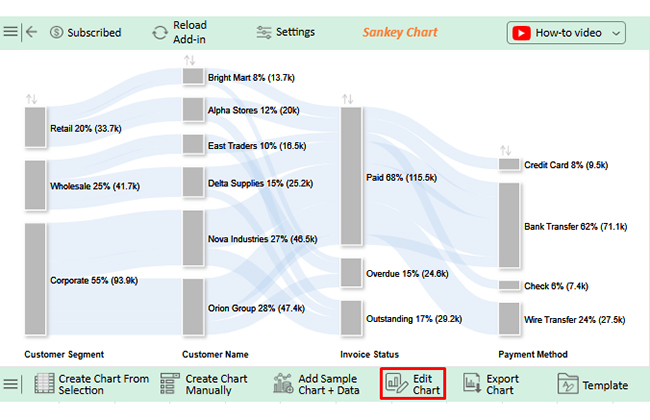
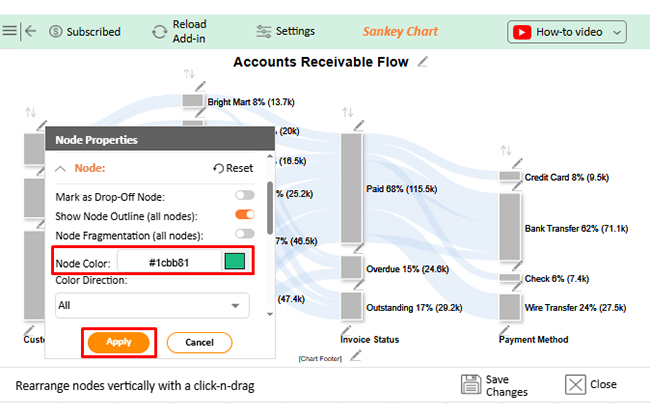
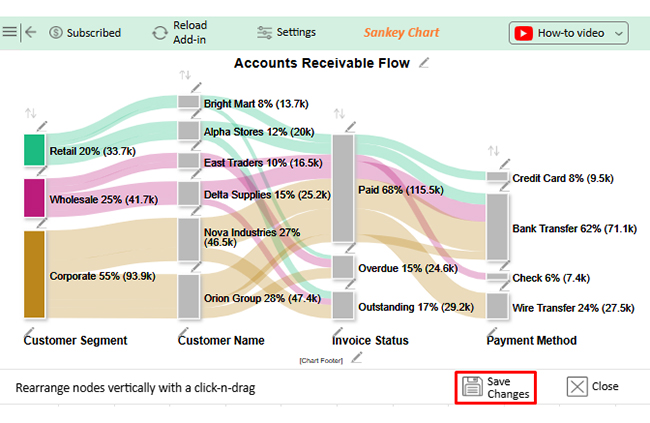
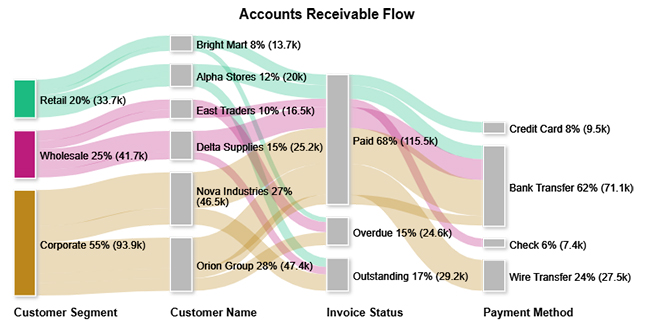
Visualizing how a ledger operates across different account types reinforces the concepts behind the template. The examples below use a Sankey Chart to map transaction flows, with each chart revealing a different dimension of ledger activity.

  • General Ledger

The general ledger flow chart shows how asset accounts hold the largest share of total ledger activity, while credit-side transactions drive the bulk of movement across all account categories.

Ledger Template in Excel
  • Cash Ledger

The cash flow diagram by department shows that the Sales team generates the greatest share of inflows, while Payroll represents the most significant outflow category across the organization.

  • Accounts Receivable Ledger

The accounts receivable chart shows that corporate clients account for the largest portion of outstanding invoices, with most of those balances moving into the paid category upon settlement.

Ledger Template in Excel

 How to Create a Ledger Template in Excel?

Setting up an effective ledger does not require advanced spreadsheet expertise. A straightforward build process, applied in order, produces a template that stays accurate over months of use.

  • Create column headers (Date, Description, Debit, Credit, Balance): A clear header row defines each field, making data entry consistent and classification unambiguous.
  • Format currency cells properly: Applying number formatting to monetary columns prevents rounding errors and produces clean output for a finance dashboard in Excel.
  • Apply the running balance formula: A formula that adds the debit and subtracts the credit from the previous balance keeps account totals current after every row.
  • Add data validation for accounts: Dropdown lists or validation rules on the account column block invalid entries before they corrupt the dataset.
  • Insert filters for sorting: Column filters let users isolate date ranges, accounts, or amounts quickly, which supports clean financial charts in Excel later.
  • Protect formula cells: Locking cells that contain formulas prevents accidental overwrites that would break the balance calculation chain.

How to Analyze a Ledger Template in Excel?

Raw ledger data only becomes useful when examined systematically. Applying a structured review process turns transaction records into insight about cash flow, accuracy, and financial trends.

  1. Review transaction consistency

Scan entries for missing dates, repeated transaction references, or accounts assigned to the wrong category, as these gaps distort totals.

  1. Validate debit and credit logic

Confirm that every debit and credit pair follows standard accounting rules and that the running balance reflects each entry correctly.

  1. Identify unusual fluctuations

Flag entries where amounts deviate sharply from typical patterns, as these may signal data entry mistakes or one-off financial events.

  1. Compare period-to-period activity

Measuring month-over-month change surfaces spending trends and behavioral shifts, similar to what an income and expenditure tracker reveals over time.

  1. Visualize financial flows for clarity

Ledger data structured around debit and credit categories supports balance-tracking strategies like an Excel spreadsheet for debt snowball, where visualizing payment sequences accelerates the payoff plan. Charting tools convert the spreadsheet numbers into graphics that highlight patterns invisible in raw rows.

Why use ChartExpo?

  • Transforms raw ledger figures into visual flow diagrams that reveal concentration, direction, and magnitude at a glance.
  • Surfaces cost concentrations and cash flow imbalances that are difficult to detect in a standard row-and-column view.
  • Accelerates decisions by presenting multi-variable financial data in a single, interactive chart format.
  • Offers a 7-day free trial and costs just $10/month.

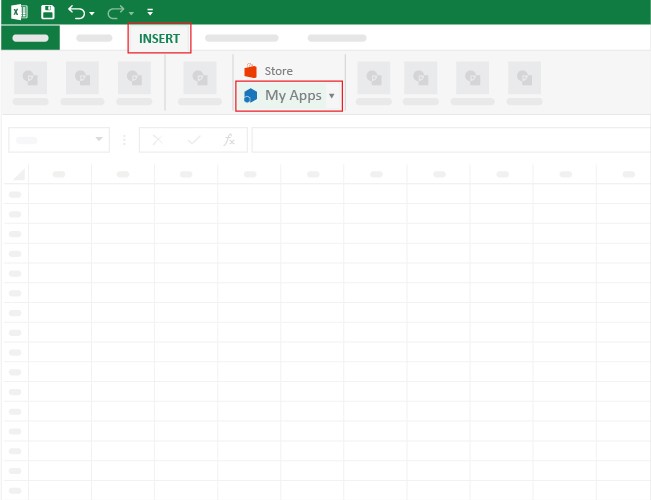
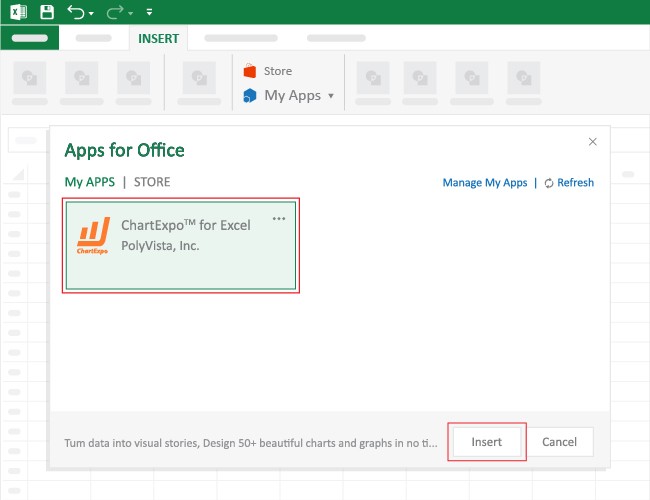
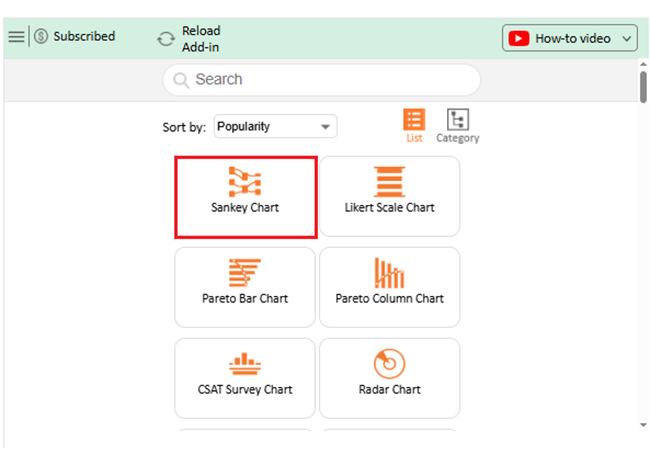
How to install ChartExpo in Excel?

  1. Open your Microsoft Excel.
  2. Start a worksheet and go to the ribbon tab named Insert.
  3. To open the window on Office Add-ins, click on My Apps.
  4. Go to the Add-ins window, and in the “/Store tab,” search ChartExpo.
  5. After finding it, click the Add button to install it.

ChartExpo works with both Google Sheets and Microsoft Excel. Follow the on-screen prompts after installation to start building charts directly inside your preferred platform.

Example:

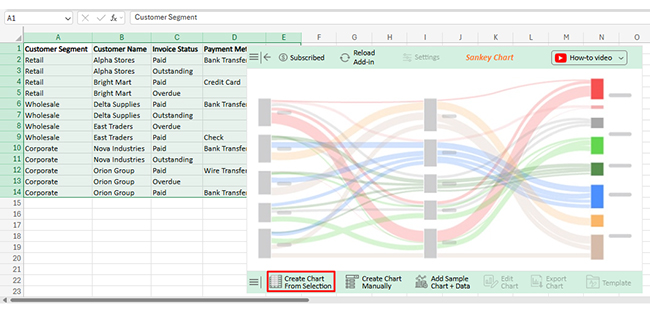
Consider we have the following data for a Sankey Chart.

Customer Segment Customer Name Invoice Status Payment Method Amount
Retail Alpha Stores Paid Bank Transfer 12000
Retail Alpha Stores Outstanding 8000
Retail Bright Mart Paid Credit Card 9500
Retail Bright Mart Overdue 4200
Wholesale Delta Supplies Paid Bank Transfer 18500
Wholesale Delta Supplies Outstanding 6700
Wholesale East Traders Overdue 9100
Wholesale East Traders Paid Check 7400
Corporate Nova Industries Paid Bank Transfer 32000
Corporate Nova Industries Outstanding 14500
Corporate Orion Group Paid Wire Transfer 27500
Corporate Orion Group Overdue 11300
Corporate Orion Group Paid Bank Transfer 8600
  • Once ChartExpo is installed, please click on the “INSERT” menu and then click on the “My Apps” submenu.
Ledger Template in Excel
  • This will open the Apps for Office window. Find ChartExpo in the list and press the Insert button to make it appear in your workbook.
Ledger Template in Excel
  • Once ChartExpo is loaded into your sheet, you can search or select “Sankey Chart” from the list.
Ledger Template in Excel
  • Next, select your data and click the ‘Create Chart from Selection’ button.
Ledger Template in Excel
  • To customize your chart, just click on the “Edit Chart” option to make adjustments effortlessly.
Ledger Template in Excel
  • To change the chart’s title, select the pencil icon on the header. Then, enter the text you want and press Apply.
Ledger Template in Excel
  • Click the pencil icon on the bar, select the node in the Node Properties window, choose a color, and click Apply to save the changes.
Ledger Template in Excel
  • When you are done with all the changes, click the “Save” button to save them.
Ledger Template in Excel
  • The Final look and feel of the Sankey Chart is shown below.
Ledger Template in Excel

Key Insights

  • Corporate clients drive 55% of total receivables, dwarfing the Wholesale segment at 25% and Retail at 20%.
  • Two accounts, Nova Industries at 27% and Orion Group at 28%, together represent more than half of all receivable value, signaling significant customer concentration.
  • Payment completion reaches 68%, leaving the remaining portion split between outstanding and overdue statuses.

Benefits of a Ledger Template in Excel

Beyond recording transactions, an Excel ledger template delivers practical advantages that extend across day-to-day operations. Its adaptability makes it equally useful for solo freelancers and multi-department finance teams.

  • Cost-effective bookkeeping: Replaces expensive accounting software for users whose needs center on transaction recording and balance tracking.
  • Easy customization: Fields, formulas, and categories can all be adjusted to match the specific reporting requirements of any individual or business.
  • Real-time balance tracking: Running balance formulas update totals the moment a new transaction row is added, keeping accounts current.
  • Structured financial records: Consistent column layouts support recurring financial tasks such as payroll templates for Excel and monthly payroll reconciliation.
  • Improved decision-making: Reliable transaction history enables more grounded budgeting, forecasting, and spending decisions.
  • Better compliance support: Detailed, dated records create a paper trail that satisfies documentation requirements for reporting and audits.

Best Practices for Maintaining a Ledger Template in Excel

A ledger is only as reliable as the habits behind it. Consistent maintenance routines prevent the data drift and formula corruption that undermine an otherwise sound template.

  • Record transactions daily: Entering data at the end of each business day prevents backlog buildup and keeps the ledger synchronized with actual activity.
  • Reconcile accounts regularly: Comparing ledger balances to external statements each month catches discrepancies before they compound.
  • Maintain consistent naming: Using identical account labels across all entries prevents fragmented data that breaks filters, totals, and reports.
  • Backup files frequently: Saving a dated copy of the ledger at regular intervals protects against data loss from accidental deletion or file corruption.
  • Lock critical formula cells: Cell protection on formula rows stops accidental overwrites that could silently corrupt balance calculations.
  • Review entries periodically: A brief quarterly review of all posted transactions surfaces categorization errors and catches overlooked omissions.

FAQs

Does Excel have a ledger template?

Yes. Excel includes basic ledger-style templates accessible through the template gallery on startup. Third-party sources also offer more specialized designs, and users can build a fully custom version from a blank workbook.

What’s the best way to organize a ledger template in Excel?

Start with clearly labeled columns for date, description, debit, credit, and balance. Keep account names uniform across all entries, apply data validation to reduce input errors, and protect formula cells to prevent accidental changes.

What is the ledger reconciliation format in Excel?

A reconciliation layout typically shows the opening balance, a list of transactions for the period, any adjusting entries, and the closing balance. Comparing this closing figure to an external source, such as a bank statement, confirms accuracy.

Wrap Up

Transaction records without structure become a liability rather than an asset. A ledger template in Excel transforms raw financial data into an organized, queryable record that supports every stage of financial management, from daily bookkeeping to year-end reporting. Its formula-driven design keeps balances accurate, and its flexible layout adapts as needs evolve.

Pairing ledger data with visualization tools adds another layer of clarity, converting rows of figures into charts that expose patterns, concentrations, and anomalies at a glance. Together, structured recordkeeping and strong analysis habits give individuals and businesses the financial visibility needed to plan, respond, and grow with confidence.

How much did you enjoy this article?

ExcelAd1
Start Free Trial!
160235

Related articles

next previous
Microsoft Excel10 min read

How to Create a Progress Bar in Excel? Easy to Follow Steps

A complete guide on Progress Bar definition, advantages, tools to create it and step by step procedure on how to create a Progress Bar in Excel?

Microsoft Excel11 min read

How to Make a Cash Flow Diagram in Excel?

Learn how to make a Cash Flow Diagram in Excel. It will help you learn to visualize and analyze inflows and outflows of your business cash flow.

Microsoft Excel10 min read

Percentage Change Formula in Excel to Visualize Changes

Percentage change formula in Excel: convert raw data into proportional insights. Learn two methods, avoid key errors, and build reliable reports. Read on!

Microsoft Excel12 min read

How to Make Cool Excel Charts & Graphs?

Explore cool Excel charts and graphs that turn your data into engaging visuals. Perfect for making your reports clear, creative, and impactful.

Microsoft Excel7 min read

How to Create Sankey Diagram in Excel? Easy Steps

Create your own Sankey diagram in Excel with simple steps. This guide shows you how to build, format, and customize a professional flow chart without coding.

ChartExpo logo

Turn Data into Visual
Stories

CHARTEXPO

  • Home
  • Gallery
  • Videos
  • Services
  • Pricing
  • Contact us
  • FAQs
  • Privacy policy
  • Terms of Service
  • Sitemap

TOOLS

  • ChartExpo for Google Sheets
  • ChartExpo for Microsoft Excel
  • Power BI Custom Visuals by ChartExpo
  • Word Cloud

CATEGORIES

  • Bar Charts
  • Circle Graphs
  • Column Charts
  • Combo Charts
  • Comparison Charts
  • Line Graphs
  • PPC Charts
  • Sentiment Analysis Charts
  • Survey Charts

TOP CHARTS

  • Sankey Diagram
  • Likert Scale Chart
  • Comparison Bar Chart
  • Pareto Chart
  • Funnel Chart
  • Gauge Chart
  • Radar Chart
  • Radial Bar Chart
  • Sunburst Chart
  • see more
  • Scatter Plot Chart
  • CSAT Survey Bar Chart
  • CSAT Survey Chart
  • Dot Plot Chart
  • Double Bar Graph
  • Matrix Chart
  • Multi Axis Line Chart
  • Overlapping Bar Chart
  • Control Chart
  • Slope Chart
  • Clustered Bar Chart
  • Clustered Column Chart
  • Box and Whisker Plot
  • Tornado Chart
  • Waterfall Chart
  • Word Cloud
  • see less

RESOURCES

  • Blog
  • Resources
  • YouTube
SIGN UP FOR UPDATES

We wouldn't dream of spamming you or selling your info.

© 2026 ChartExpo, all rights reserved.