• Home
  • Tools dropdown img
    • Spreadsheet Charts

      • ChartExpo for Google Sheets
      • ChartExpo for Microsoft Excel
    • Power BI Charts

      • Power BI Custom Visuals by ChartExpo
    • Word Cloud

  • Charts dropdown img
    • Chart Category

      • Bar Charts
      • Circle Graphs
      • Column Charts
      • Combo Charts
      • Comparison Charts
      • Line Graphs
      • PPC Charts
      • Sentiment Analysis Charts
      • Survey Charts
    • Chart Type

      • Box and Whisker Plot
      • Clustered Bar Chart
      • Clustered Column Chart
      • Comparison Bar Chart
      • Control Chart
      • CSAT Survey Bar Chart
      • CSAT Survey Chart
      • Dot Plot Chart
      • Double Bar Graph
      • Funnel Chart
      • Gauge Chart
      • Likert Scale Chart
      • Matrix Chart
      • Multi Axis Line Chart
      • Overlapping Bar Chart
      • Pareto Chart
      • Radar Chart
      • Radial Bar Chart
      • Sankey Diagram
      • Scatter Plot Chart
      • Slope Chart
      • Sunburst Chart
      • Tornado Chart
      • Waterfall Chart
      • Word Cloud
    • Google Sheets
      Microsoft Excel
  • Services
  • Pricing
  • Contact us
  • Blog
  • Support dropdown img
      • Gallery
      • Videos
      • Contact us
      • FAQs
      • Resources
    • Please feel free to contact us

      atsupport@chartexpo.com

Categories
All Data Visualizations Data Analytics Surveys
Add-ons/
  • Google Sheets
  • Microsoft Excel
  • Power BI
All Data Visualizations Data Analytics Surveys
Add-ons
  • Google Sheets
  • Microsoft Excel
  • Power BI

We use cookies

This website uses cookies to provide better user experience and user's session management.
By continuing visiting this website you consent the use of these cookies.

Ok

ChartExpo Survey


Home > Blog > Data Analytics

Need Analysis Template: A Complete Guide

Every organization faces a moment when effort and outcome stop matching. Resources get committed, initiatives get launched, and yet persistent gaps remain.

Need Analysis Template

A need analysis template brings discipline to that disconnect. It converts informal observations into structured data, giving decision-makers a clear view of where they stand, where they want to go, and what separates the two.

In data-driven environments, that clarity is not optional. A training needs analysis template helps teams move past guesswork, build evaluations around measurable criteria, and direct resources toward interventions that actually close performance gaps. The result is planning grounded in evidence rather than assumption.

Table of Contents:

  1. What is a Need Analysis Template?
  2. Why is a Need Analysis Template Important?
  3. Key Components of an Effective Needs Assessment Template
  4. Different Types of Need Analysis Templates
  5. Need Analysis Template Examples
  6. How to Conduct a Training Need Analysis?
  7. How to Analyze a Need Analysis Template in Google Sheets?
  8. Benefits of Using a Structured Need Analysis Template
  9. Best Practices for Applying a Training Needs Analysis Template
  10. FAQs
  11. Wrap Up

What is a Need Analysis Template?

Definition: A need analysis template is a systematic tool for comparing where performance currently stands against where it needs to be. Decision-makers use it to move from loosely interpreted problems to structured, evidence-based evaluations.

Organizing observations, priorities, and metrics into one coherent model prevents fragmented conclusions and supports more targeted action.

Applied across training, operations, and business planning, a needs assessment template typically documents current conditions, desired outcomes, performance indicators, and next steps.

This structured approach keeps evaluations consistent and helps teams arrive at conclusions that are reproducible, not coincidental.

Why is a Need Analysis Template Important?

Without a consistent framework, evaluations drift toward whatever a team already believes. A need analysis template removes that bias by imposing repeatable logic on every assessment.

It gives stakeholders a shared language for describing problems and a standardized method for comparing potential responses. Key reasons this matters:

  • Identifies performance gaps: Measures the distance between current results and required outcomes, often with the support of a needs assessment survey.
  • Aligns goals with resources: Keeps priorities grounded in what is actually achievable given available capacity and constraints.
  • Supports data-driven decisions: Builds conclusions from quantifiable inputs rather than intuition or assumptions.
  • Improves training effectiveness: Focuses learning investments on validated gaps instead of general topics with uncertain impact.
  • Reduces wasted effort: Channels time and budget toward the highest-leverage improvements rather than low-impact activities.
  • Clarifies priorities: Gives teams a defensible, structured basis for deciding which needs to be addressed first.
  • Enhances stakeholder alignment: Builds a common view of current problems and intended outcomes across all parties involved.

Key Components of an Effective Needs Assessment Template

A need analysis template works best when it guides thinking rather than complicating it. Effective templates balance simplicity with depth, giving evaluators enough structure to stay consistent without so much rigidity that they miss context-specific nuances. The core components include:

  • Objectives definition: Establishes the precise scope of what the analysis is intended to evaluate or improve before any data is collected.
  • Current state assessment: Captures an accurate baseline by documenting existing performance levels, capabilities, and conditions.
  • Desired state benchmarks: Sets concrete, measurable targets that define what success looks like at the end of the evaluation.
  • Gap identification: Compares current conditions against desired benchmarks to surface the discrepancies that require attention.
  • Data collection criteria: Specifies what information is needed, how it will be gathered, and how it feeds into data analysis in Google Sheets or other platforms.
  • Priority scoring: Ranks identified needs by urgency, impact, and strategic relevance so teams focus resources where they matter most.
  • Action recommendations: Converts analytical findings into specific, implementable next steps that close the identified gaps.

Different Types of Need Analysis Templates

No two evaluation contexts are identical, and a well-designed template reflects that reality. Each variation below targets a distinct set of decision variables and addresses specific analytical objectives within its domain.

  • Training need analysis template: Pinpoints skill and competency gaps within a workforce, then informs the design of targeted learning interventions.
  • Business need analysis template: Examines operational inefficiencies, strategic opportunities, and performance improvement priorities, often alongside market analysis templates.
  • Employee skill gap template: Compares what employees currently know and can do against the requirements of their roles to surface targeted development needs.
  • Project need analysis template: Evaluates resource availability, timeline feasibility, and execution readiness before a project begins, frequently structured with Google Spreadsheet templates.
  • Customer need analysis template: Surfaces customer pain points, unmet expectations, and experience improvement opportunities using structured input collection.
  • Organizational need analysis template: Assesses enterprise-level priorities, structural constraints, and the degree to which current capabilities align with strategic goals.

Need Analysis Template Examples

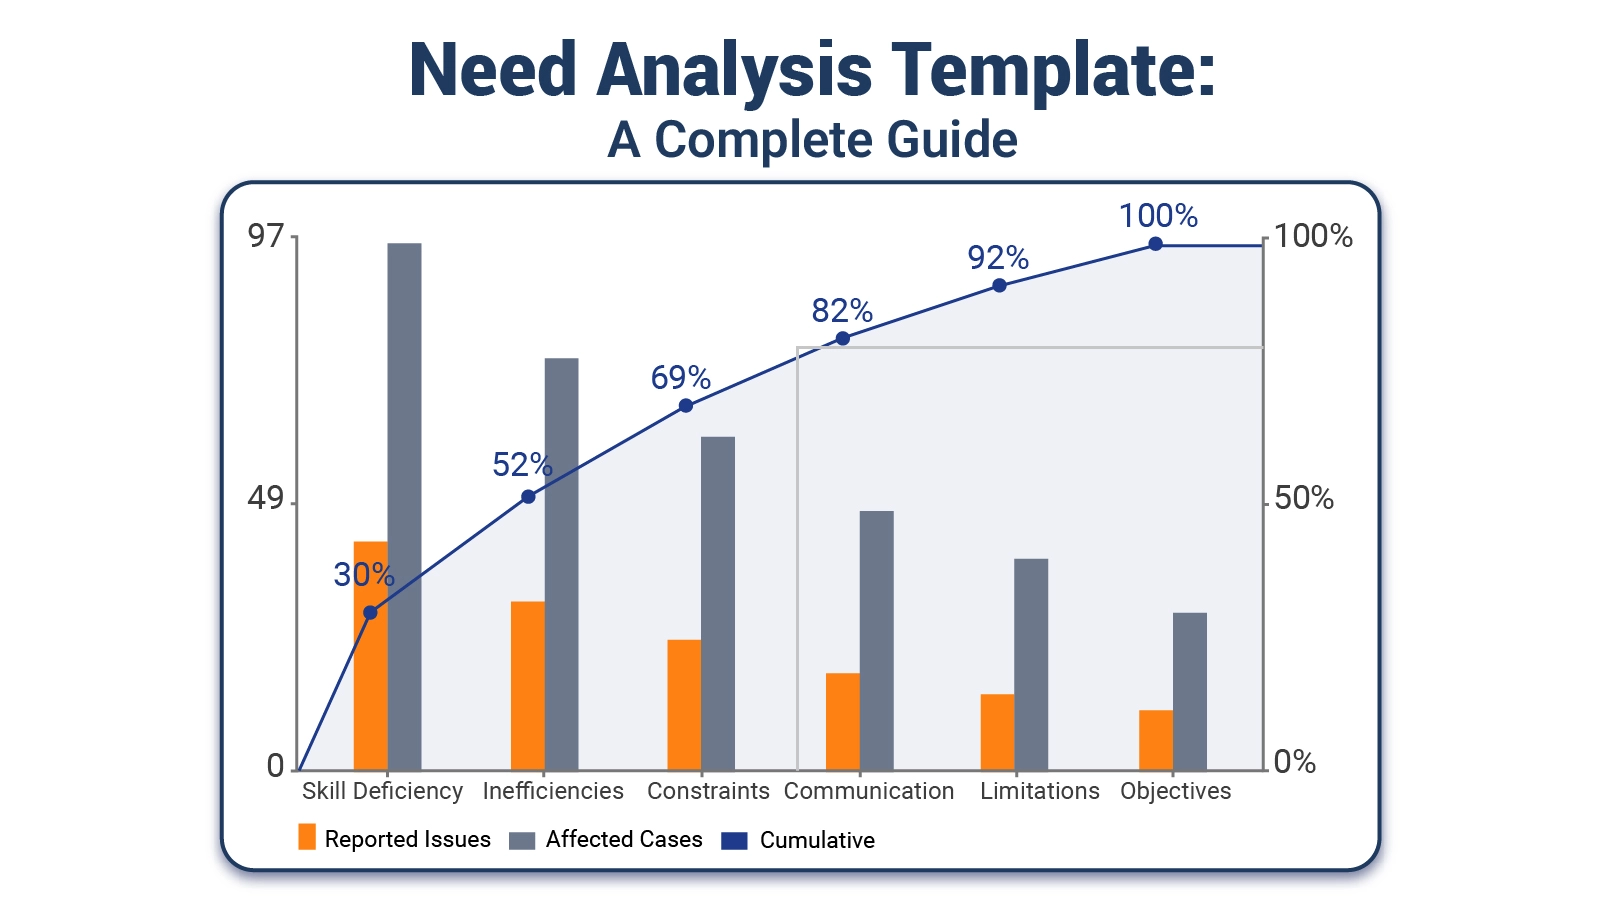
Concrete examples show how structured gap evaluation transforms observation into insight. The five scenarios below each highlight a different dimension of need analysis, from root cause concentration to departmental execution tracking.

  • Root Cause Distribution of Identified Needs

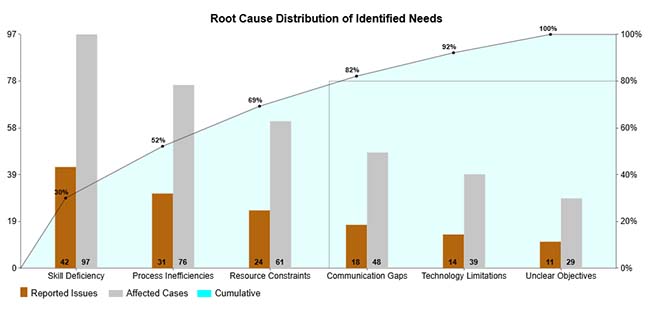
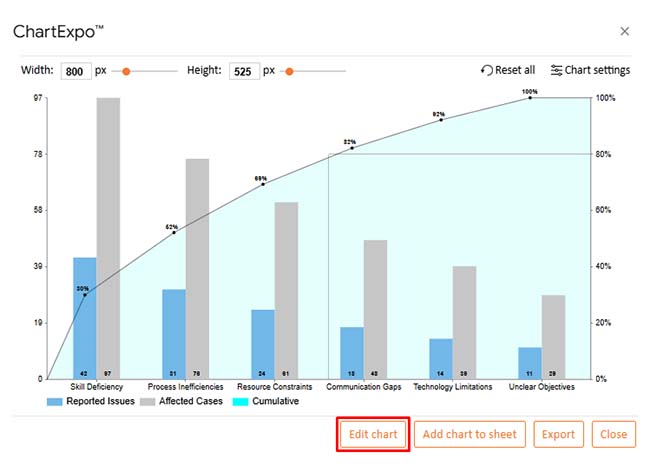
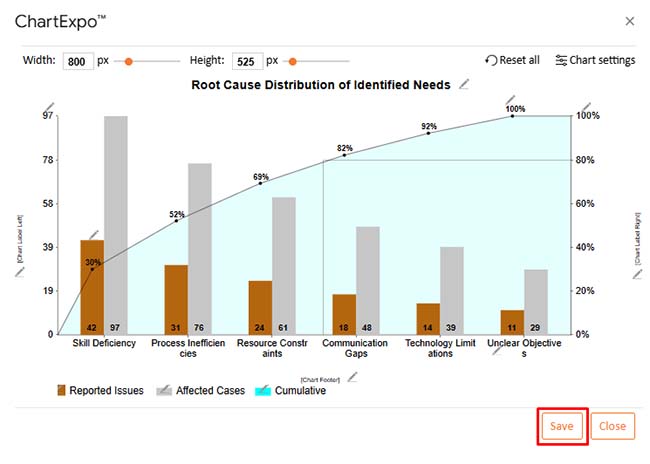
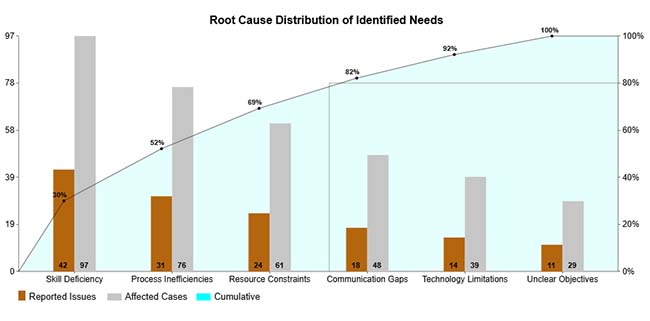
This chart concentrates roughly two-thirds of all reported issues and affected cases within just two categories: skill deficiency and process inefficiencies. The Pareto pattern is unmistakable, pointing directly toward where intervention will produce the greatest reduction in need.

Need Analysis Template
  • Flow of Training Evaluation to Business Impact

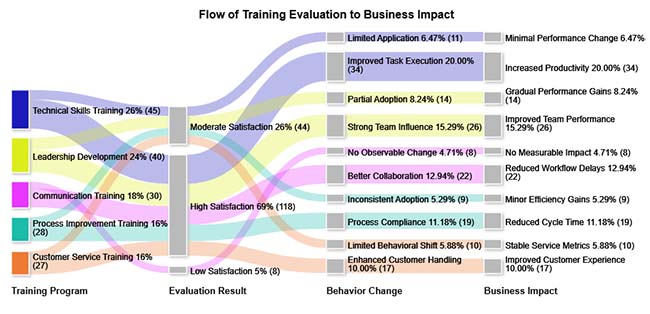
Satisfaction scores at the end of a training program rarely predict whether participants change their behavior or whether the organization sees measurable improvement. This example traces the full chain from evaluation to impact, revealing where that chain typically breaks.

Need Analysis Template
  • Target vs Achieved Service Levels Across Operational Areas

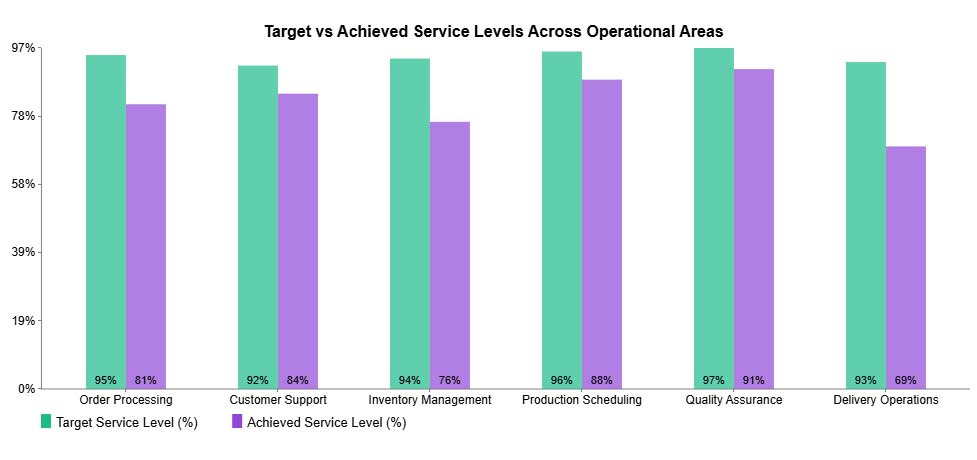
Comparing targets against actual performance across operational areas makes shortfalls visible in precise terms. Delivery Operations and Inventory Management show the widest gaps in this example, flagging them as the highest-priority areas for corrective focus.

Need Analysis Template
  • Monthly Need, Gap, and Resolution Trends

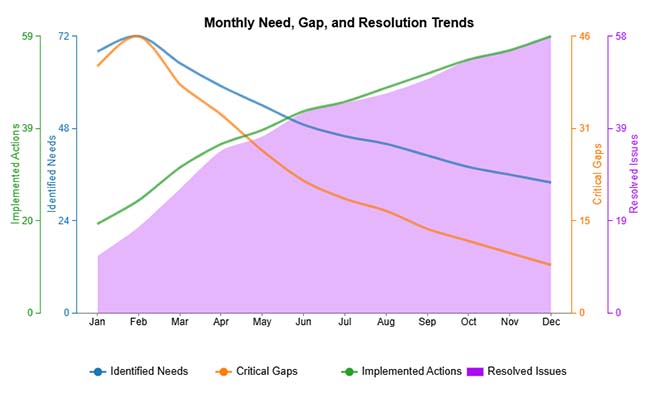
Tracking needs, gaps, and resolutions over consecutive months produces a performance trajectory. When implemented actions rise, identified needs and critical gaps contract while resolved issues climb, confirming that structured intervention is producing measurable progress.

Need Analysis Template
  • Identified vs Completed Improvements by Department

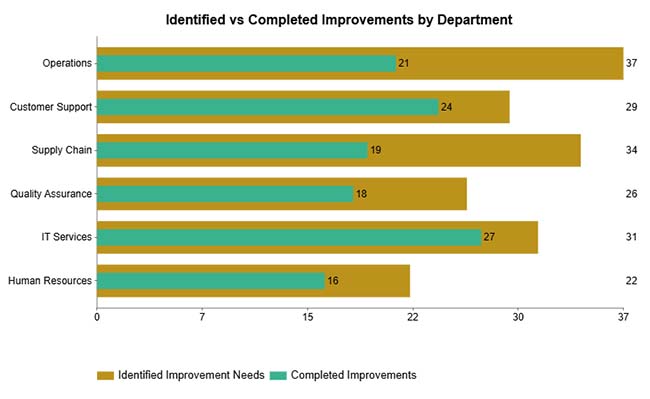
Plotting identified improvements against completed ones by department exposes execution backlogs with precision. Operations and Supply Chain carry the heaviest unresolved load in this example, signaling where accountability and capacity attention are most urgently required.

Need Analysis Template

How to Conduct a Training Need Analysis?

A need analysis template, when used within a training context, keeps every step tied to a specific learning objective rather than general improvement ambitions. The following process channels evaluation energy toward outcomes that are both measurable and actionable.

  • Define training objectives: Establish exactly which competencies, behaviors, or knowledge areas the training must address and how success will be measured.
  • Identify target audience: Determine which roles or individuals require training and articulate why the gap exists for that specific group.
  • Assess current skill levels: Gather reliable data on existing capabilities through observation, testing, or structured input to establish a valid baseline.
  • Identify skill gaps: Compare the baseline against required performance standards to isolate the specific deficiencies that training must close.
  • Prioritize training needs: Rank the identified gaps by their impact on performance, urgency, and alignment with organizational goals.
  • Document findings: Record conclusions, recommended interventions, and follow-up responsibilities, maintaining accountability through an issue tracker template when appropriate.

How to Analyze a Need Analysis Template in Google Sheets?

Spreadsheet tools give structured evaluation frameworks a dynamic workspace where raw inputs become comparable, scorable, and reportable. Moving evaluation work into Google Sheets adds consistency to scoring and opens the door to analysis techniques that static documents cannot support.

  1. Organize evaluation variables: Structure objectives, performance metrics, and scoring criteria into clearly labeled columns so the logic of the evaluation stays transparent and auditable.
  2. Standardize rating scales: Define uniform scoring criteria before any data is entered, ensuring that different evaluators apply the same standard to each variable.
  3. Test alternative assumptions: Apply what-if analysis in Google Sheets to see how score changes or shifted weightings alter the overall priority rankings and action recommendations.
  4. Visualize patterns and gaps: Convert tabular data into charts that surface trends, outliers, and relationship patterns that would otherwise stay buried in rows and columns.
  5. Validate analytical logic: Audit scoring models and input data for inconsistencies, misapplied weights, or anomalies that could distort the conclusions of the evaluation.
  6. Incorporate predictive insights: Use forecasting in Google Sheets to model how identified needs and resource constraints are likely to evolve over future planning periods.

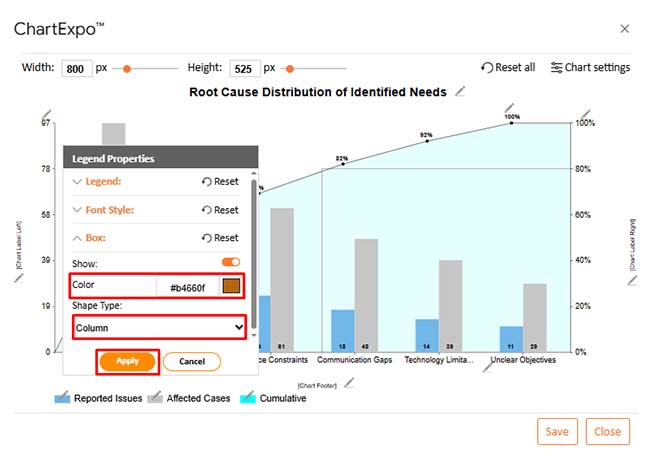
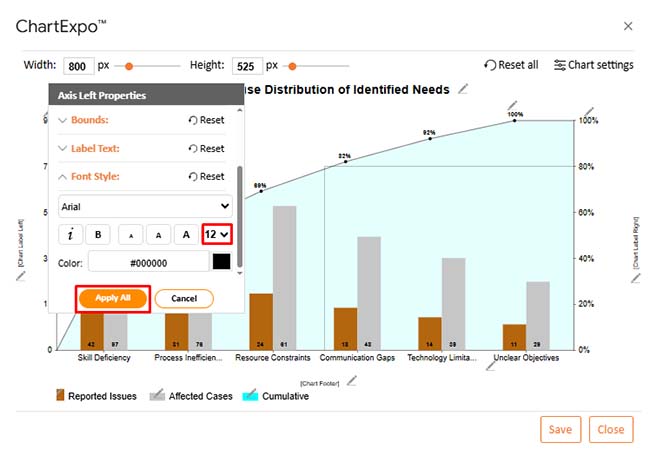
Charting tools extend this process further by converting structured datasets into visuals that are immediately readable by any stakeholder. ChartExpo integrates directly with Google Sheets to handle that conversion without requiring custom code or manual formatting work.

Why use ChartExpo?

  • Converts layered spreadsheet data into decision-ready charts without manual formatting.
  • Surfaces trends, concentrations, and anomalies that rows of numbers conceal from plain sight.
  • Cuts the time from data to finished visual, reducing errors from manual chart construction.
  • Available with a 7-day free trial; ongoing access is $10 per month.

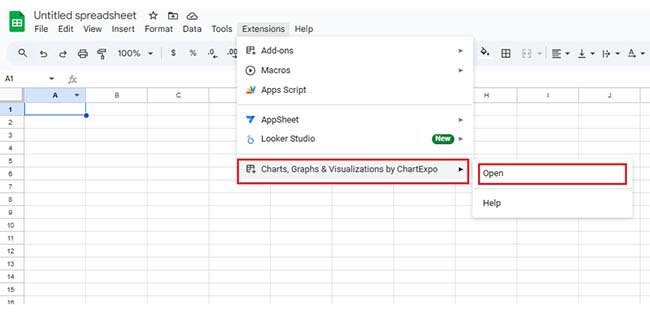
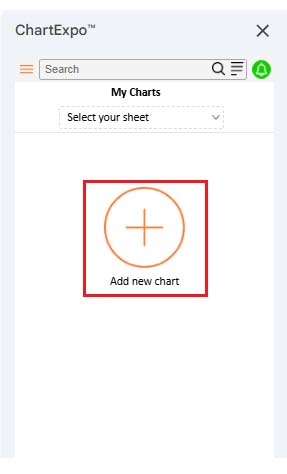
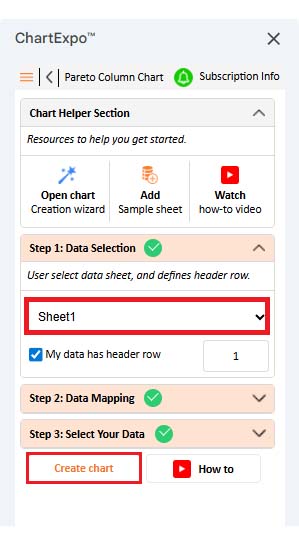
How to install ChartExpo in Google Sheets?

  • Go to Google Sheets and open the file you are interested in. Then click on the Extensions tab in the upper menu.
  • Click on the Add-ons and enter “Get add-ons.”
  • Go to the Google Workspace Marketplace and search for ChartExpo.
  • Explore “Charts, Graphs & Visualizations by ChartExpo, and click the “Install” button.
  • Allow the necessary access and confirm your Google account when asked.

Example:

Consider we have the following data for a Pareto Column Chart.

Root Cause Category

Reported Issues

Affected Cases

Skill Deficiency 42 97
Process Inefficiencies 31 76
Resource Constraints 24 61
Communication Gaps 18 48
Technology Limitations 14 39
Unclear Objectives 11 29
  • To get started with ChartExpo, install ChartExpo in Google Sheets.
  • Go to Extensions > Charts, Graphs & Visualizations by ChartExpo > Open.
Need Analysis Template
  • Once ChartExpo is installed in Google Sheets, click on the “Add new chart” button.
Need Analysis Template
  • Once it loads, scroll through the charts list to locate and choose the “Pareto Column Chart”.
Need Analysis Template
  • Then, select your worksheet and confirm the data range; your data is automatically mapped, click on the Create button.
Need Analysis Template
  • If you want to customize your chart, select the “Edit Chart” option and design it to your specifications.
Need Analysis Template
  • To change the chart’s title, select the pencil icon on the header. Then, enter the text you want and select “Apply”.
Need Analysis Template
  • You can change legend shape type and color from “Legend Properties” as well.
Need Analysis Template
  • You can change font size and color for better readability as well.
Need Analysis Template
  • When you are done with all the changes, click the “Save” button to save the changes.
Need Analysis Template
  • The final Pareto Column Chart is shown below.
Need Analysis Template

Key Insights

  • Of all root cause categories, skill deficiency claims the largest share of issues and affected cases, flagging it as the highest-leverage target for corrective action.
  • Three causes account for most identified needs, confirming strong Pareto concentration across the dataset.
  • Gap concentration in a handful of factors means targeted interventions can resolve the majority of identified needs.

Benefits of Using a Structured Need Analysis Template

Consistent structure transforms evaluation from a one-time activity into a repeatable practice. A need analysis template raises the quality of every assessment it governs by removing ambiguity from the process and giving stakeholders a shared reference point.

  • Improves clarity and focus: Replaces open-ended interpretation with a defined framework that keeps every evaluation pointed at specific, measurable outcomes.
  • Ensures consistent evaluation: Applies the same analytical logic across assessments so that findings from different teams or time periods remain comparable.
  • Saves analysis time: Provides ready-made criteria and structure that eliminates the need to build an evaluation approach from scratch each time.
  • Supports measurable outcomes: Anchors conclusions in quantifiable evidence rather than subjective impressions, making it easier to track progress over time.
  • Enhances reporting accuracy: Organizes findings into a structure that translates naturally into clear, reliable documentation and stakeholder communication.
  • Enables better planning: Converts gap analysis into a prioritized action list, giving planners a direct line from evidence to resource allocation decisions.

Best Practices for Applying a Training Needs Analysis Template

This framework delivers its full value only when applied with discipline. Adopting the practices below keeps evaluations sharp, credible, and aligned with the decisions they are meant to inform.

  • Define clear objectives upfront: Establish the purpose and scope of the analysis before gathering any data so that every subsequent step stays aligned with the intended outcome.
  • Use reliable data sources: Ground every conclusion in information that can be verified, traced, and defended to ensure the analysis holds up to scrutiny.
  • Involve key stakeholders: Incorporate the perspectives of those closest to the performance gaps to prevent blind spots and improve buy-in for recommended actions.
  • Review findings regularly: Revisit conclusions as conditions change rather than treating the analysis as a one-time artifact that remains valid indefinitely.
  • Align actions with goals: Trace every recommended action directly back to a strategic or operational objective so that nothing in the plan exists without clear justification.
  • Keep the template updated: Revise scoring criteria, metrics, and evaluation categories as the organization evolves to prevent the template from drifting out of alignment with current priorities.

FAQs

How do you write a needs analysis?

Start by defining the objective, then document the current state and establish the desired outcome. From there, measure the gap between the two and identify what it will take to close it. Credible data, clearly stated criteria, and conclusions that point directly to action are what separate a useful needs analysis from a description of problems.

What are the 5 steps of needs analysis?

The five steps are defining goals, assessing the current situation, establishing the desired state, identifying gaps, and recommending actions. Working through them in sequence produces an evaluation that is both logically complete and directly tied to evidence.

What makes a good needs analysis?

A good needs analysis is built on verifiable data, applies consistent evaluation criteria throughout, and connects every finding to a practical next step. It avoids assumptions, stays focused on measurable outcomes, and produces conclusions that a decision-maker can act on with confidence.

Wrap Up

A need analysis template changes how organizations make decisions. By replacing assumptions with structured measurement, it gives every evaluation a consistent starting point and a defensible path to action. Teams that use one regularly spend less time debating priorities and more time closing the gaps that actually produce measurable results.

When paired with analytical tools and visualization platforms, the findings become sharper and faster to communicate across teams. Planning improves, resource allocation becomes more precise, and improvement initiatives stay connected to evidence from start to finish. The structured approach makes better outcomes repeatable and defensible, not coincidental.

How much did you enjoy this article?

PBIAd1
Start Free Trial!
160029

Related articles

next previous
Data Analytics10 min read

Performance-Based Budgeting: Examples & Analysis

Performance-based budgeting links spending to measurable outcomes. Learn how it works, explore examples, benefits, challenges, and analyze PBB effectively in Excel.

Data Analytics9 min read

Remote Work Statistics: A Complete Visual Guide

Remote work statistics transform workforce activity into measurable insights that guide planning and policy. Discover how to analyze this data. Read on!

Data Analytics13 min read

Total Cost of Ownership Analysis for TCO Insights

Total cost of ownership analysis reveals every lifecycle cost behind any major decision. Stop guessing what investments truly cost. Read on!

Data Analytics10 min read

Value Stream Mapping Template: A Complete Guide

A value stream mapping template helps teams cut waste and improve flow. Learn how to design, analyze, and optimize your processes. Learn more!

Data Analytics12 min read

Sales Follow-Up Statistics: Insights That Improve Follow-Ups

Track and analyze sales follow-up statistics, response speed, outreach frequency, and conversions to improve your sales outcomes.

ChartExpo logo

Turn Data into Visual
Stories

CHARTEXPO

  • Home
  • Gallery
  • Videos
  • Services
  • Pricing
  • Contact us
  • FAQs
  • Privacy policy
  • Terms of Service
  • Sitemap

TOOLS

  • ChartExpo for Google Sheets
  • ChartExpo for Microsoft Excel
  • Power BI Custom Visuals by ChartExpo
  • Word Cloud

CATEGORIES

  • Bar Charts
  • Circle Graphs
  • Column Charts
  • Combo Charts
  • Comparison Charts
  • Line Graphs
  • PPC Charts
  • Sentiment Analysis Charts
  • Survey Charts

TOP CHARTS

  • Sankey Diagram
  • Likert Scale Chart
  • Comparison Bar Chart
  • Pareto Chart
  • Funnel Chart
  • Gauge Chart
  • Radar Chart
  • Radial Bar Chart
  • Sunburst Chart
  • see more
  • Scatter Plot Chart
  • CSAT Survey Bar Chart
  • CSAT Survey Chart
  • Dot Plot Chart
  • Double Bar Graph
  • Matrix Chart
  • Multi Axis Line Chart
  • Overlapping Bar Chart
  • Control Chart
  • Slope Chart
  • Clustered Bar Chart
  • Clustered Column Chart
  • Box and Whisker Plot
  • Tornado Chart
  • Waterfall Chart
  • Word Cloud
  • see less

RESOURCES

  • Blog
  • Resources
  • YouTube
SIGN UP FOR UPDATES

We wouldn't dream of spamming you or selling your info.

© 2026 ChartExpo, all rights reserved.