Categories
What if a risk assessment template in Excel could decide the survival of your business? Strange thought, right?


Let me show you why it is not strange. Research indicates that 60% of small companies cease operations within six months of experiencing a significant data loss or disruption. Most of these companies had no structured risk plan.
Numbers do not lie. Risks ignored today often become costs tomorrow. This is where a risk assessment template in Excel comes in. It becomes a practical map of threats, impacts, and actions.
Think of it as a mirror that reflects what could go wrong and how prepared you really are. Without it, leaders rely on guesswork, and guesswork is a risky business move.
But where do you start? That’s where tools step in. A risk assessment template in Excel works hand in hand with other planning aids. This spans from the SWOT analysis template in Excel to performance dashboards. These resources keep data structured and decisions grounded.
Risk will always exist. The question is whether you want to see it before it strikes or after it damages. The choice lies in preparation. And preparation begins with the right template.
Let me guide you…
Definition: A risk assessment template in Excel is a simple tool for spotting and tracking potential threats. It organizes risks in clear rows and columns. Each risk is described, rated, and given an action plan. This makes it easier to prioritize and monitor over time.
Many businesses combine this template with risk tolerance questionnaires to see how much risk the team can handle. Others link it to management reporting, allowing leaders to see updates quickly.
This template is flexible, easy to share, and practical for daily use. It helps teams stay ready for issues before they grow into larger problems.
Picture walking through a dark alley blindfolded. That’s how managing risks feels when there’s no clear plan in place. An Excel risk assessment template acts as a flashlight. It highlights threats, prioritizes responses, and guides better decisions before problems escalate.
This is why you should use this template:
Picture trying to assemble a puzzle without being able to look at the pieces. That’s what managing business risks is like without a template. An Excel risk template offers you everything in a single place, enabling you to clarify threats, assign actions, and monitor progress.
Here’s how to structure it:
Imagine trying to protect your business from every possible setback without a plan. It feels impossible. That is where a risk assessment template in Excel becomes a game-changer. It helps organize threats, assign responsibility, and track actions efficiently. These examples make it easier to see how this tool works in real scenarios:
Creating a risk assessment template in Excel is a straightforward process. The goal is to track risks, measure impact, and assign responsibility efficiently.
Follow these steps to make it much more powerful.
Have you ever tried reading a spreadsheet full of numbers and felt your brain start to cry? That is what creating and analyzing a risk assessment template in Excel can feel like without visuals. Numbers tell a story, but spotting trends and patterns in raw data is tough.
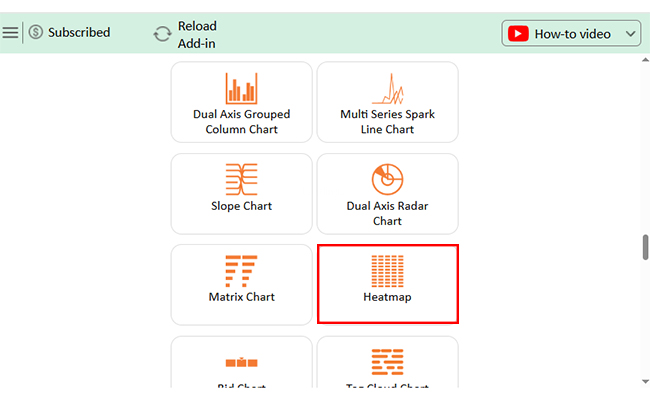
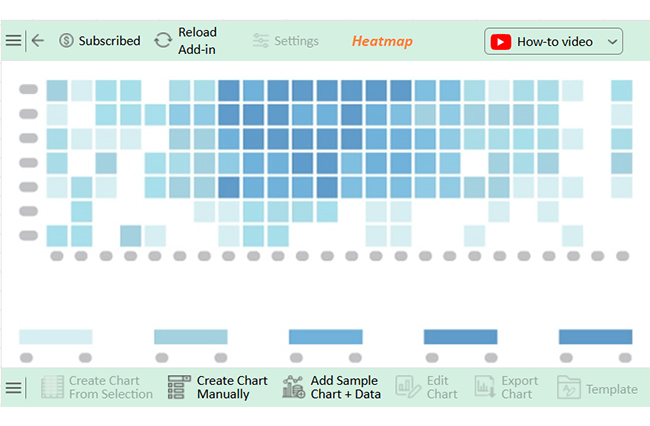
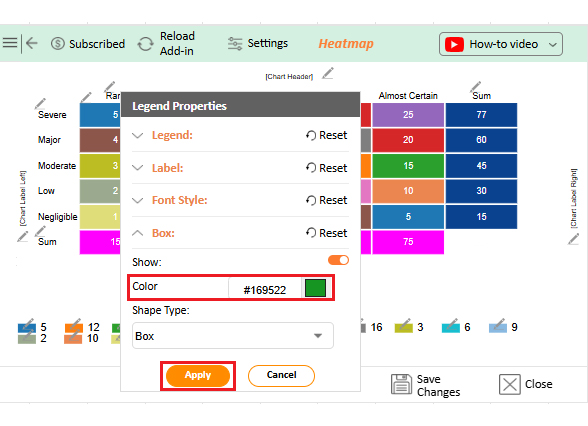
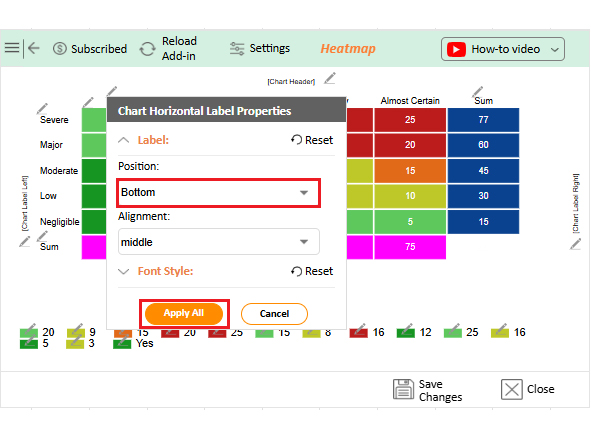
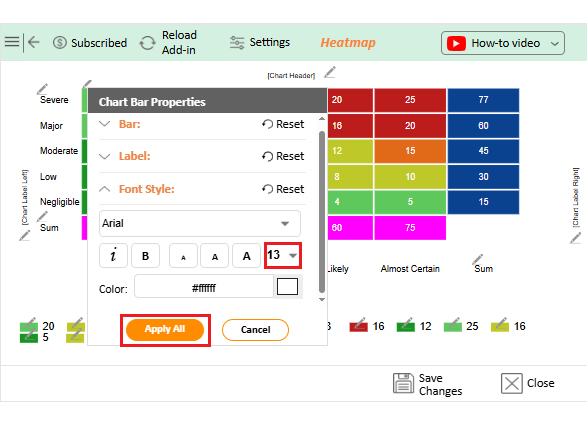
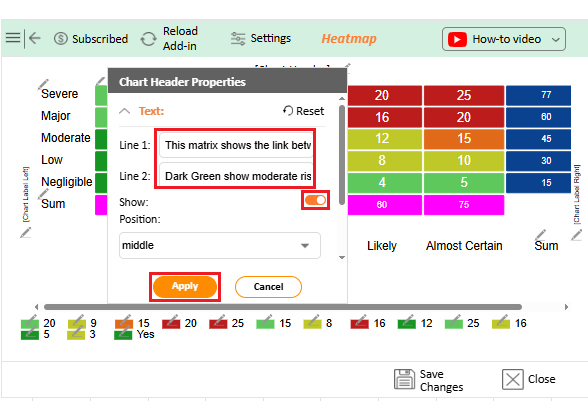
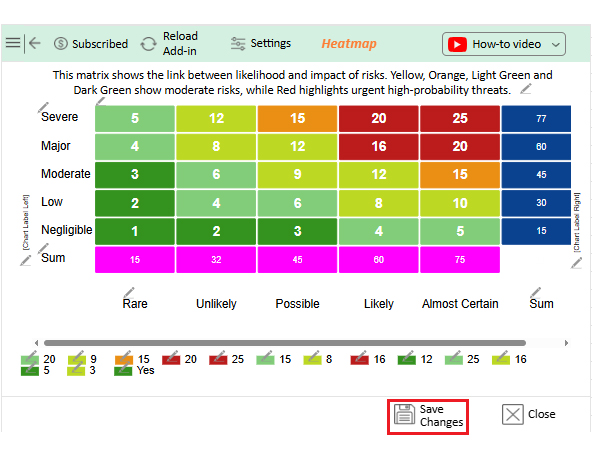
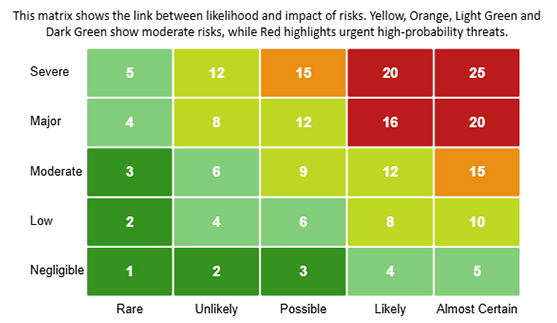
Excel has basic charts, but they often fall short when you need clear, actionable insights. This is where ChartExpo comes in. It transforms dry data into easy-to-understand visuals. Suddenly, risk scores, impact levels, and likelihoods jump off the page. Data becomes not just readable, but meaningful.
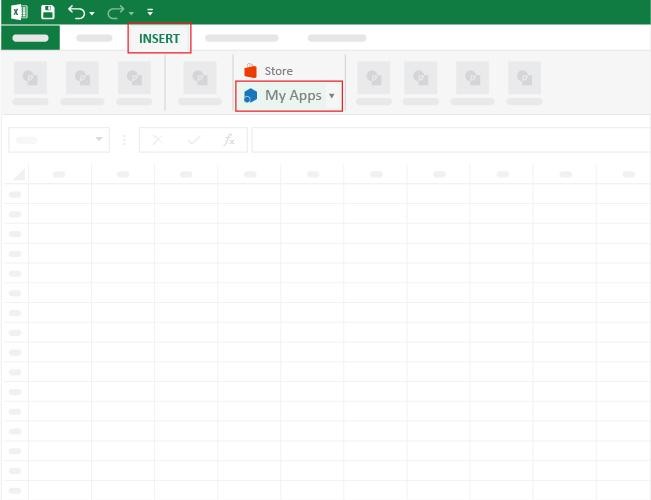
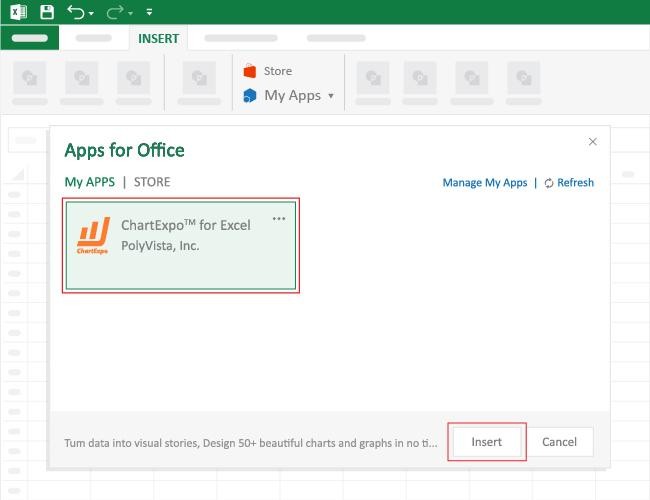
How to Install ChartExpo in Excel?
ChartExpo charts are available both in Google Sheets and Microsoft Excel. Please use the following CTAs to install the tool of your choice and create beautiful visualizations with a few clicks in your favorite tool.
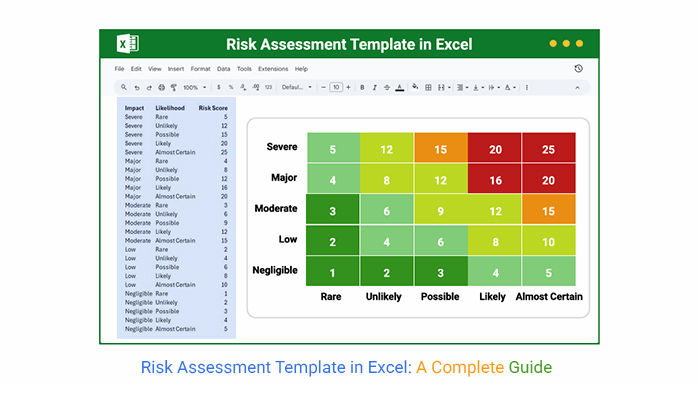
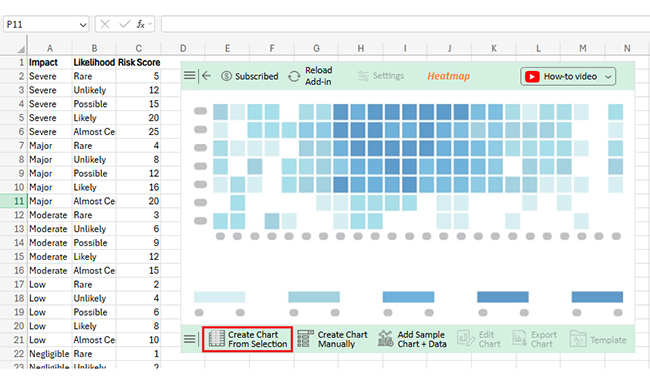
Let’s analyze this risk assessment sample data in Excel using ChartExpo.
| Impact | Likelihood | Risk Score |
| Severe | Rare | 5 |
| Severe | Unlikely | 12 |
| Severe | Possible | 15 |
| Severe | Likely | 20 |
| Severe | Almost Certain | 25 |
| Major | Rare | 4 |
| Major | Unlikely | 8 |
| Major | Possible | 12 |
| Major | Likely | 16 |
| Major | Almost Certain | 20 |
| Moderate | Rare | 3 |
| Moderate | Unlikely | 6 |
| Moderate | Possible | 9 |
| Moderate | Likely | 12 |
| Moderate | Almost Certain | 15 |
| Low | Rare | 2 |
| Low | Unlikely | 4 |
| Low | Possible | 6 |
| Low | Likely | 8 |
| Low | Almost Certain | 10 |
| Negligible | Rare | 1 |
| Negligible | Unlikely | 2 |
| Negligible | Possible | 3 |
| Negligible | Likely | 4 |
| Negligible | Almost Certain | 5 |


Imagine having a tool that spots business risks before they become problems. A risk assessment template in Excel can do that. It organizes threats, tracks mitigation plans, and assigns responsibility. Using it correctly can save time and prevent costly mistakes.
How do you get started?
Managing risks without a clear plan is like driving blindfolded. You never know what’s coming next. A risk assessment template in Excel provides a clear vision. It organizes threats, tracks mitigation steps, and clearly highlights priorities. Here’s how the right template can transform how your business handles uncertainty:
A risk assessment includes the following:
Each part helps spot threats, measure impact, plan responses, assign responsibility, and track progress over time.
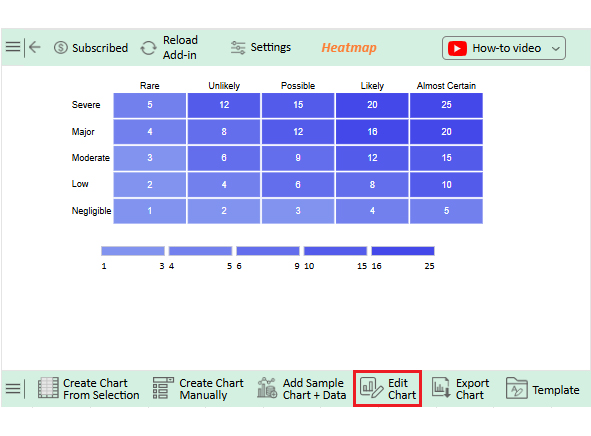
The five-by-five template rates risks on a 1 to 5 scale for likelihood and impact. Scores are multiplied to give a risk rating. It helps prioritize risks and focus on the most critical areas quickly.
Creating and analyzing a risk assessment template in Excel is not just a task. It is a strategy to protect your business. A clear template shows risks, assigns responsibility, and tracks mitigation steps. This makes your operations smarter and safer.
Understanding what key risk indicators are helps you spot serious risks early. The sooner you identify problems, the faster you can take action.
The first step is identifying threats. Use columns for likelihood, impact, and mitigation.
Next, assign ownership. Pair your template with a responsibility assignment matrix template to make accountability clear. Each team member knows their tasks, which reduces confusion and ensures follow-up.
Visualization matters. Excel charts are fundamental and sometimes complex to read. Installing ChartExpo brings your data to life. Risks, trends, and scores become easy to understand, allowing you to create reports that impress stakeholders.
Integration is important. Combine your risk template with a business development plan template to align risks with growth. Track team effort using a time-tracking template for Excel. This ensures resources are used efficiently and priorities are clear.
So…Do not hesitate. Start using your risk assessment template in Excel today.
Start by installing ChartExpo. This will enhance visualization, risk tracking, and data analysis. The right tools transform risk management from guesswork into a transparent and actionable process.
How much did you enjoy this article?


Learn how to use sparklines in Excel to quickly visualize trends inside cells. Discover types, creation steps, customization, use cases, benefits, and best practices.

Learn what a confidence interval graph is, how to create it in Excel, and how to interpret results to make more reliable, data-driven decisions.

A correlation matrix in Excel helps identify relationships between variables. Learn how to create, read, and use it for effective data analysis.


